University of South Carolina
Scholar Commons
Theses and Dissertations
2017
The Nutrition Assistance Landscape in Afterschool
Programs: Understanding the Gap between
Research, Policy, and Practice
Falon Elizabet TilleyUniversity of South Carolina
Follow this and additional works at:https://scholarcommons.sc.edu/etd Part of theExercise Science Commons
This Open Access Dissertation is brought to you by Scholar Commons. It has been accepted for inclusion in Theses and Dissertations by an authorized administrator of Scholar Commons. For more information, please [email protected].
Recommended Citation
T
HEN
UTRITIONA
SSISTANCEL
ANDSCAPEI
NA
FTERSCHOOLP
ROGRAMS:
U
NDERSTANDINGT
HEG
APB
ETWEENR
ESEARCH,
P
OLICY,
A
NDP
RACTICEby
Falon Elizabet Tilley
Bachelor of Science Wingate University, 2006
Master of Science
University of South Carolina, 2011
Submitted in Partial Fulfillment of the Requirements
For the Degree of Doctor of Philosophy in
Exercise Science
The Norman J. Arnold School of Public Health
University of South Carolina
2017
Accepted by:
Michael W. Beets, Major Professor
Gabrielle Turner-McGrievy, Committee Member
Justin B. Moore, Committee Member
R. Glenn Weaver, Committee Member
ii
iii
D
EDICATIONThis dissertation is dedicated to Elissa Ann Lockamy, whose memory is forever in my
heart; guiding me, inspiring me, and reminding me to pursue life with determination and
iv
A
CKNOWLEDGEMENTSI would like to offer my sincere appreciation to all those who have encouraged
and supported me throughout this challenging, yet rewarding journey.
To my advisor and committee chair, Dr. Michael Beets, words cannot express
how thankful I am for your guidance. For the better part of a decade, you have mentored
me – arming me with experience and opportunity, from which I will continue to apply the
lessons learned through all of my future endeavors. Thank you for investing your time
and resources into my professional growth; for your leadership, your patience; and most
importantly, for challenging me to push beyond my limits, because that is where I truly
discovered the depths of my potential. To my remaining committee members, Drs. Brie
Turner-McGrievy, Justin Moore, and Glenn Weaver, thank you for your continued
guidance, feedback, and for helping me get through journal reviews with my self-esteem
intact. I would also like to thank Drs. Steven Blair and Christine Blake for their
contributions during the planning and implementation of the dissertation studies.
I would like to thank the Office of the Vice President for Research at the
University of South Carolina for their financial support. Many thanks to the South
Carolina Afterschool Alliance and Department of Social Services, Division of Early Care
and Education for their assistance with participant recruitment. I would also like to
extend my appreciation to all of the afterschool program administrators who participated
in this dissertation. To my colleagues in the Policy to Practice in Youth Programs
v
To all those I consider family, I would not be where I am or who I am today
without your love and support. To my sister, Cindy, you may have unknowingly been the
first person to inspire me to become a doctor so I could “boss my sister around”. Thank
you for continuing to inspire me to this day. Thank you to my nieces, Alayna and
Lauralin, for breaking me away from the computer to have a little fun every now and
then. To my goddaughter, Ada, thank you for lifting my spirits with your sweet notes,
artwork, and videos. My best friends, Virginia (“Burk”) and Lauren, you have been a
constant source of encouragement and support; helping me push through every obstacle
and celebrate every achievement along the way. Burk, thank you for keeping me
grounded, for always knowing exactly what to say to calm the chaos of my mind, and for
reminding me to appreciate just how far I have come. Lauren, thank you for being the
voice of reason when I needed it, for the numerous pep talks, and all the time you spent
discussing, reading, and revising this dissertation. My boyfriend Charles, who has kept
the light illuminated at the end of the tunnel; even from 4,000 miles away. No matter the
distance between us, from your words of wisdom to your hilarious witticisms, I have
always felt your unwavering support. Thank you for always being there, for listening and
encouraging, but most of all, thank you for being you. Last, but certainly not least, my
parents, Ronald and Betty, you have taught me that with patience, dedication, and belief
in myself I can accomplish anything. Dad, thank you for your sage advice and continued
support, both emotional and financial, which has helped me achieve this milestone. Mom,
thank you for your endless support, encouraging words, and for always reminding me
that “where there’s a will there’s a way.” Thank you both for being the best role models,
vi
A
BSTRACTThe Child and Adult Care Food Program (CACFP) aims to increase
children’s access to healthful foods in out-of-home care. Approximately half of the 10.2
million children enrolled in afterschool programs (ASPs) are eligible for nutrition
assistance through programs like CACFP. Despite awareness of its potential impact on
the nutritional status of millions of children, CACFP is underutilized among ASPs and
notably understudied in comparison to other federal nutrition assistance programs.
This dissertation addresses key gaps in CACFP research and provides a deeper
understanding of the nutrition assistance landscape in afterschool programs by (1)
assessing the type of afterschool snacks served under CACFP guidance, (2) evaluating
the nutrient content of snacks by ASPs’ CACFP participation, and (3) examining the
challenges and benefits to CACFP enrollment as perceived by ASP administrators. A
cross-sectional, mixed methods design with stratified, purposeful sampling of ASPs
based on CACFP eligibility and enrollment was employed to examine the three study
aims. Thirty-five administrators, representing 60 ASPs based in South Carolina
participated in studies 1 and 2. Participants completed phone interviews; providing
sample snack menus and nutrition policy information. Study 3, a qualitative investigation
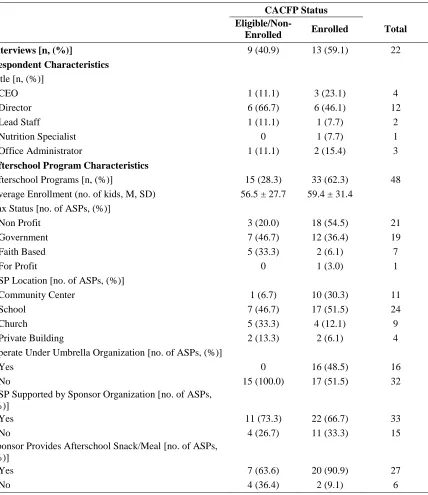
of CACFP enrollment barriers, was conducted with a subsample of 22 administrators
from CACFP-enrolled ASPs and those eligible, but not enrolled.
Study 1 assessed the relationship between the average weekly servings of
vii
status and (2) snack standards/guidelines utilized. ASPs enrolled in CACFP and adhering
exclusively to their guidelines served significantly higher quantities of sugar-based
snacks and fewer fresh fruits and vegetables than their peer ASPs.
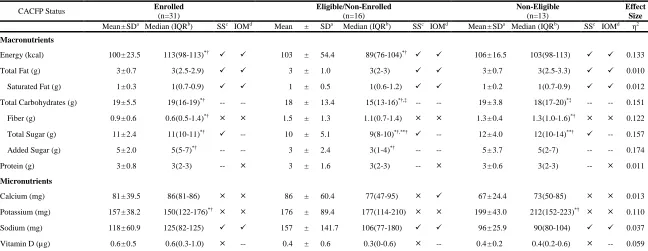
For study 2, the energy and macro/micronutrient content of snacks, determined
using the US Department of Agriculture’s (USDA) Nutrient Database, was compared: (1)
across CACFP-eligibility/enrollment groups and (2) to existing USDA and Institute of
Medicine nutrition standards. Snacks served in CACFP-enrolled ASPs were of lower
nutritional quality than those served in CACFP-non-enrolled ASPs; containing
significantly more energy, carbohydrates, total sugar, and added sugar. Across
CACFP-eligibility/enrollment groups, snacks failed to meet many nutrient guidelines indicative of
a healthy diet.
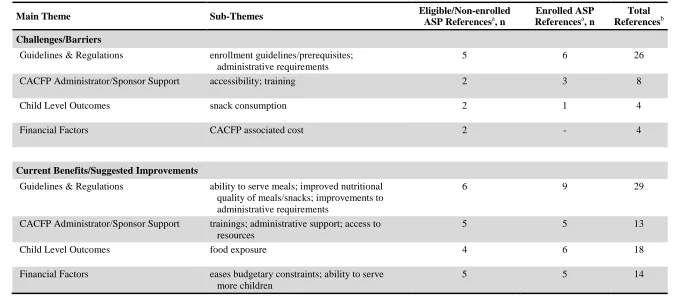
Study 3 aimed to identify plausible explanations behind CACFP’s
underutilization among ASPs. Respondents participated in semi-structured qualitative
interviews assessing their knowledge, experience, and perceptions surrounding nutrition
assistance programs. CACFP-enrolled ASP administrators had a more favorable
impression of nutrition assistance programs; however, both groups expressed similar
CACFP-specific benefits and challenges. Both groups felt CACFP’s greatest strengths
were the program’s monetary incentives and perceived impact on the nutritional quality
of meals/snacks. Challenges include enrollment guidelines, paperwork demands, and
lack of perceived administrator/sponsor support. Respondents provided suggestions for
strengthening CACFP by addressing these key challenges.
This dissertation adds to the body of literature surrounding nutrition assistance
viii
type and nutritional content of snacks served in CACFP ASPs, as well as the first to
capture the benefits and barriers to CACFP enrollment from the perspective of ASP
administrators. In summary, this dissertation provides insight into the current state of
CACFP in ASPs. Understanding the program’s strengths and weaknesses is crucial to
developing effective strategies to increase participation within the afterschool setting and
ensure that children are provided with nutritious snacks that support healthy growth and
ix
T
ABLEO
FC
ONTENTSDEDICATION ... iii
ACKNOWLEDGEMENTS ... ⅳ ABSTRACT ... ⅵ LIST OF TABLES ... ⅺ CHAPTER I: INTRODUCTION ...1
CHAPTER II: AFTERSCHOOL SNACKS: A COMPARISON BY CHILD AND ADULT CARE FOOD PROGRAM ELIGIBILITY AND ENROLLMENT STATUS AND ADOPTED SNACK GUIDELINES ...14
ABSTRACT ...15
INTRODUCTION ...16
METHODS ...18
RESULTS ...23
DISCUSSION ...28
REFERENCES ...37
CHAPTER III: NUTRITIONAL QUALITY OF SNACK OFFERINGS IN AFTERSCHOOL PROGRAMS: A COMPARISON BETWEEN CHILD AND ADULT CARE FOOD PROGRAM (CACFP) ELIGIBILITY AND ENROLLMENT GROUPS ...42
ABSTRACT ...43
INTRODUCTION ...44
METHODS ...46
RESULTS ...50
x
REFERENCES ...60
CHAPTER IV: NUTRITION ASSISTANCE IN AFTERSCHOOL PROGRAMS: A QUALITATIVE INVESTIGATION OF STAFF PERCEIVED BARRIERS AND BENEFITS TO PARTICIPATING IN THE CHILD AND ADULT CARE FOOD PROGRAM ...65
ABSTRACT ...66
INTRODUCTION ...67
METHODS ...68
RESULTS ...71
DISCUSSION ...78
REFERENCES ...86
CHAPTER V: SUMMARY AND CONCLUSIONS ...89
SIGNIFICANCE ...89
PURPOSE ...89
MAJOR FINDINGS ...90
LIMITATIONS ...91
CONSIDERATIONS FOR FUTURE RESEARCH...93
CONCLUSION ...94
REFERENCES ...96
BIBLIOGRAPHY ...98
xi
L
ISTO
FT
ABLESTable 2.1 Characteristics of Afterschool Programs by Child and Adult Care Food
Program Eligibility and Enrollment Status ...33
Table 2.2 National and State Organization Afterschool Snack Guidelines Reported ...34
Table 2.3 Comparison of Average Weekly Servings of Food and Beverage Items by Child and Adult Care Food Program Eligibility and Enrollment Status ...35
Table 2.4 Comparison of Average Weekly Servings of Food and Beverage Items by Snack Guidelines Followed ...36
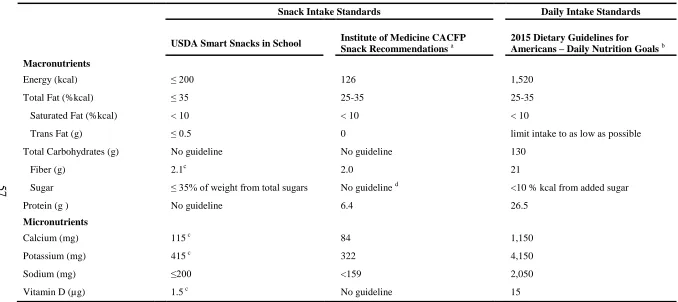
Table 3.1 Nutrition Standards for Assessing Afterschool Snack Quality ...57
Table 3.2 Descriptive Characteristics of Afterschool Programs stratified by Child and Adult Care Food Program Eligibility and Enrollment Status ...58
Table 3.3 Comparison of Snack Nutrient Content by Child and Adult Care Food Program Eligibility and Enrollment Status and Compliance to Reference Standards ...59
Table 4.1 Respondent and Afterschool Program Characteristics Stratified by Child and Adult Care Food Program Eligibility and Enrollment Status ...83
Table 4.2 Reported Awareness and Experience Surrounding Nutrition Assistance
Programs by Eligible/Non-Enrolled Program Respondents ...84
Table 4.3 Afterschool Program Leader Perceived Barriers and Benefits to CACFP
1
C
HAPTERI
I
NTRODUCTIONChildhood obesity is a pervasive problem across the United States; affecting over
12 million children and adolescents.1 With children now suffering from chronic
weight-related diseases previously seen only in adults, the need to address this problem is
ugent.2-4 Nutrition has long been considered one of the leading modifiable determinants
of obesity. Despite public awareness of the importance of a healthy diet, children across
the nation consume large quantities of energy-dense foods, such as cookies and chips and
less than recommended amounts of fruits and vegetables.5,6 Alarmingly, nearly 40% of
children’s daily energy intake comes from empty calories (ie, foods/beverages with
little-to-no nutritional value); resulting in under-consumption of key vitamins and minerals.7-9
These current trends are concerning, as unhealthy dietary habits not only interfere with a
child’s physical and cognitive development but also puts them at greater risk for chronic
weight-related health conditions, such as type 2 diabetes and hypertension.2,4
Fortunately, there is ample evidence that these adverse health outcomes can be prevented
or alleviated by improving dietary habits.2,10-12 Despite this evidence, generating abiding
improvements in dietary habits across the population is challenging.13 This is largely due
to the complexity of eating behavior, which is influenced by a network of individual and
environmental factors.13-16 Specific to children, there is growing interest in the role of the
physical environment on dietary habits. Children spend up to 35 hours each week away
2
afterschool programs (ASPs). Because meals and snacks can be served in each of these
settings, it is possible for children to consume their entire daily energy intake away from
home.9,15,18 Thus, facilitating improvements in the food environment (ie, system of food
policy, procurement, distribution, and access) across these settings has the potential to
generate a positive shift in the dietary habits of children across the nation.
Despite increased recognition of the important role ASPs play in combating
obesity, studies on child food environments largely focus on schools and full-day child
care centers.14-16,19 This is a missed opportunity, because nearly half of the 10.2 million
children attending ASPs come from low-income households;20,21 putting them at greater
risk for obesity.1,22 While limited, existing research shows promise for improving the
afterschool food environment using community-based, policy-level approaches.23-28 The
main modification to the afterschool food environment shared among these interventions
was the implementation of snack policies and standards.23-28 Although many ASP
providers recognize the importance of providing healthy snacks and meals, they struggle
to meet nutrition guidelines; citing cost as a major barrier.29-31 To address these concerns,
several studies facilitated partnerships between ASPs and local food stores who could
help the programs procure healthy foods within their allotted snack budget.23-26 While
promising, this strategy alone may not be enough to counteract the severe financial
constraints placed upon many ASPs.
Funding for ASPs has not risen to match the rapid increase in demand for their
services.32-37 As a result, many ASPs are forced to reduce staff, operate with inadequate
resources, limit services, or even shutdown operation.35-37 This is especially true for
3
stable.37 Generally, the majority of an ASP’s budget comes from tuition fees.36
However, ASPs serving low-income communities are less likely to receive tuition from
parents and therefore, rely heavily upon other funding sources (eg, grants, businesses,
individual donors).36 As funding from these sources is far from adequate, ASPs face
budgetary challenges.36 Food cost is one of the highest budget items for child care
programs;38 and for financially strapped ASPs, making even minor adjustments in the
foods and beverages served may result in an operating deficit.
For many ASPs, the ability to serve snacks and meals to children in their care is
dependent on their utilization of nutrition assistance programs. The US Department of
Agriculture’s (USDA), Child and Adult Care Food Program (CACFP) is the leading
nutrition assistance program for children outside of home and school (eg, family day care
homes, preschool centers, ASPs). Unlike most federal nutrition assistance programs,
which determine eligibility and distribute benefits at the individual level, CACFP
operates at the program level.39,40 ASPs located in a public school attendance area where
at least 50 percent of students are eligible for the National School Lunch Program are
considered ‘area eligible’ and can receive full reimbursement for snacks and meals served
in accordance with CACFP guidelines.40
Similar to ASPs, the success of a nutrition assistance program is highly
dependent on consistent and adequate funding. To secure funding, federal nutrition
assistance programs undergo continuous evaluations of their program’s reach, operation,
and effectiveness. CACFP is considered one of the leading child nutrition programs with
the potential to improve the nutritional status of millions of children; yet, it is one of the
4
information regarding CACFP arose after the Healthy Hunger Free Kids Act of 2010,
which required CACFP to evaluate and revise their nutrition guidelines for the first time
in over 20 years.31,42 Nearly seven years later, while still in its infancy, CACFP research
is growing. Evidence indicates an increase in program participation. The number of
children served by the program rose to nearly three million in 2014; an 8% increase from
the previous year.43 Additionally, there has been an increase in studies evaluating the
nutritional quality of CACFP approved foods and beverages in full-day child care
centers.44-46 This research undoubtedly represents a positive shift in focus on evaluating
and improving CACFP, however, significant gaps in afterschool-specific CACFP
research still exist. What we do know is that CACFP is failing to reach millions of
children in ASPs. There are approximately 4.6 million children eligible for nutrition
assistance in ASPs alone,21 yet ASPs represent only a small fraction (5%) of facilities
participating in CACFP.31 Aside from awareness of the need to increase participation,
little else is known about CACFP in ASPs. To date, the content and nutritional quality of
meals and snacks served in CACFP-enrolled ASPs, how they compare to those served in
non-enrolled ASPs, and their adherence to existing nutrition guidelines is unknown.
To address these gaps in research and expand the body of literature surrounding
nutrition assistance programs, this three-study dissertation employed a mixed-method,
cross-sectional approach to investigate the current state of CACFP in ASPs. Although
meals and snacks can be served through CACFP, this dissertation focuses solely on
snacks served in ASPs. The reason for this is twofold. First, evidence suggests that
snacking may be a significant contributor overweight and obesity.47-49 Over 97% of
5
over a quarter of a child’s total daily energy and micronutrient intake.9,47,50
Secondly,
ASPs selected for study participation were stratified based on their program’s eligibility
and enrollment in CACFP. This allowed for comparisons between ASPs enrolled in
CACFP, those who were CACFP-eligible but not enrolled, and those who were not
eligible for CACFP. Although meal data was collected, few ASPs served meals;
resulting in the inability to facilitate accurate comparisons between the three
CACFP-eligibility/enrollment groups. Given the aforementioned financial burdens ASPs face, it
is plausible that the programs most likely to serve meals are, in fact, those already
enrolled in CACFP.
The purpose of study 1 was to evaluate the type of afterschool snacks served
under CACFP guidance. Specifically, comparisons in the average weekly servings of ten
different snack food and beverage categories were made between the three
CACFP-eligibility/enrollment groups. A secondary objective of the study was to compare snacks
served across ASPs grouped by snack guidelines utilized. Assessing how the various
snack guidelines impact afterschool snack quality is a critical first step in developing a
unified set of afterschool nutrition standards that supports healthy dietary habits among
children. Fundamental to this study was the use of broad component-based categories
(eg, fresh fruits, salty snacks, sugar-sweetened beverages) in evaluating snack content.
This method improves upon those used in existing studies, where snacks served in
full-day child care programs are compared to nutrition guidelines based off of Dietary
Reference Intake values specific to meal occasions (ie, breakfast, lunch, and dinner).9,46,51
Because no snack-specific Dietary Reference Intake values currently exist, the nutrient
6
Further, at the time of this study, there were no nutrient-specific standards or established
protocol for assessing the nutrient content of snacks served under CACFP guidance. By
using broad component-based categories, this study evaluated the content of afterschool
snacks in a manner consistent with CACFP guidelines.
To address the lack of established protocol for assessing the nutrient content of
CACFP-approved snacks, study 2 drew upon existing nutrient analysis protocols and
relevant literature to compile a set of snack-specific nutrient standards. Snack energy and
macro/micronutrient content was compared across the three
CACFP-eligibility/enrollment groups, as well as to the reference standards. This study holds
significance for researchers, CACFP professionals, and ASP administrators. First, the
evaluation of snack nutrient content between ASPs grouped according to CACFP
eligibility and enrollment is of crucial importance, given that CACFP is premised on its
ability to improve quality and healthfulness of snacks served to children through program
enrollment.52 To that end, ASPs who are enrolled in CACFP should, in theory, serve
higher quality snacks than their counterparts; those ASPs who are eligible but not
enrolled. Likewise, the snacks served in CACFP-enrolled ASPs should be comparable to
those served in higher income ASPs who are not eligible for CACFP. Findings from this
study establish evidence regarding the validity of this argument. Secondly, by utilizing
snack-specific standards, we gain a better perspective of the nutritional quality of snacks
served in the afterschool setting. This is significant, as ASPs have been called upon to
serve nutritionally adequate snacks to children in their care.53-56 While snack nutrition
standards are sparse and often not specific to the afterschool setting, these guidelines can
7
Study 3 aimed to identify plausible explanations behind CACFP’s
underutilization among ASPs through a qualitative investigation of the factors
influencing program uptake among ASP administrators. Specifically, administrators
from CACFP-enrolled ASPs and those eligible but not enrolled participated in
semi-structured interviews assessing their knowledge, experience, and perceptions surrounding
nutrition assistance programs, as well as any perceived benefits or barriers specific to
CACFP enrollment. By including administrators from both ASPs enrolled in CACFP
and those who were eligible but not enrolled, this study offers insight into the similarities
and differences between the two groups and brings awareness to other factors (eg, ASP
setting, affiliation with umbrella organization) potentially mediating enrollment in
CACFP. Additionally, this study provides a novel assessment of the barriers to CACFP
enrollment because it is the first to include ASP administrators; whereas, previous
research on afterschool-specific CACFP barriers used proxy reports from third party
organizations (eg, nutrition coalitions, state level education agencies) not directly
involved in the enrollment process.57 Findings from this study can inform CACFP’s
governing body of the need to reevaluate existing dissemination methods within the
afterschool community. Current efforts to increase ASP enrollment in CACFP can be
strengthened by allocating resources to resolve the most pervasive barriers revealed
within this study.
This dissertation represents an important step in bridging the gap between
CACFP research, policy, and practice. Collectively, findings from the three studies
provide novel insight into the current state of CACFP in ASPs. The evidence presented
8
CACFP guidance but also provides important information on how these snacks compare
to those served in ASPs not enrolled in CACFP. This information can serve as catalyst
for more in-depth evaluations of CACFP’s snack guidelines. In turn, these evaluations
can inform policy revisions; engendering improvements in the nutritional quality of
snacks served through the program. Additionally, this dissertation provides a broader
understanding of the barriers to CACFP enrollment from the unique perspective of ASP
administrators. This is significant because identifying and addressing the challenges to
CACFP enrollment ASP administrators experience is vital to the program’s uptake and
9
References
1. Ogden CL, Carroll MD, Fryar CD, Flegal KM. Prevalence of Obesity Among Adults and Youth: United States, 2011-2014. NCHS data brief. 2015(219):1-8.
2. Kumar S, Kelly AS. Review of Childhood Obesity: From Epidemiology,
Etiology, and Comorbidities to Clinical Assessment and Treatment. Mayo Clinic
proceedings. 2017;92(2):251-265.
3. Freedman DS, Mei Z, Srinivasan SR, Berenson GS, Dietz WH. Cardiovascular risk factors and excess adiposity among overweight children and adolescents: the Bogalusa Heart Study. The Journal of pediatrics. 2007;150(1):12-17.e12.
4. Botero D, Wolfsdorf JI. Diabetes mellitus in children and adolescents. Archives of
medical research. 2005;36(3):281-290.
5. Keast D, Fulgoni V, Nicklas T, O'Neil C. Food Sources of Energy and Nutrients among Children in the United States: National Health and Nutrition Examination Survey 2003-2006. Nutrients. 2013;5:283-301.
6. Nicklas T, Baranowski T, Cullen K, Berenson G. Eating Patterns, Dietary Quality and Obesity. Journal of American College of Nutrition. 2001;20(6):599-608.
7. Reedy J, Krebs-Smith SM. Dietary sources of energy, solid fats, and added sugars among children and adolescents in the United States. J Am Diet Assoc.
2010;110(10):1477-1484.
8. Poti JM, Slining MM, Popkin BM. Solid fat and added sugar intake among U.S. children: The role of stores, schools, and fast food, 1994-2010. American journal
of preventive medicine. 2013;45(5):551-559.
9. Hess J, Slavin J. Snacking for a cause: nutritional insufficiencies and excesses of U.S. children, a critical review of food consumption patterns and macronutrient and micronutrient intake of U.S. children. Nutrients. 2014;6(11):4750-4759.
10. Flynn MA, McNeil DA, Maloff B, et al. Reducing obesity and related chronic disease risk in children and youth: a synthesis of evidence with 'best practice' recommendations. Obesity reviews : an official journal of the International
Association for the Study of Obesity. 2006;7 Suppl 1:7-66.
11. Ogata BN, Hayes D. Position of the Academy of Nutrition and Dietetics: nutrition guidance for healthy children ages 2 to 11 years. J Acad Nutr Diet.
10
12. U.S. Department of Health and Human Services, and U.S. Department of Agriculture. 2015-2020 Dietary Guidelines for Americans. 2015.
13. Swinburn B, Egger G, Raza F. Dissecting obesogenic environments: the development and application of a framework for identifying and prioritizing environmental interventions for obesity. Prev Med. 1999;29(6 Pt 1):563-570.
14. Larson N, Story M. A review of environmental influences on food choices.
Annals of behavioral medicine : a publication of the Society of Behavioral
Medicine. 2009;38 Suppl 1:S56-73.
15. Story M, Kaphingst KM, Robinson-O'Brien R, Glanz K. Creating healthy food and eating environments: policy and environmental approaches. Annu Rev Public
Health. 2008;29:253-272.
16. Glanz K. Measuring food environments: a historical perspective. American
journal of preventive medicine. 2009;36(4 Suppl):S93-98.
17. Laughlin L. Who's Minding the Kids? Child Care Arrangements: Spring 2011. In: U.S. Department of Commerce, Economics and Statistics Administration, Bureau USC, eds2013.
18. Mancino L, Todd JE, Guthrie J, Biing-Hwan L. How Food Away From Home
Affects Children's Diet Quality. United States Department of Agriculture,
Economic Research Service;2010. 104.
19. Larson N, Ward DS, Neelon SB, Story M. What Role Can Child-Care Settings Play in Obesity Prevention? A Review of Evidence and Call for Research Efforts.
American Dietetic Association. 2011;111:1343-1362.
20. Afterschool Alliance. The Importance of Afterschool and Summer Learning Programs in African-American and Latino Communities. Afterschool Alert Issue
Brief 2013;
http://www.afterschoolalliance.org/issue_briefs/issue_African-American-Latino-Communities_59.pdf,
http://www.afterschoolalliance.org/after_out.cfm. Accessed 3-19, 2014.
21. Afterschool Alliance. America After 3PM: Afterschool Programs in Demand.
Washington, D.C.2014.
22. Chen D, Thomsen MR, Nayga RM, Jr., Bennett JL. Persistent disparities in obesity risk among public schoolchildren from childhood through adolescence.
Prev Med. 2016;89:207-210.
11
24. Beets MW, Tilley F, Weaver RG, Turner-McGrievy G, Moore JB, Webster C. From policy to practice: addressing snack quality, consumption, and price in after-school programs. J Nutr Educ Behav. 2014;46(5):384-389.
25. Beets MW, Turner-McGrievy B, Weaver RG, et al. Intervention leads to
improvements in the nutrient profile of snacks served in afterschool programs: a group randomized controlled trial. Translational Behavioral Medicine.
2016;6(3):329-338.
26. Beets MW, Weaver RG, Turner-McGrievy G, et al. Making Healthy Eating Policy Practice: A Group Randomized Controlled Trial on Changes in Snack Quality, Costs, and Consumption in After-School Programs. American journal of
health promotion : AJHP. 2015.
27. Mozaffarian R, Wiecha J, Roth B, Nelson T, Lee R, Gortmaker S. Impact of an Organizational Intervention Designed to Improve Snack and Beverage Quality in YMCA After-Shool Programs. American Journal of Public Health. 2010.
28. Cassady D VR, Oto-Kent D, Mosley R, Lincoln R. . The power of policy: a case study of healhty eating among children. American Journal of Public Health.
2006;96(9):1570-1571.
29. Hastmann TJ, Bopp M, Fallon EA, Rosenkranz RR, Dzewaltowski DA. Factors influencing the implementation of organized physical activity and fruit and vegetable snacks in the HOP'N after-school obesity prevention program. J Nutr
Educ Behav. 2013;45(1):60-68.
30. Mozaffarian RS, Andry A, Lee RM, Wiecha JL, Gortmaker SL. Price and
healthfulness of snacks in 32 YMCA after-school programs in 4 US metropolitan areas, 2006-2008. Preventing chronic disease. 2012;9:E38.
31. The Institute of Medicine. Child and Adult Care Food Program: Aligning Dietary
Guidance for All. Washington (DC)2011.
32. Afterschool Alliance. 21st Century Community Learning Centers, Providing Afterschool and Summer Learning Supports to Communities Nationwide.
Washington, DC2013.
33. Afterschool Alliance. Afterschool Essentials: Research and Polling. Afterschool
Issue Overview 2012; http://www.afterschoolalliance.org/researchFactSheets.cfm.
Accessed 10-4, 2012.
34. Food Research and Action Center, America's Second Harvest. State Government
12
35. Halpern R. The Promise of After-School Programs for Low-income Children. .
Early Childhood Research Quarterly. 2000;15(2):185-214.
36. Alison E. Roadmap to Afterschool for All, Examining Current Investments and
Mapping Future Needs. Afterschool Alliance;2009.
37. Afterschool Alliance. Uncertain Times: Afterschool Programs Still Struggling in
Today's Economy. 2012.
38. Operating Budgets: Developing Workable Budgets for a Child Care Center. Child
Care, Inc.;2001.
39. Mercier S. Review of U.S. Nutrition Assistance Policy: Programs and Issues. Washington, DC: AGree; 2012:1-42.
40. U.S. Department of Agriculture, Food and Nutrition Service. At-Risk Afterschool Meals. A Child and Adult Care Food Program Handbook. Washington D.C.2015.
41. Gordon RA, Kaestner R, Korenman S, Abner K. The Child and Adult Care Food Program: Who Is Served and Why? Social Service Review. 2011;85(3):359-400.
42. Wolozin R. Feeding Hungry Mouths: Getting Healthy Food to the Kids Whom Need It Most. UC Davis J Juv L & Pol'y. 2015;19:232.
43. Food Research and Action Center. Child and Adult Care Food Program:
Participation Trends 2014. Washington, DC: Food Research and Action
Center;2016.
44. Ritchie LD, Boyle M, Chandran K, et al. Participation in the child and adult care food program is associated with more nutritious foods and beverages in child care. Childhood obesity (Print). 2012;8(3):224-229.
45. Schwartz MB, Henderson KE, Grode G, et al. Comparing Current Practice to Recommendations for the Child and Adult Care Food Program. Childhood obesity
(Print). 2015;11(5):491-498.
46. Crepinsek MK, Burstein NR, Lee EB, Kennedy SD, WL H. Meals Offered by Tier 2 CACFP Family Child Care Providers - Effects of Lower Meal
Reimbursements. In: U.S. Department of Agriculture, Economic Research Service, eds: Food Assistance & Nutrtion Research Program; 2002.
47. Piernas C, Popkin BM. Trends in snacking among U.S. children. Health affairs
(Project Hope). 2010;29(3):398-404.
13
49. Larson N, Story M, Eisenberg ME, Neumark-Sztainer D. Secular Trends in Meal and Snack Patterns among Adolescents from 1999 to 2010. J Acad Nutr Diet.
2016;116(2):240-250.e242.
50. Wang D, van der Horst K, Jacquier E, Eldridge AL. Snacking Among US Children: Patterns Differ by Time of Day. J Nutr Educ Behav. 2016.
51. Hall J, Zeidman E, Crepinsek MK, Condon E. School Nutrition and Dietary
Assessment Study IV, Vol II: Sampling and Data Collection Methods. VA: U.S.
Department of Agriculture, Food and Nutrition Service, Office of Research and Analysis;2012.
52. U.S. Department of Agriculture, Food and Nutrition Service. Crediting Handbook for the Child and Adult Care Food Program. 2014.
53. Healthy Hunger-Free Kids Act of 2010, 42 U.S.C, §221(u)(A)(B)(i)(C)(I)(II).
54. Weicha J, Hall G, Gannett E, Roth B. National Afterschool Association Standards for Healthy Eating and Physical Activity. 2011; http://www.niost.org/Standards- and-Guidelines/national-afterschool-association-standards-for-healthy-eating-and-physical-activity-in-out-of-school-time-programs.
55. Peterson E. First lady announces two new commitments to healthy eating and physical activity afterschool. Afterschool Alliance 2016;
http://www.afterschoolalliance.org/afterschoolSnack/First-lady-announces-two-new-commitments-to-healthy-eating-and_02-26-2014.cfm. Accessed September 13, 2016.
56. U.S. Department of Agriculture Food and Nutrition Service. Nutrition Standards for CACFP Meals and Snacks. 2016; http://www.fns.usda.gov/cacfp/meals-and-snacks.
14
C
HAPTERII
A
FTERSCHOOLS
NACKS:
A
C
OMPARISONB
YC
HILDA
NDA
DULTC
AREF
OODP
ROGRAME
LIGIBILITYA
NDE
NROLLMENTS
TATUSA
NDA
DOPTEDS
NACKG
UIDELINES1
1
15
Abstract
Objective: The Child and Adult Care Food Program (CACFP) assist afterschool
programs (ASPs) in serving snacks to low-income children by easing budgetary
constraints and providing nutrition guidance. Limited information exists on the
nutritional quality of afterschool snacks served under CACFP guidance. The objective of
this study was to compare the content of snacks served in ASPs by CACFP
eligibility/enrollment status and snack standards/guidelines utilized.
Design: Mixed methods design. Participants completed phone interviews; providing
snack menus and nutrition policy information. Kruskal-Wallis tests were used to assess
the relationship between the average weekly servings of food/beverage categories and
ASPs grouped by their (1) CACFP eligibility/enrollment status and (2) snack
standards/guidelines utilized.
Setting: ASPs operating in South Carolina.
Subjects: Thirty-five administrators, representing 60 ASPs.
Results: Non-eligible and eligible/non-enrolled ASPs served more fresh vegetables than
CACFP-enrolled ASPs (median servings = 1 day/week vs. 0 days/week, p < 0.001).
Non-eligible ASPs served more fresh fruits/vegetables than enrolled ASPs (median
servings = 3 days/week vs. 1 day/week, p < 0.05). Enrolled ASPs served more sugary
snacks than eligible/non-enrolled ASPs (median servings = 2 days/week vs.
0.5days/week, p< 0.001). ASPs exclusively following CACFP guidelines served fewer
fresh fruits and vegetables and more sugary snacks than did ASPs following other
16
Conclusions: ASPs enrolled in CACFP and adhering exclusively to their guidelines
served higher quantities of sugar-based snacks and fewer fresh fruits and vegetables than
their peers. It is recommended that CACFP ASPs adopt additional standards and
recommended best practices to enhance the nutrient content of snacks.
Keywords: food assistance, child care, nutrition, afterschool snacks
Introduction
Children across the United States consume large quantities of energy-dense and
nutrient-poor foods and beverages, such as cookies, chips, and soft drinks.1 As such diets
have been linked to increased risk for obesity, the public is urged to eat more healthfully.2
Improving dietary habits can be difficult for children living in low-income communities,
where the availability of energy-dense foods often exceeds nutrient-rich options.3,4
Federal nutrition assistance programs, created by the United States Department of
Agriculture (USDA), aim to assist low-income households in improving nutritional
status.5,6 Since their inception in the early 1930’s, nutrition assistance programs have
expanded to include meals served at schools, day cares, and outside-school-hours centers
through the National School Lunch Program (NSLP) and the Child and Adult Care Food
Program (CACFP).6
Afterschool programs (ASPs; typically operating from 3-6pm) are a vital resource
for low-income communities, as they provide a supervised environment, 7-10 offer
academic enrichment opportunities, 8-10 and, importantly, serve meals and/or snacks
everyday.8-10 Nearly half of the 10.2 million children enrolled in ASPs qualify for the
17
population led to the expansion of CACFP to include afterschool snacks.6,11-13 To be
eligible, ASPs must either meet the 25 percent threshold criteria (i.e., at least 25% of the
children enrolled are eligible for the NSLP) or be considered area-eligible (i.e., program
is located in attendance area of a public school where at least 50 percent of students are
eligible for NSLP).14 Qualifying programs offset cost by receiving reimbursement (i.e.,
84 cents per snack) for snacks served that meet guidelines set forth by CACFP.15
CACFP guidelines are intended to improve the quality and healthfulness of
snacks served to children attending CACFP-enrolled ASPs by providing broad,
component-based nutrition standards and encouraging participating ASPs to incorporate
fruits, vegetables, and whole grains in their snack menu.16 In addition to CACFP, other
national and state-level organizations have proposed their own guidelines to address the
quality of snacks served in ASPs.17-19 Unfortunately, the cost associated with serving
healthful snacks is often cited as a major barrier to meeting these nutrition benchmarks.
20-22
If this premise is true, it stands to reason that ASPs enrolled in CACFP (i.e., receiving
financial assistance) should serve more nutritious snacks than ASPs that are eligible but
not enrolled. Likewise, the snacks served in CACFP-enrolled ASPs should be
comparable to those served in ASPs who are not eligible for CACFP. Paradoxically,
evidence suggest that meals and snacks purchased in accordance with nutrition assistance
program guidelines are primarily energy-dense foods characterized as high in added
sugars and fats.3,23,24 As a result, there are growing concerns that enrollment in nutrition
assistance programs may, in fact, be contributing to the high rates of obesity; particularly
18
These studies, albeit important, primarily focus on foods and beverages obtained
through the Supplemental Nutrition Assistance Program and the National School
Breakfast and Lunch Programs. Studies examining the nutritional quality of foods and
beverages served through CACFP are limited to full-day child care centers. To date, the
nutritional quality of afterschool snacks served under CACFP guidance and how they
compare to non-eligible or eligible non-participating ASPs is unknown. Therefore, the
purpose of this study was to compare the content of snacks across a sample of ASPs
grouped by their (1) CACFP eligibility and enrollment status and (2) snack guidelines
utilized. Given the aforementioned concerns of the healthfulness of CACFP approved
foods and beverages; we hypothesized that the content of snacks served would be
comparable across ASPs, regardless of CACFP eligibility/enrollment status.
Methods
Site Sampling Strategy
A stratified purposeful sampling method was used to select ASPs for this study,
which stratified potential ASPs based on eligibility and enrollment in CACFP. This
allowed for comparison between three CACFP eligibility and enrollment groups: (1)
enrolled (i.e., ASPs currently enrolled in CACFP), (2) eligible/non-enrolled (i.e., ASPs
eligible for CACFP but not enrolled), and (3) non-eligible (i.e., ASPs not eligible for
CACFP). For programs not currently enrolled in CACFP, eligibility status was
determined in accordance with the CACFP At-Risk Afterschool Handbook guidelines.14
Free and reduced price meal eligibility data, located on the South Carolina Department of
Education website, were reviewed to confirm if a program was considered ‘area
eligible’.27
19
determine sample size necessary to detect statistically significant effects. Being mindful
of the feasibility in recruiting participants and conducting procedures within the study
timeframe, a total sample size of 60 ASPs (20 ASPs per CACFP eligibility/enrollment
group) was chosen; allowing for the detection of large effects (power = 0.80, f=.5).
ASP Site Leader Participants
ASP providers across the state of South Carolina were recruited to participate in
the study from the fall of 2014 to summer 2015. Program contact information was
obtained using documentation provided by the South Carolina Afterschool Alliance, the
Department of Social Services Child Care Department and through meetings held by the
South Carolina Department of Social Services CACFP. ASP site leaders, contacted by
phone and/or email, were provided with an overview of study objectives and procedures.
All site leaders interested in participating where asked questions to determine eligibility.
To qualify for study inclusion site leaders had to: (1) have knowledge of snack
procurement procedures, (2) be able to provide a sample snack menu (i.e. via snack recall
and/or electronic copy), and (3) agree to participate in a phone interview.
Participant Interviews
Upon obtaining verbal consent, a trained researcher conducted a phone interview
(lasting approximately 20 minutes) with program leaders to gather snack information.
The semi-structured interview guide consisted of four sections: (1) program
demographics, (2) snack policy and procedures, (3) snack recall, and (4) nutrition
assistance program experience.
Program Demographics: Participants were asked to provide demographic
20
age of children served, program setting (community center, school, church, private
building), and program tax status (non-profit, government, faith-based, for-profit).
Additionally, each participant was asked about their ASPs current involvement with any
program providing nutritional guidance, such as licensing and accreditation programs,
community based initiatives, school sponsored programs, and/or federally funded
nutrition assistance programs.
Snack Policy and Procedures: Participants provided details on any snack specific
policies and procedures followed by their ASPs. Specific to the procurement and
distribution of snack, participants were asked questions regarding purchase location,
budget, the number of snack occasions per day, and the number of food and beverage
options per snack. Participants reporting the use of nutrition guidelines in their ASPs
were asked to provide the name of the issuing organization and any snack specific
guidelines.
Snack Survey: The snack survey portion of the interview guide was developed
using previously validated tools for estimating the frequency and quantity of food and
beverages consumed 28-30 and modified for the ASP setting. Specific to this study, using
the food frequency questionnaire as a guide, the interviewer asked participants to provide
the average number of days per week that specific categories of foods and beverages
were served (10 broad food and beverage categories described in further detail below).
To address concerns associated with reporter bias and the potential to over and/or under
report, the interviewer also conducted a 1 week snack recall. Snack recalls were used to
generate a sample snack menu. The participants were first asked to recall what was
21
researchers asked clarifying questions to obtain detailed snack information, such as
brands, snack components, and serving sizes. When available, participants were asked to
submit an electronic copy of their snack menu.
Nutrition Assistance Program Experience:The final portion of the interview was
used for a qualitative assessment of ASP leaders’ knowledge, perception, and experiences
surrounding nutrition assistance programs. Detailed methodology and findings from this
study are reported elsewhere.31
Classification of Food and Beverage Items
Using existing afterschool snack policies and categorization methods as a guide,
17,18,32,33
the following categories were used for the classification of food and beverage
items: fresh fruit; fresh vegetables; whole grain snacks; salty snacks, such as chips and
crackers; sugar-based snacks, such as cookies and fruit gummies; sugar-sweetened
beverages, such as flavored milk and powdered drink mixes; 100% fruit juice; plain milk
(non-fat, 1%, 2%, and whole); and water. To account for the verbiage of some snack
policies subsuming fruits and vegetables into one guideline, a fresh fruit and/or vegetable
category was created. For the purposes of this study, whole grain snacks were classified
in two ways. First, participants self-reported snacks as whole grain for the food
frequency questionnaire. Secondly, product ingredient labels of each food item listed in
the sample snack menus was reviewed. Food items with “whole grain” listed as the
primary ingredient by weight were classified as a whole grain snack. The categories for
grain-based foods were not mutually exclusive (i.e. 1 snack food item could be classified
22
Statistical Analysis
Descriptive analyses were conducted at the ASP level. Agreement between the
self-reported average weekly servings of the food and beverage categories and those
derived from menu analyses was assessed. First, sample snack menus [i.e. obtained from
either the snack recall (n=11) or an electronic copy (n=49)] were reviewed and each food
and beverage item was placed into the predetermined categories. The average number of
days each category of foods and beverages was served was calculated and standardized to
represent a 5-day school week (i.e., some ASPs operated less than 5 days/week).
Wilcoxon signed rank tests were used to compare each ASPs self-reported weekly
average servings to those calculated from the sample menu data. Additionally, each food
and beverage item reported in the sample menu was examined and assigned a CACFP
creditability code (0, 1) (i.e., 1 = foods and beverages in adherence with CACFP
guidelines). The average number of food and beverage items offered per snack and the
percentage of snack components adhering to CACFP guidelines ([number of CACFP
credible snack items/ total snack items offered] x 100) was calculated for each CACFP
eligibility/enrollment status group.
An assessment of the distributions of all outcome variables (i.e., average weekly
servings of each food and beverage category) revealed non-normality, warranting the
need for a non-parametric procedure. The Kruskal-Wallis test, corrected for tied ranks,
was used to evaluate differences in the outcome variables across the different CACFP
eligibility/enrollment status groups and across the different snack guideline groups. For
variables with a significant Kruskal-Wallis test, the Bonferroni adjusted Dunn’s test for
23
different from each other. All analyses were performed using STATA (v.14.0, 2015,
StataCorp LP, College Station, TX). Effect sizes were calculated using eta-squared (η2).
Analysis groups (i.e., CACFP eligibility/enrollment groups and/or snack guideline
groups) with no reported servings in a given food or beverage category (e.g., ASPs not
eligible for CACFP never served sugar sweetened beverages) were excluded from the
associated analysis. The appropriate analysis was conducted on the remaining groups
(i.e., Kolmogorov-Smirnov test for 2 groups and the Kruskal-Wallis for 3+ groups). The
Kolmogorov-Smirnov test was chosen for the 2 group comparison (i.e., comparison of
the servings of sugar sweetened beverages between CACFP-enrolled ASPs and CACFP-
eligible/not enrolled ASPs) because of the non-normality and heterogeneity of variances
of the two groups.
Results
Sample Characteristics
A total of 40 interviews were conducted with ASP administrators, representing 71
ASPs (i.e., range of ASPs overseen by a single interviewee = 1- 12). Data from 2
interviews were excluded because the ASPs served meals in lieu of snacks and 3
additional interviews were excluded because participants were not able to provide either a
1 week snack recall during the interview or an electronic copy of the sample snack menu;
resulting in a total of 35 interviews and a final analytic sample of 60 ASPs. Sample
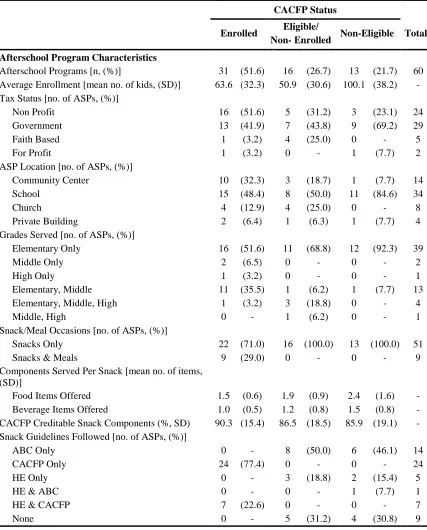
characteristics are presented in Table 2.1. Thirty one (51.6%) ASPs were enrolled at the
time of the study, 16 (26.7%) were eligible/enrolled, and 13 (21.7%) were
non-eligible. ASP administrators reported following three main snack guidelines; the CACFP
24
South Carolina Department of Social Services ABC Standards.18,33,34 Summaries of the
snack guidelines are presented in Table 2.2. While some programs reported following
one organization’s snack guidelines exclusively, others indicated following multiple
guidelines; resulting in a total of 6 groups. Out of the 60 ASPs, 24 (40.0%), 14 (23.3%),
and 5 (8.3%) exclusively followed CACFP, ABC, and Healthy Eating guidelines,
respectively. Of the remaining programs, 7 (11.7%) followed Healthy Eating and
CACFP, 1 (1.7%) followed Healthy Eating and ABC, and 9 (15.0%) did not follow any
guidelines (see Table 2.1).
Self-reported Versus Menu Derived Averages
Results of the Wilcoxon signed-ranks test indicated significant differences
between self-reported and menu derived average weekly servings of fresh fruits, fresh
fruits and/or vegetables, whole grain, sugary snacks, and milk. Participants self-reported
serving higher weekly servings of fresh fruits, Z = 2.6, p<.05; fresh fruits and/or
vegetables, Z = 2.4, p<.05; whole grain snacks, Z = 2.4, p<.05; and plain milk, Z = 2.1,
p<.05 compared to menu derived estimates. Participants self-reported fewer average
weekly servings of sugary snacks, Z = 2.8, p<.05 than derived from the ASP menu.
These findings support those of a recent review of child dietary assessment methods,
which found higher validity among food records and recall when compared to
self-reported food frequency.30 For this reason, only menu data were used for all subsequent
analyses.
Food and Beverages across CACFP Eligibility/Enrollment Groups
The average number of snack foods and beverages offered are provided in Table
25
and 1.5 different food items per snack per day. Eligible/non-enrolled ASPs served an
average of 1.9 different food items and 1.2 beverage item options per snack per day. A
typical snack served in non-eligible ASPs consisted of 2.4 different food item options and
1.5 different beverage options. The majority of snacks served, irrespective of CACFP
eligibility/enrollment grouping, met the CACFP reimbursement guidelines (range = 86%
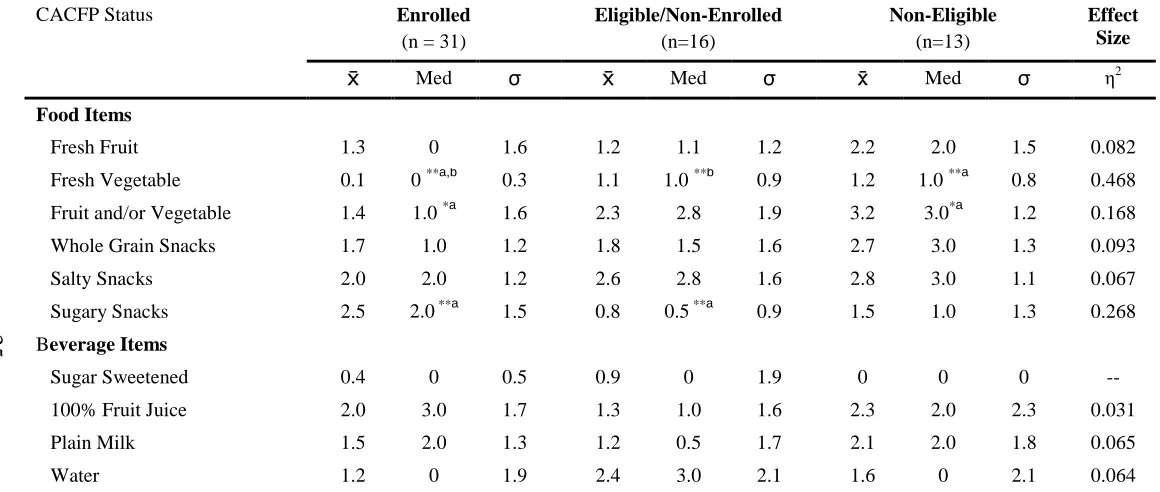
to 90%) (see Table 2.1). Table 2.3 shows the comparison of the servings of the food and
beverage categories across CACFP eligibility/enrollment status groups. The most
commonly served snacks in enrolled ASPs were sugar-based (e.g., graham crackers and
pastries; mean serving = 2.5 days/week) and salty foods (e.g., chips and cheese flavored
crackers; mean serving = 2.0 days/week) and 100% fruit juice (mean serving = 2.0
days/week). Those ASPs who were eligible/non-enrolled frequently served salty snacks
(e.g., plain and cheese flavored crackers; mean serving = 2.6 days/week), fruits and/or
vegetables (mean serving = 2.3 days/week), and water (mean serving = 2.4 days/week).
The most commonly served snacks in ASPs who were non-eligible were fruits and/or
vegetables (mean serving = 3.2 days/week), salty (e.g., popcorn and cheese flavored
crackers; mean serving = 2.8 days/week), whole grain snacks (e.g.., cereal and crackers;
mean serving = 2.7 days/week), 100% fruit juice (mean serving = 2.3 days/week) and
plain milk (mean serving = 2.1 days/week).
Results of the Kruskal-Wallis test were statistically significant for 3 variables: the
average weekly servings of fresh vegetables, fresh fruit and/or vegetables, and sugary
snacks. Effect sizes for the global test are provided in Table 2.3. Pairwise comparisons
showed that the weekly servings of fresh vegetables were significantly higher among
26
p < 0.001). ASPs who were eligible/non-enrolled also served significantly higher
amounts of fresh vegetables than that of enrolled ASPs (median serving = 1.0 day/week
vs. 0 days/week, p < 0.001). Non-eligible programs served significantly more servings of
items from the combined fruit and/or vegetable category than enrolled ASPs (median
serving = 3.0 days/week vs. 1.0 day/week, p < 0.05). Lastly, significant differences were
found between CACFP eligibility/enrollments status groups in the servings of sugary
snacks. Enrolled ASPs served significantly higher amounts of sugary snacks than those
ASPs who were eligible/non-enrolled (median serving = 2.0 days/week vs. 0.5
days/week, p < 0.001). Results of the Kolmogorov-Smirnov test showed no significant
differences in the servings of sugar sweetened beverages between the enrolled ASPs and
those who were eligible/non-enrolled (D = 0.2, p=0.85).
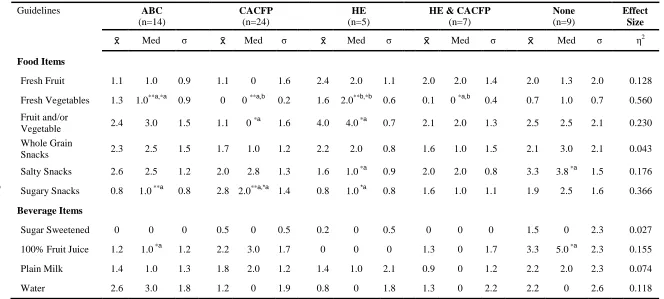
Food and Beverages across Snack Guideline Groups
There were a total of 5 snack guideline groups included in the analysis: South
Carolina Department of Social Services ABC Standards; CACFP Meal Patterns; National
Afterschool Association’s Healthy Eating Standards; a combination of National
Afterschool Association’s Healthy Eating Standards and CACFP Meal Patterns; and no
guidelines. The combined group, Healthy Eating and ABC Standards, was not included
in the final analyses due to its low sample size (n=1). Results of the Kruskal-Wallis test
indicated significant differences in the servings of multiple food and beverage categories
according to the snack guidelines followed (see Table 2.4). Global effect sizes are
provided in the table. Pairwise comparisons showed that ASPs who followed ABC
guidelines served significantly more fresh vegetables than did programs following
27
0.001). ASPs following ABC guidelines also served significantly higher amounts of
fresh vegetables than did ASPs following Healthy Eating & CACFP guidelines (median
serving = 1.0 day/week vs. 0 days/week, p < 0.05). Similarly, ASPs following Healthy
Eating guidelines exclusively served significantly higher amounts of fresh vegetables
than did ASPs following CACFP guidelines exclusively (median serving = 2.0 days/week
vs. 0 days/week, p < 0.001) or those following Healthy Eating & CACFP (median
serving = 2.0 days/week vs. 0 days/week, p < 0.05). For the combined category of fresh
fruits and/or vegetables, significant differences were found between ASPs following
CACFP and those following Healthy Eating guidelines, with the latter serving higher
amounts (median serving = 0 days/week vs. 4.0 days/week, p < 0.05). The servings of
salty snacks differed significantly between 2 groups, with ASPs not following any
guidelines serving higher amounts than those ASPs following Healthy Eating guidelines
exclusively (median serving = 3.8 days/week vs. 1.0 day/week, p < 0.05). ASPs
following CACFP guidelines exclusively, served significantly higher amounts of sugary
snacks than ASPs following ABC (median serving = 2.0 days/week vs. 1.0 day/week, p <
0.001) or those following Healthy Eating guidelines exclusively (median serving = 2.0
days/week vs. 1.0 day/week, p < 0.05). Significant differences were found in the
servings of 100% fruit juice. ASPs not following any snack guidelines served higher
amounts than those ASPs following ABC guidelines (median serving = 5.0 days/week vs.
1.0 day/week, p < 0.05). No other statistically significant differences were found in the
28
Discussion
ASPs are being tasked with the responsibility of promoting healthy lifestyles
through serving foods and beverages that adhere to national nutrition guidelines.35 Many
ASPs serving low-income communities rely on the financial assistance provided through
programs like the CACFP to meet these demands.8,9 To our knowledge, this is the first
study to assess how the foods and beverages served as snacks in ASPs under CACFP
guidance compare to snacks served in ASPs eligible for CACFP but not currently
enrolled and to ASPs not eligible.
Our findings, consistent with previous studies on the quality of foods and
beverages served in full-day CACFP centers, revealed that enrollment and adherence to
CACFP guidelines does not result in healthier meals and snacks.36-38 Overall, enrolled
ASPs served low-nutrient-dense sugar-based snacks more frequently than their peer ASPs
who were eligible/non-enrolled (i.e., 1.5 more days/week). Additionally, enrolled ASPs
served fewer fresh fruits and vegetables than either non-eligible or eligible/non-enrolled
ASPs (i.e., 1-2 days fewer/week). When comparing snack content across specific snack
guideline groups, those programs exclusively adhering to CACFP guidelines served more
sugar-based snacks and less fresh fruits and vegetables than programs adhering to other
guidelines. This highlights concerns over the leniency of CACFP guidelines, especially
given that over 85 percent of the snacks served across all ASPs were deemed creditable
and nutritious under current CACFP guidelines.
These findings are timely, as new CACFP meal and snack guidelines have
recently been released. The new guidelines, informed by science-based
29
beverages.39 Regulations on the sugar content of reimbursable foods are among the most
promising changes in the new guidelines. Programs participating in CACFP may no
longer receive reimbursement for grain-based desserts, such as cookies, granola bars, and
pastries.39,40 This, coupled with new limits on sugar content of yogurt and cereal, has the
potential to reduce the amount of low-nutrient-dense sugar-based foods currently being
served among CACFP ASPs. Conversely, the new guidelines do not fully address issues
uncovered in the present analyses; namely, the high prevalence of salty snacks and the
lack of fresh fruits and vegetables observed in CACFP-enrolled ASPs. Under the new
guidelines, all grains served for afterschool snack must be whole grain-rich; defined as
foods containing a minimum of half whole grains and half enriched grains.39 Though this
definition is widely used to classify whole grain foods as healthful, it does not take into
account nutrient content that should be limited, such as sodium. 41 Previous studies
indicate that CACFP meals and snacks consistently exceed recommendations for sodium
content set forth by the USDA’s Dietary Guidelinesfor Americans and the Institute of
Medicine.37,38 While the new guidelines represent a positive shift toward whole-grain
snacks, in the absence of limits on sodium content, it is plausible that CACFP approved
snacks may continue to exceed sodium recommendations. Further, the new guidelines
for fruits and vegetables are still fairly permissive, with 100% juice remaining as a
creditable substitution for a fruit or vegetable component. Optional best practices
recommend that at least 1 of the 2 snack components consist of a fruit or vegetable;
however there are no mandates requiring ASPs to serve a fresh fruit or vegetable for
snack. It is uncertain if the new guidelines will have any significant impact on the
30
There are numerous strengths to this study. First, this study adds to the body of
literature surrounding nutrition assistance programs and to our knowledge, is the first to
provide empirical evidence regarding the type of snacks served in ASPs who follow
CACFP guidelines. Moreover, previous studies compared CACFP meals and snacks to
nutrient-based guidelines outlined in the Dietary Guidelines for Americans, in which the
macronutrient and micronutrient content is compared to Dietary Reference Intake values
specific to meal occasions (i.e. breakfast, lunch, dinner). Currently, no snack specific
Dietary Reference Intake values exist, making it difficult to accurately compare the
nutrient content of snacks to existing nutrient-based guidelines. This study evaluated the
content of afterschool snacks in a manner consistent with CACFP guidelines; using broad
component based categories. Additionally, this study contained a representative sample
of ASPs who reflect the diverse organizational structures and settings within the
afterschool community.
Several limitations of the current study need to be considered. First, the use of
self-report measures of snack content introduces the possibility of response bias (i.e.,
inaccuracies in snack recall resulting in over/under-reporting of foods and beverages
served). We attempted to minimize this bias and enhance the validity of findings through
method triangulation, where multiple data sources were used to collect snack information
(i.e., food frequency questionnaire, snack recall, and electronic copies of snack menu).
While this method is consistent with existing research evaluating the foods and beverages
served within nutrition assistance programs, 36,37,42-44 future studies should consider the
use of objective measures of snack content to validate self-reported menu data. Further,
31
beverages is unknown. However, we do not feel that this impacts the inferences made in
this study since consumption has no bearing on snack reimbursement eligibility. An
additional limitation was the inability to compare the cost of snacks between the three
CACFP eligibility and enrollment status groups. Participants were asked to provide
information on snack expenditures and reimbursement rates; however, inconsistencies in
reporting (e.g., inability to derive snack cost when snacks were provided by a sponsor
organization or purchased in conjunction with meals) resulted in a loss of viable cost data
necessary to make comparisons. With cost often cited as a primary barrier to serving
snacks that meet nutrition guidelines, 19,21,45 it is important to assess the relationship
between the cost and healthfulness of CACFP approved foods and beverages. Studies
exploring the impact of community partnerships on snack cost demonstrated that ASPs
could serve a fresh fruit or vegetable daily while maintaining expenditures well below the
$0.84 allotted for CACFP approved snacks ($0.25 to $0.38 per snack).22,46,47 These
findings suggest that it is possible for CACFP-enrolled ASPs to incorporate more fresh
fruits and vegetables in snack while remaining on budget. Studies are needed to identify
effective strategies to assist CACFP-enrolled ASPs in facilitating sustainable changes.
Lastly, unbalanced sample sizes among the analysis groups can affect the homogeneity of
variances and impact type I error rates, thus, weakening statistical inferences. To address
this concern, we ran Monte Carlo simulations using our data (i.e., test runs an ordinary
ANOVA and 5 000 simulated F test with given pattern of sample sizes and standard
deviations and provides a simulated p-value).48 Simulated p-values were consistent with
those from our analyses, suggesting that the heterogeneity of variances did not impact the
32
guideline group was not included in the analysis due to its single occurrence. While
comparison of snacks across guideline groups was not our primary outcome of interest,
significant results warrant further exploration. Future studies are needed to gain a greater
understanding of how the various snack guidelines available impact the foods and
beverages served in ASPs.
In conclusion, this study revealed that CACFP-enrolled ASPs are not serving
higher quality snacks than their fellow ASPs. Snacks largely consist of sugar-based and
salty foods and 100% juice, with few fresh fruits and vegetables served. These findings
have relevance for ASPs across the nation seeking assistance in serving healthier snacks.
ASPs should consider adopting multiple snack guidelines and best practices to enhance