A Framework for Selection of Membership
function using Fuzzy Rule Base System for the
Classification of Yeast Data
Shrayasi Datta1, J. Paulchoudhury2
Department of Information Technology, Jalpaiguri Government Engineering College, Jalpaiguri, West Bengal, India.
Department of Information Technology, Kalyani Government Engineering College, Kalyani, Nadia,
West Bengal, India.
ABSTRACT: Yeast data classification is an important bioinformatics task asyeast plays an important role in formation of medicine and various chemical components. If the type of yeast can be recognized at the primary stage based on the initial characteristics of it, a lot of technical procedure can be avoided in the preparation of chemical and medical products. In this paper, a fuzzy rule base system is presented with different membership function for the classification of yeast dataset .Here an effort has been made to decide the suitable membership function of fuzzy rule base system for the classification of yeast protein. The membership function which has been used is respectively, triangular, trapezoidal, bell shaped, sigmoidbased and Gaussians combination membership functions. Based on average error, the particular membership function can be decided using the fuzzy rule base system for classification of yeast protein into their respective subcellular location. The yeast dataset has been chosen from UCI machine learning repository which has been used for this purpose.
KEYWORDS: classification,fuzzy rulebase, yeast dataset, membership function, protein localization.
I. INTRODUCTION
A cell, which is called the building blocks of life, usually contains approximately 109 protein molecules[1]. These molecules reside in various compartments of a typical cell which are called “protein subcellular locations“. The information regarding the protein subcellular locations plays an important role in bioinformatics as this information helps researchers to know the function of a cell properly. Determining the subcellular localization of a protein by conducting chemical experiments is a laborious and time consuming task. But with the help of machine learning techniques [2] in computer science, with an increased dataset of proteins of known localization, fast and accurate localization predictions for many organisms have been done successfully. This is due to the nature of machine learning approaches, which performed well in domains where there is a vast collection of data but a little theory –which perfectly matches the scenario in bioinformatics [2].Among the various type of prokaryotic and eukaryotic cell, theinformation regarding the yeast always snatches the attention of the researcher because of the demand of yeast in medicine and food technology field and also because of the similarities of yeast cell structure with human cell.
k-nearest neighbor algorithm is better among these four, with an accuracy of about 86% on E Coli dataset and 60% on yeast dataset.
Chen Y.[7] has implemented twomachine learning algorithm for classification of E.coli and yeast cell: decision tree, artificial neural network, And it is concluded that three techniques has similar performance measure for this two dataset.
Bo Jin, Yuchun Tang, Yan-Qing Zhang, Chung-Dar Lu and Irene Weber [8], have proposed and designed SVM with fuzzy hybrid kernel based on TSK fuzzy model and have showed that fuzzy hybrid kernel has achieved better performance in SVM classification.
X.-B. Zhou,C. Chen, Z.-C. Li, and X.-Y. Zou[9],has proposed an novel predictive multi-classifier system ,for predicting the subcellular location of apoptosis protein, by combing a dual-layer support vector machine (SVM) with multiple compositions including amino acid compositions among them. They have achieved an excellent accuracy of 94.90% and 88.44% on two standard apoptosis protein dataset.Algorithm based on Fuzzy rule base technique is proposed in heart disease [9].
There are several research work for describing the classification task of yeast dataset[3],[8] using some widely used machine learning techniques like artificial neural network ,k-nearest neighbor algorithm, support vector machine techniques, as described above. But most of them concentrated on selecting the machine learning approach by which the classification has been done.Very little concentration has been made for differentaspects of one particular approach. Here comes to the purpose of selection of the present research work .Here, classification of yeast proteinbased on their subcellular location has been done with fuzzy rule base.The yeast dataset is obtained from UCI machine learning repository [10].Each input of the dataset corresponds to a protein whereas the output is the predicted subcellular location of that protein. Initially,8 attributes of a yeast protein from yeast dataset is taken as an input to the fuzzy rule base system. After that, fuzzy rule base has been applied on the input data values. In this context different membership function combination like sigmoid, trapezoidal, triangular, bell shaped etc., has been applied for each input and output variable. Based on the fuzzy value of the output variable, the class of the yeast protein is decided.Finally average error has been calculated using the output value produced by fuzzy rule base for each combination of membership function in comparison to the actual output value as available in the database.
The paper is organized as follows, Section 1 the importance of the research work and a brief literature review is furnished. In section 2,a brief description of the dataset is presented with a discussion on error analysis. Section 3 describes the implementation with result and error analysis,and Section 4 concludes the paper.
II. METHODOLOGY
A. DATASET DESCRIPTION:
In this research work, the yeast data set obtained from UCI machine learning repository has been used [10]. The dataset consists of 8 attributes,1 class-name .The attributes are mcg, gvh, alm, mit, erl, pox, vac, nuc. Each of the attributes has been used to classify the localization site of a protein which is a score (between 0 and 1) corresponding to a certain feature of the protein sequence. The higher the score is, the more possible the protein sequence has such feature. Proteins are classified into 10 classes, these are cytosolic or cytoskeletal (CYT), nuclear (NUC), mitochondrial (MIT), membrane protein without N-terminal signal (ME3), membrane protein with uncleaved signal (ME2), membrane protein with cleaved signal (ME1) , extracellular (EXC), vacuolar (VAC), peroxisomal (POX), endoplasmic reticulum lumen (ERL). there is no missing value for attributes and it containsatotal of 1484 number of instances.
B. ERROR ANALYSIS
---(vii)
Where, Pi is the output class value estimated for a given instance, Ti is the actual output class value for that instance.
Average Error is derived using eq. (viii):-
1
1
ni i
A
E
n
---(viii)III. IMPLEMENTATION AND RESULT
A. IMPLEMENTATION
Step 1
At first the first attribute (sequence name) is discarded, as this attribute is not necessary for the classification task.
Step 2
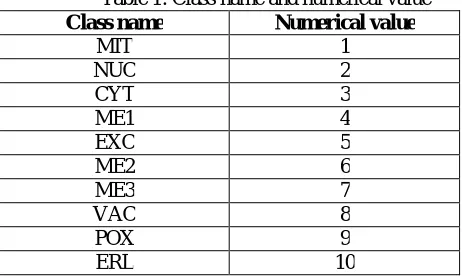
The output class names are of non-numeric type for example MIT, CYT, VAC etc. These are replaced by numeric value 1, 2, 3 etc. The class names with their replaced numeric values are listed in table 1.
Table 1: Class name and numerical value
Class name Numerical value
MIT 1
NUC 2
CYT 3
ME1 4
EXC 5
ME2 6
ME3 7
VAC 8
POX 9
ERL 10
Step 3
One Fuzzy Inference System(FIS) with 8 inputs and 1 output has been implemented using MATLAB 2013b. After removing the first attribute, the dataset contains 9 attributes. From which the first 8 attributes has been given as input values, and the last one as output value to the FIS.
Step 4
The range of the input and output variables are first retrieved from the dataset and then decomposed into 8 fuzzy set values.They are furnished in table 2. It is to note that there are 8 attributes .these are mcg, gvh, aln, mit, erl, vac, nuc and pox and the range of attribute 6(vac) is not given ,because it has only one value for all samples, i.e. 0.00.
Table 2: Range decomposition of attribute 1 to 8.
RANGE DECOMPOSITION OF ATTRIBUTE 1 (MCG) RANGE DECOMPOSITION OF ATTRIBUTE 2
(GVH)
Range Fuzzy set value Range Fuzzy set value
1 0.42 to 0.64 Low1 1 0.40 to 0.67 Low1
2 0.33 to 0.61 Low2 2 0.31 to 0.60 Low2
3 0.40 to 0.73 Low3 3 0.39 to 0.63 Low3
4 0.91 to 0.70 Medium1 4 0.66 to 0.88 Medium1
5 0.49 to 0.89 Medium2 5 0.39 to 0.87 Medium2
| i i|
i
i
P T
E
T
6 0.54 to 0.94 Medium3 6 0.42 to 0.75 Medium3
7 0.28 to 0.54 High1 7 0.24 to 0.58 High1
8 0.28 to 0.80 High2 8 0.32 to 0.82 High2
9 0.32 to 0.68 High3 9 0.27 to 0.68 High3
10 0.7 to 0.86 Very high 10 0.56 to 0.92 Very high
RANGE DECOMPOSITION OF ATTRIBUTE 3(ALN)
RANGE DECOMPOSITION OF ATTRIBUTE 4(MIT)
Range Fuzzy set value 1 Range Fuzzy set value
1 0.45 to 0.66 Low1 2 0.13 to 0.65 Low1
2 0.43 to 0.69 Low2 3 0.13 to 0.43 Low2
3 0.42 to 0.60 Low3 4 0.11 to 0.35 Low3
4 0.30 to 0.47 Medium1 5 0.23 to 0.78 Medium1
5 0.36 to 0.58 Medium2 6 0.23 to 0.37 Medium2
6 0.33 to 0.58 Medium3 7 0.4 to 0.49 Medium3
7 0.21 to 0.42 High1 8 0.12 to 0.31 High1
8 0.26 to 0.57 High2 9 0.08 to 0.28 High2
9 0.43 to 0.59 High3 10 0.10 to 0.49 High3
10 0.38 to 0.58 Very high 0.25 to 0.40 Very high
RANGE DECOMPOSITION OF ATTRIBUTE 5(ERL)
Range Fuzzy set value
1. 0.00 to 0.1 low
2. 1.00 to 1.11 high
: RANGE DECOMPOSITION OF ATTRIBUTE 8(POX)
RANGE DECOMPOSITION OF ATTRIBUTE 7(NUC)
Range Fuzzy set value Range Fuzzy set value
1 0.46 to 0.53 Low1 1 0.22 only Low1
2 0.47 to 0.68 Low2 2 0.22 to 0.34 Low2
3 0.49 to 0.58 Low3 3 0.22 to 0.40 Low3
4 0.43 to 0.58 Medium1 4 0.22 to 0.63 Medium1
5 0.39 to 0.56 Medium2 5 0.22 only Medium2
6 0.40 to 0.59 Medium3 6 0.22 to 0.35 Medium3
7 0.43 to 0.55 High1 7 0.22 to 0.66 High1
8 0.39 to 0.60 High2 8 0.22 to 0.40 High2
9 0.40 to 0.54 High3 9 0.22 to 0.41 High3
10 0.53 to 0.58 Very high 10 0.53 to 0.58 Very high
Step 5
Based on the input and output data, a rule base has been created which has been furnished in table 3.
Table 3:Rule base
Rule no.
Rules
1. If (att1 is low1) and (att2 is low1) and (att3 is low1) and (att4 is low1) and (att5 is a5) and (att6 is a6) and (att7 is low1) and (att8 is lowc1) then (output1 is class1) (1)
2. If (att1 is low2) and (att2 is low2) and (att3 is low2) and (att4 is low2) and (att5 is a5) and (att6 is a6) and (att7 is low2) and (att8 is low2) then (output1 is class2) (1)
4 If (att1 is medium1) and (att2 is medium1) and (att3 is medium1) and (att4 is medium1) and (att5 is a5) and (att6 is a6) and (att7 is medium1) and (att8 is medium1) then (output1 is class4) (1)
5 If (att1 is medium2) and (att2 is medium2) and (att3 is medium2) and (att4 is medium2) and (att5 is a5) and (att6 is a6) and (att7 is medium2) and (att8 is lowc1) then (output1 is class5) (1)
6 If (att1 is medium3) and (att2 is medium3) and (att3 is medium3) and (att4 is medium3) and (att5 is a5) and (att6 is a6) and (att7 is medium3) and (att8 is medium3) then (output1 is class6) (1)
7 If (att1 is high1) and (att2 is high1) and (att3 is high1) and (att4 is high1) and (att5 is a5) and (att6 is a6) and (att7 is high1) and (att8 is high1) then (output1 is class7) (1)
8 If (att1 is high2) and (att2 is high2) and (att3 is high2) and (att4 is high2) and (att5 is a5) and (att6 is a6) and (att7 is high2) and (att8 is high2) then (output1 is class8) (1)
9 If (att1 is high3) and (att2 is high3) and (att3 is high3) and (att4 is high3) and (att5 is a5) and (att6 is a6) and (att7 is high3) and (att8 is high3) then (output1 is class9) (1)
10 If (att1 is very_high) and (att2 is very_high) and (att3 is very_high) and (att4 is very_high) and (att5 is a5c10) and (att6 is a6) and (att7 is very_high) and (att8 is very_high) then (output1 is class10) (1)
Step 6
Now membership function has been applied to all input variables and output variable. Here, four combination of membership function for input and output variables has been applied. The combination has been listed in Table no 4. From table 4, it is to note that when the input membership function is listed asGaussian 2, means for all input 8 attributes, Gaussian 2 membership function has been used for each rule. Similarly, this applies for other membership function combination also.
Table 4:input-output membership function combination
Sl. No. Membership function for
Input variable
Membership function for
Output variable
1 Gaussian2 Gaussian2 2 Gaussian2 Triangular 3 Trapezoidal Trapezoidal 4 Trapezoidal Triangular 5. Bell shaped Bell shaped
6. Sigmoid Sigmoid
7. PI shaped Pi shaped
Step 7
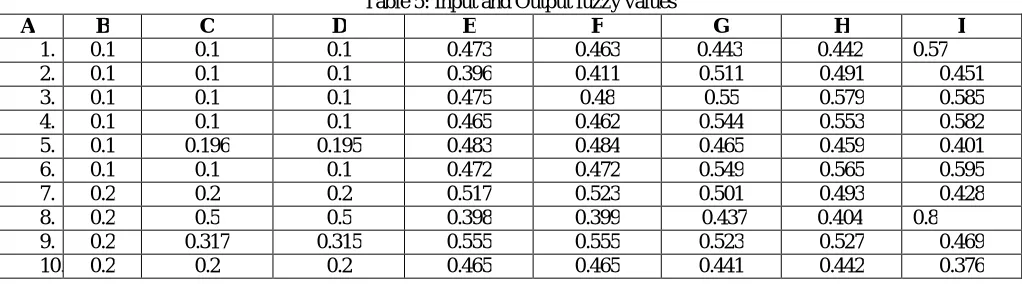
Based on the combination of membership functions, as listed in table 4, and, using fuzzy rule base, as furnished in Table 3,estimated output has been calculated for50 selected data items from yeast dataset. The output has been furnished in table 5.
Table 5: Input and Output fuzzy values
A B C D E F G H I
1. 0.1 0.1 0.1 0.473 0.463 0.443 0.442 0.57
2. 0.1 0.1 0.1 0.396 0.411 0.511 0.491 0.451
3. 0.1 0.1 0.1 0.475 0.48 0.55 0.579 0.585
4. 0.1 0.1 0.1 0.465 0.462 0.544 0.553 0.582
5. 0.1 0.196 0.195 0.483 0.484 0.465 0.459 0.401
6. 0.1 0.1 0.1 0.472 0.472 0.549 0.565 0.595
7. 0.2 0.2 0.2 0.517 0.523 0.501 0.493 0.428
8. 0.2 0.5 0.5 0.398 0.399 0.437 0.404 0.8
9. 0.2 0.317 0.315 0.555 0.555 0.523 0.527 0.469
11. 0.2 0.462 0.461 0.524 0.526 0.469 0.517 0.466
12. 0.2 0.345 0.347 0.59 0.489 0.471 0.484 0.375
13. 0.2 0.622 0.628 0.59 0.569 0.491 0.574 0.654
14. 0.2 0.3 0.3 0.59 0.561 0.5 0.486 0.508
15. 0.3 0.341 0.34 0.451 0.449 0.497 0.497 0.515
16. 0.3 0.2 0.2 0.453 0.448 0.511 0.503 0.631
17. 0.3 0.333 0.333 0.447 0.446 0.503 0.503 0.521
18. 0.3 0.3 0.3 0.548 0.547 0.535 0.562 0.57
19. 0.3 0.34 0.342 0.541 0.543 0.535 0.567 0.547
20. 0.3 0.346 0.345 0.463 0.445 0.494 0.493 0.499
21. 0.3 0.2 0.2 0.463 0.552 .456 .443 0.395
22. 0.3 0.391 0.39 0.463 0.552 .419 0.411 0.435
23. 0.4 0.4 0.4 0.54 0.538 .545 .464 0.566
24. 0.4 0.4 0.4 0.54 0.489 0.507 0.29 0.4
25. 0.4 0.4 0.4 0.54 0.552 0.448 0.372 0.4
26. 0.5 0.5 0.5 0.52 0.526 0.516 0.562 0.533
27. 0.5 0.5 0.5 0.604 0.602 0.532 0.195 0.5
28. 0.5 0.5 0.5 0.604 0.602 0.532 0.195 0.5
29. 0.6 0.6 0.6 0.612 0.612 0.607 0.621 0.65
30. 0.6 0.559 0.559 0.484 0.482 0.556 0.487 0.653
31. 0.6 0.457 0.455 0.505 0.499 0.44 0.395 0.357
32. 0.7 0.2 0.2 0.708 0.711 0.628 0.455 0.458
33. 0.7 0.2 0.2 0.663 0.661 0.624 0.449 0.453
34. 0.7 0.2 0.2 0.662 0.66 0.62 0.449 0.453
35. 0.7 0.2 0.2 0.662 0.66 0.62 0.449 0.453
36. 0.7 0.2 0.2 0.637 0.631 0.588 0.451 0.45
37. 0.7 0.5 0.5 0.745 0.747 0.688 0.542 0.608
38. 0.7 0.7 0.7 0.698 0.703 0.686 0.533 0.531
39. 0.7 0.3 0.3 0.504 0.498 0.414 0.415 0.385
40. 0.7 0.5 0.5 0.748 0.749 0.672 0.5 0.53
41. 0.8 0.5 0.5 0.61 0.604 0.537 0.434 0.49
42. 0.8 0.561 0.565 0.551 0.551 0.503 0.507 0.523
43. 0.8 0.5 0.5 0.523 0.518 0.5 0.346 0.323
44. 0.8 0.5 0.5 0.562 0.557 0.456 0.416 0.373
45. 0.9 0.5 0.5 0.5 0.5 0.5 0.5 0.5
46. 0.9 0.5 0.5 0.0.5 0.5 0.5 0.5 0.5
47. 0.9 0.5 0.5 0.5 0.5 0.5 0.5 0.5
48. 1.0 0.5 0.5 0.5 0.5 0.963 0.97 0.975
49. 1.0 0.5 0.5 0.5 0.5 0.963 0.97 0.975
50. 1.0 0.5 0.5 0.5 0.5 0.963 0.97 0.975
Step 8
Based on the actual output (available in the dataset) and estimated output(as calculated), estimated error has been calculated for all input-output membership functions and has been furnished in Table 6.
Table 6:Estimated error for input-output membership function combination
A J K L M N O P
1. 0.0 0.0 3.73 3.63 3.42 3.43 4.7
2. 0.0 0.0 2.96 3.10 3.91 4.11 3.51
4. 0.0 0.0 3.65 3.61 4.53 4.44 4.82
5. 0.96 0.95 3.83 3.84 3.59 3.65 3.01
6. 0.0 0.0 3.71 3.71 4.65 4.49 4.95
7. 0.0 0.0 1.585 1.615 1.465 1.505 1.14
8. 1.499 1.49 0.99 0.995 1.02 1.185 3
9. 0.585 0.575 1.775 1.775 1.635 1.615 1.345
10. 0.0 0.0 1.325 1.325 1.21 1.205 0.88
11. 1.31 1.306 1.61 1.63 1.585 1.345 1.33
12. 0.72 0.73 1.949 1.44 1.42 1.355 0.875
13. 2.11 2.13 1.949 1.84 1.87 1.455 2.27
14. 0.499 0.49 1.949 1.805 1.43 1.5 1.54
15. 0.136 0.133 0.50 0.49 0.656666667 0.656666667 0.716666667
16. 0.333 0.333 0.51 0.49 0.676666667 0.703333333 1.103333333
17. 0.11 0.11 0.49 0.48 0.676666667 0.676666667 0.736666667
18. 0.0 0.14 0.82 0.82 0.873333333 0.783333333 0.9
19. 0.133 0.0 0.80 0.81 0.89 0.783333333 0.823333333
20. 0.15 0.149 0.54 0.48 0.643333333 0.646666667 0.663333333
21. 0.333 0.333 0.54 0.84 0.476666667 0.52 0.316666667
22. 0.30 0.30 0.54 0.84 0.37 0.396666667 0.45
23. 0.0 0.0 0.35 0.345 0.16 0.3625 0.415
24. 0.0 0.0 0.35 0.222 0.275 0.2675 0
25. 0.0 0.0 0.35 0.38 0.07 0.12 0
26. 0.0 0.0 0.0.4 0.052 0.124 0.032 0.066
27. 0.0 0.0 0.207 0.203 0.61 0.064 0
28. 0.0 0.0 0.207 0.203 0.61 0.064 0
29. 0.0 0.0 0.02 0.02 0.035 0.011666667 0.083333333
30. 0.068 0.06 0.19 0.19 0.188333333 0.073333333 0.088333333
31. 0.23 0.24 0.15 0.16 0.341666667 0.266666667 0.405
32. 00.71 00.71 0.011 0.01 0.35 0.102857143 0.345714286
33. 00.71 00.71 0.05 0.055 0.358571429 0.108571429 0.352857143
34. 00.71 00.71 0.054 0.0571 0.358571429 0.114285714 0.352857143
35. 00.71 00.71 0.054 0.0571 0.358571429 0.114285714 0.352857143
36. 00.71 00.71 0.08 0.0985 0.355714286 0.16 0.357142857
37. 00.28 00.28 0.06 0.0671 0.225714286 0.017142857 0.131428571
38. 0.0 0.0 0.00 0.004 0.238571429 0.02 0.241428571
39. 0.571 0.571 0.27 0.2885 0.407142857 0.408571429 0.45
40. 00.28 00.28 0.06 0.070 0.285714286 0.04 0.242857143
41. 0.375 0.375 0.23 0.245 0.4575 0.32875 0.3875
42. 0.298 0.293 0.3112 0.311 0.36625 0.37125 0.34625
43. 0.375 0.375 0.346 0.3525 0.5675 0.375 0.59625
44. 0.375 0.375 0.2975 0.3037 0.48 0.43 0.53375
45. 0.44 0.44 0.44 0.44 0.444444444 0.444444444 0.444444444
46. 0.44 0.44 0.44 0.44 0.444444444 0.444444444 0.444444444
47. 0.44 0.44 0.44 0.44 0.444444444 0.444444444 0.444444444
48. 0.5 0.5 0.5 0.5 0.03 0.037 0.025
49. 0.5 0.5 0.5 0.5 0.03 0.037 0.025
50. 0.5 0.5 0.5 0.5 0.03 0.037 0.025
input-membership function,E= Estimated output for Gaussian2- Gaussian2 combination for input-output input-membership function,F= Estimated output for Gaussian2-Triangular combination for input-output membership function,G= Estimated output for bell shaped combination for input-output membership function,H= Estimated output for sigmoid combination for input-output membership function,I= Estimated output for pi-shaped combination for input-output membership function.
A=Index no., J=Estimated error for Trapezoidal-Triangular combination for input-output membership function, K= Estimated error for Trapezoidal- Trapezoidal combination for input-output membership function, L= Estimated error for Gaussian2 combination for input-output membership function, M= Estimated error for Gaussian2-Triangular combination for input-output membership function, N= Estimated error for bell shaped combination for input-output membership function, O= Estimated error for sigmoid combination for input-output membership function, P= Estimated error for pi-shaped combination for input-output membership function)
Step 9
The average error is calculated for each combination of input-output membership function and furnished in Table 7.
Table 7: Average error for input and output membership function
Sl. No. Membership function for
Input variable
Membership function for
Output variable
Average Error
1. Trapezoidal Triangular 0.36806
2. Trapezoidal Trapezoidal 0.3751
3. Gaussian2 Gaussian2 0.92
4. Gaussian2 Triangular 2.59
5. Bell shaped Bell shaped 1.008709762
6. sigmoid sigmoid 0.92496
7. Pi shaped Pi shaped 1.021738
Step 10
From Table 7, it has been observed that when using membership function for input variable as Trapezoidal membership function and output variable as Triangular membership function, the system gives minimum average error as compared to other membership function like , Gaussian,z-shaped,bell shaped,sigmoid and pi-shaped membership function combination. Therefore the input-output membership function combination as trapezoidal-Triangular has to be used for classification of yeast data with fuzzy rule base.
B. RESULT
Since trapezoidal-triangular membership function combination gives the minimum average error as compared to the others, this combination is best suitable for implementation of fuzzy rule base when classification of yeast dataset has been made.
IV. CONCLUSION
In this work a fuzzy rule base system is implemented using Matlab 2013b for the classification of yeast data, It is also shown that when using the membership function combination as trapezoidal and triangular membership function, the system gives best performance. The same technique may be used in other classification problems as well.
REFERENCES
[1] B. Alberts, D. Bray, J. Lewis, M. Raff, K. Roberts, J.D. Watson, Molecular Biology of the Cell, Garland, New York, 1994.
[3] Nakai, K., Kanehisa, M.: Expert system for predicting protein localization sites in gram-negative bacteria. Proteins: Structure, Function, and Genetics.11,95-110 (1991).
[4] Nakai, K., Kanehisa, M.: A knowledge base for predicting protein localization sites in eukaryotic cells. Genomics. 14, 897-911 (1992).
[5] Horton, P., Nakai, K.: A probabilistic classification system for predicting the cellular localization sites of proteins. In :Proceedings of Intelligent Systems in Molecular Biology, pp 109-115. St. Louis, USA (1996).
[6] Horton, P. ,Nakai, K.: Better prediction of protein cellular localizationsites with the k Nearest Neighbors classifier, pp. 147-152. AAAI Press.Halkidiki, Greece (1997).
[7] Yetian Chen, Predicting the Cellular Localization Sites of Proteins Using Decision Tree and Neural Networks, http://www.cs.iastate.edu/~yetianc/cs572/files/CS572_Project_YETIANCHEN.pdf.unpublished.
[8] Support Vector Machine with the Fuzzy Hybrid Kernel for Protein Subcellular Localization Classification “;Bo Jin, Yuchun Tang, Yan-Qing Zhang, Chung-Dar Lu and Irene Weber; The 2005 IEEE International Conference on Fuzzy Systems;pages 420-423.
[9] M. Barman, J Palchoudhury, S. Biswas,”A Framework for the Neuro Fuzzy Rule Base System in the diagonosis of heart disease”, International journal of Scientific and Engineering Research,vol-4,Issue 11,November 2013.
[10]UCI machine learning repository, :http://archive.ics.uci.edu/ml.
BIOGRAPHY
Shrayasi Datta: Shrayasi Datta is working as a Assistant Professor and Head of the department of the Department of Information Technology in Jalpaiguri Govt. Engineering. College, Jalpaiguri, West Bengal. She has more than 9 years of experience in research and academics. She is a member of Institution of Engineers,India, Indian Society for Technical Education (ISTE).