Epidemiological Challenges in Pandemic Coronavirus
Disease (COVID-19): Role of Artificial Intelligence
Abhijit Dasgupta1$∗ Abhisek Bakshi2$, Srijani Mukherjee1, Kuntal Das1, Soumyajeet Talukdar1, Pratyayee Chatterjee1, Sagnik Mondal1, Puspita Das1,
Subhrojit Ghosh1, Archisman Som1, Pritha Roy1, Rima Kundu1, Akash Sarkar1, Arnab Biswas1, Karnelia Paul3, Sujit Basak4, Krishnendu Manna5,
Chinmay Saha6, Satinath Mukhopadhyay7, Nitai P. Bhattacharyya7, and Rajat K. De8∗.
1Department of Data Science, School of Interdisciplinary Studies, University of Kalyani,
Kalyani, Nadia 741235, West Bengal, India;2Department of Information Technology, Bengal
Institute of Technology, Basanti Highway, Kolkata 700150, West Bengal, India;
3Department of Biotechnology, University of Calcutta, Kolkata 700019, West Bengal, India;
4Department of Physiology and Biophysics, Stony Brook University, Stony Brook, New York
11794, USA;5Department of Food & Nutrition, University of Kalyani, Kalyani, Nadia
741235, West Bengal, India;6Department of Genome Science, School of Interdisciplinary
Studies, University of Kalyani, Kalyani, Nadia 741235, West Bengal, India;7 Department of
Endocrinology and Metabolism, Institute of Post Graduate Medical Education & Research and
Seth Sukhlal Karnani Memorial Hospital, Kolkata 700020, West Bengal, India;8 Machine
Intelligence Unit, Indian Statistical Institute, 203 B.T. Road, Kolkata 700108, India.
Supplementary Material
$ To be considered as ‘First Authors’.
Supplementary Text
Databases for epidemiological studies
Here we are going to summarize some key characteristics of the publicly available data sets as follows.
COVID-19 open research data set1
The Allen Institute for AI2along with some leading research groups has shared the COVID-19 Open Research Data set (CORD-19). Such free resource comprises scholarly articles in order of thousands. The articles deal with the information on coronavirus family. One may apply natural language processing techniques to uncover the hidden relation among various findings. Such findings may help other researchers and doctors in assessing the outcome of some therapeutic procedure.
WHO COVID-19 data3
World Health Organization (WHO) has already started publishing and up-dating information about the affected cases over the world in regular interval. The numbers of death and recovery results are provided, which convey the speed of spreading of coronavirus into different parts of the world. Besides, WHO has been sharing various reports related to the study on applying candidate vaccines and several drugs.
ACAPS COVID-194
Here various measures associated with coronavirus are integrated in a sin-gle platform. The data sets consider several issues, such as social distancing, movement restrictions, public health measures, social and economic measures and lock-down among others, for such measurement. Public health as well as socio-economic conditions are also considered here.
World Bank indicators data set5
Presently, World Bank has taken an initiative to share data related to recent COVID-19 with the help of Humanitarian Data Exchange (HDX). HDX is an open platform that shares data across organizations during crises. HDX allows sharing data conveniently, using them for analysis.
1https://pages.semanticscholar.org/coronavirus-research 2https://allenai.org/
3https://www.who.int/emergencies/diseases/novel-coronavirus-2019/situation-reports/ 4https://data.humdata.org/dataset/acaps-covid19-government-measures-dataset 5
The data set can be broadly divided into three parts. Data are information related to health status of every individuals, basic hand sanitizing facility for the population with soap and water, and the population density with respect to a range of ages. Figures S1-S3 depict different entities and their attributes as well as relationship among them for the World Bank indicators database.
Kaggle6
Kaggle, one of the largest data science community in the world, has tried to involve a number of scientists to visualize the pattern of such pandemic activity worldwide. In response this emergency, they have prepared a COVID-19 Open Research Dataset (CORD-COVID-19)7 by incorporating disease along with recovery/death related information in the form of tables. Moreover, they have developed a time series data set having the track of history of a large number of patients worldwide. Figure S4 depicts the entities and their attributes of a small portion of Kaggle databse.
Genetic sequence database8
Genetic sequence database is a compilation of all freely available annotated DNA sequences. DNA GenBank is the part of the International Nucleotide Sequence Database Collaboration, which comprises European Nucleotide Archive (ENA), GenBank at NCBI and DNA DataBank of Japan (DDBJ). These or-ganizations exchange data among themselves regularly. The aim of GenBank database is to provide and promote access within the scientific community to the most recent and wide-ranging DNA sequence. National Center for Biotechnol-ogy Information (NCBI) has recently provided a set of SARS-CoV-2 sequences, accessible in the Sequence Read Archive (SRA) and GenBank. Currently, the repository contains 183 GeneBank sequences and 1 RefSeq sequence in Entrez Nucleotide, and the new NCBI Virus resource submitted from countries like China, Phillipines, Japan and Thailand.
Genomic database9
Nextstrain provides a frequently updated view of publicly available data of COVID-19. In addition, it contributes a set of alongside powerful analytic and visualization tools that allow epidemiological understanding of the disease and empower the researchers for the solution. A genome database can be described as a storehouse of DNA sequences from different species of plants and animals.
6https://www.kaggle.com/sudalairajkumar/novel-corona-virus-2019-dataset 7https://www.kaggle.com/allen-institute-for-ai/CORD-19-research-challenge 8https://www.ncbi.nlm.nih.gov/genbank/sars-cov-2-seqs/
Drug Database
In order to support the prediction based on different AI models, many drug-related databases have been developed to contain several types of drug-target interaction (DTI) information. Simultaneously, drug related databases are vital resources for DTI predictionsin silico1. Based on the content of databases, it can
be subdivided into four categories, drug centered or target centered databases, DTI databases, DTI affinity databases, and other supporting databases. In the class of “drug centered or target centered databases", seven databases are generally used, such as, BRENDA2, PubChem3, SuperDRUG24, DrugCentral5,
PDID6, Pharos7, and ECOdrug8. On the other hand, DTI database has
been developed for collecting and validating the DTI and related information. ChEMBL9, ChemProt 3.010, DGIdb 3.0 , DrugBank11, GtoPdb12, KEGG13, LINCS14, PROMISCUOUS15, STITCH16, SuperTarget17, and TTD18 have commonly used databases in this category. The aim of “DTI affinity databases" is to focus on the various collection of binding affinity among drugs, some related molecules and target proteins. In this category, PDBBind19, BindingDB20, and
PDSP Ki21 have been frequently used as a repository of a more significant
number of binding affinity data. Few other databases like FAERS22, SIDER23,
and JAPIC24are being used to obtain the information related to country-specific
adverse drug reaction (ADR) reports and medication error reports.
Socio-Economic Challenges
During the COVID-19 pandemic scenario, there are many comprehensive studies in detail to address the social and economic problems to be discussed in the following subsections.
Economic problem
Due to the outbreak of COVID-19, the entire world faces a major economic recession affecting entire global economy. Major economic challenges can be summarized as follows.
• Financial Impact: A huge disruption in the economic activities leads to
a crash in the stock market from February 20, 2020. Global markets have become extremely volatile10. The oil price war between Russia and Saudi Arabia is one of the main reason of current stock market crash leading to drop the prices of US oil by 34% and crude oil by 26%11.
• Hampering economic growth: In particular, in order to control the
spread of COVID-19, the countrywide lock-down is imposed on several nations, leading to massive chaos in multiple sectors, such as, manufacturing and services among others. It will have a large scale implications in terms of economic growth prospects.
10https://en.wikipedia.org/wiki/2020
stockmarketcrash
11https://en.wikipedia.org/wiki/2020 ussia%E2%80%93Saudi rabia
• Unemployment: The outbreak serves as a massive incentive for the firms to rightsize. Specifically, people employed in aviation, tourism and hotel industry are on the verge of losing their jobs. Several nations have appealed to profit-based entities on reconsidering layoffs12. Globally, it has been observed an increase in the filing of unemployment benefits indicating a rise in the unemployment rate13.
• Inflation: The outbreak causes a cut in supply leading to hike of prices
of food items and other essentials in many states. Evidently, in such cases, state administration should be more effective in supplying stocks, and protecting the interests of the consumers from black marketing14
Economists have also predicted a stagflation post-outbreak scenario due to the nearly stagnant economy with a sudden spurt in demand15.
Socio-economic challenges for the less developed economies
Less developed countries (LDCs) have infrastructural barriers to sustainable development. Their economic growth is very sensitive to economic and environ-mental shocks. COVID-19 outbreak can affect the social framework in addition to break down of its economic backbone. In the case of an epidemic/pandemic, the major socio-economic challenges of an LDC can be mostly categorized into three types as follows.
• Problems relating to infrastructure: Almost every developing nation
suffers from the problem of inadequate/weak infrastructure. The problem is most highlighted in the case of a disease outbreak. Developing nations, like India and Pakistan with high population density, are the most affected during such time as the ratio of medical and administrative personnel to people is very less 16. In addition, due to an inadequate number of hospitals, Personal Protective Equipment (PPE) and other infrastructural weaknesses, the rate of contamination remains alarmingly high even after adopting certain precautionary measures17.
• Problems relating to the organized sector: In the case of
develop-ing countries, a significant portion of the labor force is employed in the unorganized sector. During the nation-wide lock-down, shut down of such unorganized sector is affects these labor force facing great difficulty in
12https://en.wikipedia.org/wiki/Impact
ofthe2019%E2%80%9320coronaviruspandemiconaviation
13https://smartasset.com/financial-advisor/coronavirus-unemployment 14
https://edition.cnn.com/2020/03/10/investing/stagflation-economy-coronavirus/index.html
15
https://www.scmp.com/economy/china-economy/article/3074378/coronavirus-chinas-inflation-remained-high-february
16
https://www.indiatoday.in/india/story/coronavirus-in-india-boosting-medical-infrastructure-top-priority-says-health-ministry-1659196-2020-03-24
17
earning their daily bread. It is the duty of the government to provide some sort of financial security to such people in times of distress18.
• Problems of poverty: The prevalence of poverty in developing nations
renders them helpless at the time of crisis. Due to lower purchasing power (occupied by a large fraction in developing societies), poorer sections of the society, find difficulty to get access of prompt medical help along with essential items like food, clothes and shelter19. This scenario makes them
more susceptible to infection20.
A small case study of the Indian service sector
The service sector in India is a very dominant sector. The primary reason can be attributed to the fact that India has a huge population that generates sufficient demand for services21. With more and stronger infrastructure development, the
capital-labor ratio for developing nations, like India, can continue to improve, leading to generate huge amounts of revenue subjected to proper utilization. As of 2018, 31.45% of the Indian population is employed in the service sector22. It
is evident from Figure S9A that for any nation, the service sector contributes a lot to its GDP and consequently, its economic growth. A disruption in at least one of the services will trigger a chain of deadlocks that will adversely affect the economy23. The major impacts of the service sector in India can be summarized
as follows.
• Contribution of gross value added (GVA):The service sector plays
a crucial role in contributing to GVA of a nation. India has largest share of GVA coming from the service sector as estimated at 96.26 lakh crore INR in 2019. This was 54.40% of total GVA of India for 2018-1924.
• Employment generation: As essential services, this sector requires
both skilled and semi-skilled manpower. From 2018, India has entered a 37 year-long period of demographic dividend lasting till 2055. This has provided a larger section of the working-age population to the opportunity for employment in the tertiary sector along with human development prospects25.
18
https://theprint.in/india/governance/coronavirus-lockdown-what-states-are-doing-to-help-the-poor-and-unorganised-workers/388156/
19https://en.wikipedia.org/wiki/Poverty
20
https://www.usatoday.com/story/opinion/2020/03/23/coronavirus-spread-poverty-covid-19-stimulus-column/2899411001/
21https://www.ibef.org/industry/services.aspx 22https://en.wikipedia.org/wiki/Economy
ofIndia
23https://en.wikipedia.org/wiki/Tertiary
sectoroftheeconomy
24http://statisticstimes.com/economy/sectorwise-gdp-contribution-of-india.php
25
• Contribution to trade: With the improvement of the service sector, volume of trade is also rising. India is one of the principal economies contributing to the world services of export industry. As of October 2019, services export of India rose to 5.25% to USD 17.70 billion26.
• Contribution in foreign direct investment (FDI) inflows: Along
with necessary measures taken by government, such as, fixing a timeline for approvals and streamlining procedures towards improving ease of doing business in the country, the country has witnessed a large flux of FDI. This is an evident from the fact stating that foreign domestic investment in the services has been grown by 36.5% to become $9.15 billion in 2018-19 according to the Department for Promotion of Industry and Internal Trade (DPIIT)27.
As per the prior discussion, it is clear that outbreak of COVID-19 has a far fetched implication on trade and tourism industry. As nations in locked down state, international trade has come to a standstill situation. The case study aims to highlight the impact of corona virus on these areas of the service sector. For the case study, monthly data of three consecutive months, relating to before onset of the outbreak and after the COVID-19 outbreak, has been considered. The data has been obtained from monthly economic reports as published by the Department of Economic Affairs, Government of India28. Based on that, we
have prepared a final data set (illustrated in Table S3) according to the need of our analysis. Figure S9B depicts the visualization of the data in Table S3.
Based on the analysis as depicted in Figure S9B, it can be concluded that the ongoing COVID-19 outbreak affect mostly the trade hotel and storage part of the service sector. Prior to the crisis, it had a higher value of 6.9 in the month of November 2019. However, during pandemic scenario, major economies has put a temporary barrier on trade and commerce. Consequently, the estimated growth rate has slumped down to 5.9% in January 2020, and to 5.6% in February 2020. It can also be found that the crumbling tourism sector is one of the reason for the fall in growth rate. We expect that more data during ongoing pandemic situation in upcoming months will give everyone a deeper insight of the negative impact on the service sector.
Terminology
Some of key terminologies and related issues have been discussed here.
26
https://economictimes.indiatimes.com/news/economy/foreign- trade/indias-services-exports-grew-by-over-5-to-usd-17-70-billion-in-october-rbi-data/articleshow/72542056.cms?from=mdr
27
https://www.thehindubusinessline.com/economy/fdi-in-services-sector-up-37-per-cent-in-2018-19/article27499826.ece
• Inflation: Inflation is defined as the rise of the general price level. Mod-erate levels of inflation are generally considered as healthy for the economy because, with the growth of the economy, demand for goods and services rises. The increase in demand pushes the price up, leading to prompt the suppliers for production of the demanding materials. It results an enhance-ment in economic growth, and consequently, labour demand and wages increase. Generally, workers have more purchasing power in accordance with higher wages. Even their more demands trigger the ‘virtuous’ cycle of economic growth. Thus maintaining moderate inflation is good for economy. However, the problem arises when inflation rate fluctuates vigorously29,
i.e., when it becomes too high or low leading to economic stagnation, called as stagflation30. In general there are two kind of inflations: i) cost-push
inflation, and ii) demand-pull inflation. Demand-pull inflation happens when demand is greater than supply resulting equilibrium price to increase. On the other hand, cost pull inflation happens when supply is restricted with corresponding demand31.
• Stagflation: It is a combination of high inflation, unemployment and
stagnant economic growth. Here, due to the attempts of reviving economic growth and lower inflation, it may aggravate unemployment.
• Danger of very low inflation: A very low inflation rate32 generally
implies that demand of goods and services is usually lower than it should be. As a result, it slows down economic growth and reduces real wages. Due to low demand, producers will lay off employees, leading to high unemployment rates. This is evident from the case of the great recession about a decade ago. Deflation also accounts for consumers delaying their purchases. Subsequently, it makes lenders reluctant to give loans because of lower interest rates33.
• Danger of high inflation: A very high inflation rate34can cause a similar
kind of problem as of low inflation. Extremely high inflation rate may slow down the economy causing unemployment to rise. This combination of hyperinflation and high unemployment is called stagflation, a phenomenon feared by economists and policymakers all over the globe. Hence it is necessary to keep the inflation rate in moderate level.
29https://www.thebalance.com/inflation-impact-on-economy-3306102
30http://www.economicsdiscussion.net/inflation/top-6-effects-of-inflation-economy/26075 31https://www.investopedia.com/articles/05/012005.asp
32https://www.economicshelp.org/macroeconomics/low
inf lation/
33
https://www.weforum.org/agenda/2019/06/inflation-is-healthy-for-the-economy-but-too-much-can-trigger-a-recession-7d37501704
34
Population Data Country name
Country ID
Population ages 80 and above, male and female Percentage
of female population
Percentage of male population
Population ages 65 and above, male and female
Percentage of female population Percentage
of male population
Population of ages 0 - 14, male, female, total
Percentage of female population
Percentage of total population Percentage of male population
Percentage of total population Percentage
of female population
Percentage of male population Population of ages
15 - 64, male, female, total Total
Population Percentage
of total population
Percentage of total population
World Bank database continued...
Population Data A particul ar country has Health and hospital Data Number of hospital beds per 1000 people Female Number of physicians per 1000 people Number of nurses and midwives per 1000 people Country ID Country name Mortality from CVD, cancer or diabetes between exact ages 30 and 70 Diabetes
prevalence % of population aged 10 to 79
Total percentage % of males % of females By injury Cause of death (% of total) By non communicabl e diseases Smoking prevalence (% of adults)
Total Male Hospital attributes By communicable diseases, maternal, prenatal and nutritional conditions Expenditure per capita (present USS)
% of total expenditure
Out of pocket expenditure Expenditure per capita (international $) More than 10% More than 25% Proportion of population spending (% of income) on healthcare
World Bank database continued...
Figure S2:The figure illustrates the entity set of World Bank indicators database about COVID-19 and its attributes along with the relation among them (Part 2)
Population Data Health and hospital Data A particular country has A particular country has Water and sanitation Data Country name Country ID
People with basic hand washing facilities including soap and water
% of urban population % of rural
population % of total
population
World Bank database
Death details
A particular country has
Infected details
A particular country has
Recovery details
Cumulative cases of death Latitude
and longitude
Cumulative cases of infection state/provi
nce Country
name
Latitude and longitude
state/pro vince Country
name
Cumulative cases of recovery Latitude
and longitude
state/ province Country
name
Kaggle databases
0
12614
26384
Actual death cases
13
11024
24135
36324
Predicted death c
ases
Feb 15 Mar 1 Apr 16 May 02
6
Apr 01 May 17 Jun 0
2
(A) Day-wise prediction of death cases in Italy
Mar 0
1
F
eb 15 Mar 0 Apr 25
2 Mar 1 8 Apr 06 0 26607 54265
Actual death cases
26 27893 46761 96324 Mar 0 5 Mar 2 4
Apr 13 May 02 May 21 Jun 1
0
Jun 2
9
(B) Day-wise prediction of death cases in USA
death
F
eb 15 Mar 0 Apr 25
2 Mar 1 8 Apr 06 0 11614 22902
Actual death cases
0
10078
19955
31324
Feb 15 Mar 1 Apr 16 May 02
6
Apr 01 May 17 Jun 0
2
(C) Day-wise prediction of death cases in Spain Mar 0
1
death
F
eb 15 Mar 0 Apr 25
2
Mar 1
8
Apr 06 3
415 826 Actual inf ected cases 0 1019 2038 3043 India D death
Predicted death c
ases
F
eb 15 Mar 0 Apr 25
2
Mar 1
8
Apr 06
Figure S5: Our modified Susceptible-Infectious-Recovered-Death (SIRD) model predicts
5
16
17
13
10 3
12 9
15
14
6 2
11
7
18
8 4
NO
NO
NO
NO
A B C D
NO
YES A B C
9
YES
A B C
9
A B C
9
YES
1
A B
Hospital / medicine shop database
Questionnaires database
Verification Successful
Not Successful
Re-evaluate information
Go the algorithm as depicted in Figure S6 and S7
START
PATIENT ARRIVED
TYPES OF EXPOSURE
CLOSE CONTACT WITH COVID-19
PATIENT TRAVELLED
TO ANY COVID-19 AFFECTED
AREA
SEND THEM TO
NCRC SEND THEM TO NCRC
CHECK FEVER
CHECK COUGH
CHECK COUGH
CHECK BREATHING
TROUBLE CHECK
BREATHING TROUBLE
CHECK BREATHING
TROUBLE CHECK
BREATHING TROUBLE
SEND THEM TO MINIMAL RISK
SEND THEM TO MODERATE RISK
SEND THEM TO HCRC OR MHCRC SEND THEM TO
NCRC (LOW RISK)
SEND THEM TO ISOLATION(HIGH RISK)
NO
YES YES
NO
YES
YES
YES YES
NO
YES NO
NO NO
YES
YES NO
NO
NO
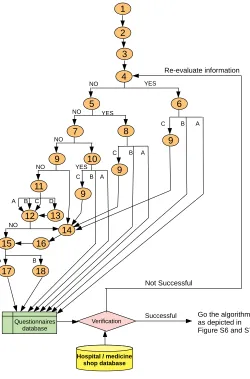
Figure S7:This flowchart shows how we can track mobile health check recommendation for
PATIENT ARRIVED AIDS AFFECTED (D2) CONSUME M6 CANCER AFFECTED (D1) AIDS AFFECTED (D2) CONSUME M6 CONSUME M5 D3
AFFECTED CONSUMEM1 CONSUME
M5 OR M6 CONSUME M1 AND/OR M2 AND/OR M3 AND/OR M4 CONSUME M2 AND/OR M3 AND/OR M4 CONSUME M2 AND/OR M3 AND/OR M4
Di AND/OR Dj AFFECTED (i!=j), i, j varies from 4 to 10 SEND THEM TO G12 SEND THEM TO G10 SEND THEM TO G6 SEND THEM TO G3 SEND THEM TO G1 SEND THEM TO G2 SEND THEM TO G5 SEND THEM TO G4 SEND THEM TO G9 SEND THEM TO G8 SEND THEM TO G11 SEND THEM TO G7 SEND THEM TO G13 SEND THEM TO G14 NO YES YES YES YES YES YES YES YES YES YES YES YES YES NO NO NO NO NO NO NO NO NO NO NO NO
Service name 0
2 4 6 8 10
Trade, hotel transport, and storage
Finance, real estate and prof. services
Public administration, defense, and other services
Overall
2019-20 Advanced Estimates of Nov’19 2019-20 Advanced Estimates of Dec’19 to Jan’20 2019-20 Actual Estimates of February’20
Growth rate in percentage at constant (2011-12) prices
(A)
(B)
Table S1: Set of sample questionnaires for maintaining transparency and availability of right information related to health of an individual.
Serial
number Question Questiontype Option
1 What is your name ? Short answer Not applicable
2 What is your contact
num-ber ? Short answer Not applicable
3 What is your age ? Short answer Not applicable
4 Do you have fever more
than 100◦?
Multiple
choice YesNo
5
If you have fever more than 100◦ then how many day you are facing such problem ?
Multiple choice
<1 week.
>1 week and>2 week.
>2 week.
6 Do you have dry cough ? Multiple
choice YesNo
7 Do you have body pain ? Multiple
choicee YesNo
8
If you have dry cough then how many day you are fac-ing such problem ?
Multiple choice
<1 week.
>1 week and<2 week.
>2 week.
9 Havemedicine in last two weeksyou taken any ?
Multiple
choice YesNo
10
If you have body pain then how many day you are fac-ing such problem ?
Multiple choice
<1 week.
>1 week and<2 week.
>2 week.
11 How many days ego you
have visited the hospital ?
Multiple choice
>1 year.
>1 month.
<1 month.
<2 week. 12 Please tell me the list ofmedicines, doctor advised. Descriptive Not applicable
13
If you have visited the hos-pital what 2 weeks then what was the symptom ?
Multiple choice
Cough Body pain Fever
All of the above
14 Please tell me the list ofmedicines, you have con-sumed.
Descriptive Not applicable
15 From where you have
bought your medicine ?
Multiple
choice YesNo
16 Did your doctor advised to
take vitamin tablet ?
Multiple
choice YesNo
17
If you select local shop, please provide the details of the shop.
Descriptive Not applicable
18
If you select online delivery, please provide the details of the company.
Descriptive Not applicable
Table S2: Set of decisions as per the flowchart of Figure S8
Serial
number Status Groups
1 Very High Risk. G-1, G-8
2 High Risk. G-2, G-3, G-4, G-7
3 Moderate Risk. G-5, G-6, G-11, G-13
4 Low Risk. G-9, G-10, G-12
Table S3: Growth in the service sector of India (Dec 2019 to Feb 2020) (Growth rate in percentage at constant (2011-12) prices)
Service Name
2019-20
Ad-vanced
Esti-mates of Nov
2019
2019-20
Ad-vanced
Esti-mates of Dec
2019 to Jan 2020
2019-20 Actual
Estimates of
February 2020
Trade, hotel transport,
and storage 6.9 5.9 5.6
Finance, real estate and
prof. services 7.4 6.4 7.3
Public administration, defense, and other services
8.6 9.1 8.8
References
[1] Bagherian, M.et al. Machine learning approaches and databases for predic-tion of drug–target interacpredic-tion: a survey paper. Briefings in Bioinformatics .
[2] Jeske, L., Placzek, S., Schomburg, I., Chang, A. & Schomburg, D. Brenda in 2019: a european elixir core data resource. Nucleic acids research 47, D542–D549 (2019).
[3] Kim, S. et al. Pubchem substance and compound databases. Nucleic acids research 44, D1202–D1213 (2016).
[4] Siramshetty, V. B. et al. Superdrug2: a one stop resource for ap-proved/marketed drugs. Nucleic acids research 46, D1137–D1143 (2018).
[5] Ursu, O.et al. Drugcentral 2018: an update. Nucleic acids research 47, D963–D970 (2019).
[6] Wang, C. et al. Pdid: database of molecular-level putative protein–drug interactions in the structural human proteome. Bioinformatics32, 579–586 (2016).
[7] Nguyen, D.-T.et al. Pharos: collating protein information to shed light on the druggable genome. Nucleic acids research 45, D995–D1002 (2017).
[8] Verbruggen, B.et al.Ecodrug: a database connecting drugs and conservation of their targets across species. Nucleic acids research46, D930–D936 (2018).
[9] Bento, A. P.et al. The chembl bioactivity database: an update. Nucleic acids research 42, D1083–D1090 (2014).
[10] Kringelum, J. et al. Chemprot-3.0: a global chemical biology diseases mapping. Database 2016(2016).
[11] Wagner, A. H. et al. Dgidb 2.0: mining clinically relevant drug–gene interactions. Nucleic acids research 44, D1036–D1044 (2016).
[12] Armstrong, J. F.et al. The iuphar/bps guide to pharmacology in 2020: extending immunopharmacology content and introducing the iuphar/mmv guide to malaria pharmacology. Nucleic acids research 48, D1006–D1021 (2020).
[13] Kanehisa, M., Furumichi, M., Tanabe, M., Sato, Y. & Morishima, K. Kegg: new perspectives on genomes, pathways, diseases and drugs. Nucleic acids research 45, D353–D361 (2017).
[15] Von Eichborn, J.et al. Promiscuous: a database for network-based drug-repositioning. Nucleic acids research 39, D1060–D1066 (2010).
[16] Zhu, D., Vaishampayan, P. A., Venkateswaran, K. & Fox, G. E. Stitch: Algorithm to splice, trim, identify, track, and capture the uniqueness of 16s rrnas sequence pairs using public or in-house database. Microbial ecology
61, 669–675 (2011).
[17] Günther, S.et al. Supertarget and matador: resources for exploring drug-target relationships. Nucleic acids research 36, D919–D922 (2007).
[18] Chen, X., Ji, Z. L. & Chen, Y. Z. Ttd: therapeutic target database.Nucleic acids research 30, 412–415 (2002).
[19] Liu, Z.et al. Pdb-wide collection of binding data: current status of the pdbbind database. Bioinformatics 31, 405–412 (2015).
[20] Gilson, M. K.et al. Bindingdb in 2015: a public database for medicinal chemistry, computational chemistry and systems pharmacology. Nucleic acids research 44, D1045–D1053 (2016).
[21] Roth, B. L., Lopez, E., Patel, S. & Kroeze, W. K. The multiplicity of serotonin receptors: uselessly diverse molecules or an embarrassment of riches? The Neuroscientist 6, 252–262 (2000).
[22] Moore, T. J., Morrow, R. L., Dormuth, C. R. & Mintzes, B. Us food and drug administration safety advisories and reporting to the adverse event reporting system (faers). Pharmaceutical Medicine 1–6 (2020).
[23] Kuhn, M., Campillos, M., Letunic, I., Jensen, L. J. & Bork, P. A side effect resource to capture phenotypic effects of drugs. Molecular systems biology
6(2010).