IJEDR1402209
International Journal of Engineering Development and Research (www.ijedr.org)2614
Complex Analysis of Soil Properties As Data
Variable for Scope in Fuzzy Logic Simulated
Modeling
1
Miss M.V.Mawale,
2Dr.Vinay Chavan
1Researcher, 2Associate professor
1Adarsha Science J.B.Arts and Birla Commerce, Mahavidyalaya, Dhamangaon Rly-444709 (India) M.S
1 [email protected],2[email protected]
_______________________________________________________________________________________________________ Abstract - this paper imposes on application of the methodology, which consists of several techniques used in computer science, to solve complex analysis of data for soil properties. This methodology allows the possibility of analyzing data with laboratory analysis, statistical analysis complex analysis and display geographic information and predicted soil properties useful for types of soil in the form of meaningful information. The paper describe the nature and properties of soils, complex analysis of data and how these data/variables was interconnected to each other and examine their dependability on each other. This paper helps to identify another effective way for complex analysis for soil using unknown data variables. Finally this paper exposes the need of Fuzzy logic modeling for making predictive model for crop productivity.
Index Terms - Complex Analysis, Fuzzy Logic System, Fuzzy Membership Function, Interference Rule, Soil Property
Simulation
________________________________________________________________________________________________________
I. INTRODUCTION
Complex analysis is used to predicate meaningful information from large data and representation of that data in graphical manner. Plant growth is the result of a complex process. Many biological, chemical and physical factors are responsible for determining soil quality [1].
As soil having different texture for different area , the soil properties of soil are in variation and its operation at a range of scales, show intermittent effects, and fluctuating more in some regions than in others.and prediction of such soil properties become complex[1].
The purpose of this paper is discuss the various essential factors for the soil fertility, but instead propose a methodology with different complex analysis techniques that help soil simulations and provide an option for the analysis of soil problems.
Soil contain macronutrient and micronutrient components which depend on many relationships; this complexity in soil properties difficult to construct models closer to reality[2]. Analyze such type of systems with a dynamic and multidimensional perspective and using data mining theory, fuzzy logic [3].
Fuzzy logic is based on expert system which precise information. Fuzzy logic systems (FLS) are used to develop free models and dynamic systems and the ability to improve result in systems which primarily work with uncertainty, imprecision and noise[4]. Fuzzy systems and neural networks have the capacity to model complex, non-linear processes to an highest degree of precision [5]. This paper contributes limitation of laboratory method and derivation of fuzzy membership functions and inference rules for predicting soil fertility as future scope.
The objective of our study is to use the specify methodology of mathematical and computational model theories that have not been appropriately considered in models of complex soil analysis. Researcher not only present discussion on the various determinants factors for the soil fertility, but also propose a methodology with different complex analysis techniques that helps in complex soil simulations and provide an an effective option for the analysis of soil problems using fuzzy logic methodology. II. MATERIALS AND METHODOLOGY
Complex soil analysis, include determination of basic and additional agricultural chemistry parameters (acidity of soil, organic matter, maintenance of accessible forms of nitrogen, phosphorus, potassium, micronutrients, sulphur, conductivity, soil texture) for finding out of potential of soil and optimization of mineral nutrition of plants.
Chemical analysis establishes the chemical composition and properties of soil. Micronutrient contents of soil and their availability to plant are assessed by the mineral present and weathering processes. It is well known that the optimum plant growth and crop yield depends not only on the total amount of nutrients present in the soil at a particular time but also on their availability which in turn is controlled by physico-chemical properties like: soil texture, organic carbon and calcium carbonate, cation exchange capacity, pH and electrical conductivity of soil
IJEDR1402209
International Journal of Engineering Development and Research (www.ijedr.org)2615
III. LABORATORY ANALYSIS AND STATISTICAL ANALYSISPH : Soil pH is defined as the negative logarithm of the hydrogen ion concentration. A pH and Electrical Conductivity of soil samples were measured by Soil Testing Kit Model 161E.
EC : Soil electrical conductivity, which is known as EC, is the ability of soil to conduct electrical current.Electrical conductivity (EC). The electrical conductivity of a soil samples was determined on an Equiptronic’s digital electrical conductivity bridge. N : The nitrogen supplying ability of the soil was determined by distilling soil with alkaline potassium permanganate solution. P : Available phosphorus was estimated by Olsen’s method
K : The flame photometric method (Jackson, 1958) was employed to estimate available K of samples.
C : The quantity of organic carbon of the soil was estimated by the method of Walkey and black (1934) described by Jackson. Mathematical fuzzy formulation for determining different parmeter are as follows
A. Determination of available potassium (C)
The Observation was:
1. Weight of soil taken = Wg
2. Vol. of 1N Potassium Dichromate added = 10ml
3. Vol. of 0.5N FAS required to neutralize 10ml of 1N Pot.Dichromate Solution(blank without soil) = B ml 4. Vol. of 0.5N FAS required for Soil = T ml
5. Vol.of 1 N H2Cr2O7 solution used for the oxidation of organic carbon present in the sample = 10(B-T) The organic carbon content (in %) of the soil was calculated as follows
---(Eq.1)
B. Determination of available potassium (K)
---(Eq.2) Available K2O Kg/ha= Available K ( Kg/ha) x 1.20
Where R = Reading ,F = Conc. Of K/ Corresponding reading, DF = Dilution factor.
C. Determination of available potassium (P)
= 1 Calorimeter reading=0.01 ppm(P) phosphorus ---(Eq.3)
D. Determination of available potassium (N)
---(Eq.4)
(
)
---(Eq.5)
IV. RESULT AND DISCUSSION
Table-1: Physical-chemical analysis of soil samples
Sample No PH EC C N P K Cu Fe Mg Zn
1 7.42 0.37 0.24 160.8 39.95 728 3.57 15.96 26.43 0.65 2 7.95 0.7 0.72 221.1 29.88 782.88 11.7 21.28 52.86 0.87 3 8.04 0.3 0.33 482.4 4.49 686.56 6.94 15.42 39.11 2.19 4 8.22 0.35 0.45 301.5 2.46 558.88 4.36 13.3 45.81 1.39 5 8.14 0.49 0.54 361.8 20.46 812 6.74 6.38 54.97 1.65 6 7.85 0.54 0.24 160.8 12.66 792.48 7.93 14.89 17.62 2.61 7 7.69 0.7 0.39 260.3 567.84 14.89 3.26 6.94 25.27 0.59 8 7.59 0.3 0.54 361.8 555.52 32.37 3.06 7.4 13.91 0.51 9 7.49 0.31 0.45 301.5 32.37 538.72 3.06 7.87 24.85 0.44 10 7.8 0.37 0.42 281.4 32.37 289.6 2.85 73.847 28.25 0.36 V. COMPLEX ANALYSIS OF SOIL PROPERTIES
IJEDR1402209
International Journal of Engineering Development and Research (www.ijedr.org)2616
Graph 2 : Graph showing various soil properties for each soil sampleGraph 3 Simulation graph using matlab
Graph 4 surface indicating soil characteristic observations
General rule which is applicable for soil analysis are
- PH :Mg is inversely proportion to ph, Ph is inversely or equal proportion to iron. Acidic ph is low in Ca .Acidic soil is inversely proportion to Al and Mg .Al and Mg inversely proportion to EC
IJEDR1402209
International Journal of Engineering Development and Research (www.ijedr.org)2617
- Sulphur : If soil contain organic matter from slow decomportion ,sulphur is found in sufficient amount.- Copper :Cu is lower in highly leach course textured soil, Cu is inversely proportion to ph ,Cu is inversely proportion to organic matter, Cu is inversely proportion to Zn , iron ,P.
- Nitrogen : If there is large ammonia then N is more present of micro organism , The 8.5 ph is optimal 25.5 is low nitrogen, If soil moisture is more or below field capacity ,Nitrogen is reduced, If soil aeration is more then N is more - P: Ph is inversely proportion to AL and P ,Temp is directly proportion to P ,amount of clay is directly proportion to P - Ec : Soluble salt is directly proportion to Ec , Ec is inversely proportion to ions.
From above graphical analysis we can drawn the conclusion as follows
- PH - Overall soil sample ph ranges from 7.42 to 8.22 All sample having soil ph>7 then all soil are acidic type As soil is acidic there is no use of lime but in sample 7 and 8 At pH values over 7, less than 50% of the Fe is available to plants. At pH 8.0, no Fe is left in solution due to iron hydroxide recipitation it means there is less amount of Fe Contradiction occure in sample 3,4 ,5 as there is ph> 8 there is more amount of Fe
- Fe - Cu availability decreases the Ph but there is again contradiction in sample 1 ph is 7.42 cu is 3.37. In sample 2 ph is 7.95 cu is 11.7.Zinc availability decreases as pH increases.Contradiction occure ph increases in soil sample 2 zn is also increases.Soils with high pH have limited manganese availability since manganese precipitates at high pH. Contradiction occure high oh 8.22 in soil sample 4 mg is also 45.81 and in soil sample 2 ph is 7.95 mg is 52.86
The availability of iron may be limited in soils with high pH, especially in arid, calcareous soils. Excessive liming can induce iron deficiencies. In sample 4 having high Ph contain 13.3 Fe and ph is 8.14 fe is 6.38.Soil pH: Acidic soils tend be low in calcium due to high aluminum saturation. Contradiction occur in sample 1 and sample 5.
- EC - From above observation EC of soil sample ranges from 0.3 to 0.7. It is mainly depend on soil texture but there is no data available for soil texture. From above observation we concluded that C changes with EC but soil sample 7 having Ec 0.7 but there is carbon 0.39 as compared to soil sample2
- K - All sample contain optimal or more amount of potassium except sample 7 and sample 8.It means soil aeration is low in all soil sample except sample 7 and 8.
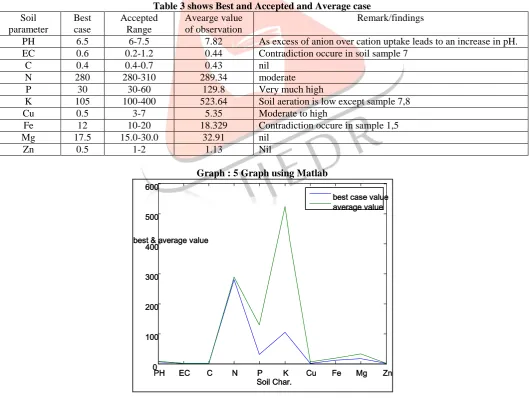
Table 3 shows Best and Accepted and Average case Soil
parameter
Best case
Accepted Range
Avearge value of observation
Remark/findings
PH 6.5 6-7.5 7.82 As excess of anion over cation uptake leads to an increase in pH.
EC 0.6 0.2-1.2 0.44 Contradiction occure in soil sample 7
C 0.4 0.4-0.7 0.43 nil
N 280 280-310 289.34 moderate
P 30 30-60 129.8 Very much high
K 105 100-400 523.64 Soil aeration is low except sample 7,8
Cu 0.5 3-7 5.35 Moderate to high
Fe 12 10-20 18.329 Contradiction occure in sample 1,5
Mg 17.5 15.0-30.0 32.91 nil
Zn 0.5 1-2 1.13 Nil
Graph : 5 Graph using Matlab
Scope for need of fuzzy logic modeling for prediction of soil properties Fuzzy logic starts by building a set of user-supplied human language rules. The fuzzy systems convert these rules to their mathematical equivalent value. Fuzzy logic models, called
PH EC C N P K Cu Fe Mg Zn
0 100 200 300 400 500 600
Soil Char. best & average value
IJEDR1402209
International Journal of Engineering Development and Research (www.ijedr.org)2618
fuzzy inference systems, made up of number of conditional "if-then" rules. These rules are easy to write, and as many rules as necessary can be supplied to describe the system adequately. With help of fuzzy logic we can drawn prediction of micronutrient present in soil for better soil fertility and provide way for precision agricultureVI. CONCLUSION OF ANALYSIS
Generally pH range 4.0 to 6.0 is ideal range as all nutrients are available to plants. But our soil sample contain PH ranging from 7.42 to 8.22 as excess of anion over cation uptake leads to an increase in pH.
In strong intense light (clear sunny days) plants take up more nitrogen from the nutrient solution so the acidity decreases (pH rises) as Dhamangaon region is under normal to high temp as compare to other
EC: It has been correlated to concentrations of nitrates, potassium, sodium, chloride, sulfate, and ammonia. Management that leads to poor infiltration, poor drainage, soil saturation, or compaction can increase EC.
As the amount of clay increases in the soil, the P-absorption capacity increases as well. This is because clay particles have a tremendous amount of surface area for which phosphate absorption can take place.
In sample no 1, it was less i.e. 160.8 and in site 3 comparatively more i.e. 482.4 mg/kg.Nitrogen content of soil directly affects soil pH which may be responsible for variation in spore density
Since many soil properties are interrelated with one another, it is difficult to draw distinct lines of division where one type of property dominates the behavior of the soil. Therefore, understanding and recognizing soil properties and their connections with one another is important for making sound decisions regarding soil use and management. There is possibility of making mistake while soil testing process. To remove this problem, fuzzy logic can handle problems with imprecise and incomplete data as need of future scope.
REFERENCES
[1] R.M. Larka,*, S.R. Kaffkab, D.L. Corwinca Multiresolution analysis of data on electrical conductivity of soil using wavelets,Journal of Hydrology 272 (2003) 276–290,
[2] Kevin McSweeney,Sabine Grunwald Soil mapping,Department of Soil Science Sept 8, 1999
[3] Bogart Yail Marquez, Ivan Espinoza- Hernandez, Manuel Castanon-Puga, Juan R. Castro, Eugenio D. Suarez Distributed Agencies Applied to Complex Social Systems, a Multi-Dimensional Approach,Trinity University, Department of Business Administration, Software Engineering and Computer Systems,Communications in Computer and Information Science Volume 179, 2011, pp 391-400
[4] Bogart Yail Márquez, Manuel Castañon-Puga, Juan R. Castro, Eugenio D. Suarez, José Sergio Magdaleno-Palencia. Fuzzy Models Applied to Complex Social Systems: Modeling Poverty using Distributed Agencies ,International Journal on New Computer Architectures and Their Applications (IJNCAA) 2011 (ISSN: 2220-9085)1(2): 292-303,The Society of Digital Information and Wireless Communications,
[5] Lakhmi C. Jain; N.M. Martin, Fusion of Neural Networks, Fuzzy Systems and Genetic Algorithms: Industrial Applications,CRC Press, CRC Press LLC,ISBN: 0849398045 Pub Date: 11/01/98
[6] Quality evaluation of restored soils with a fuzzy logic expert system (Citations: 1),Manfred Kaufmann, Silvia Tobias, Rainer Schulin Journal: Geoderma , vol. 151, no. 3, pp. 290-302, 2009
[7] R. M. Lark, A stochastic-geometric model of soil variation,Article first published online: 17 JUN 2009, DOI: 10.1111/j.1365-2389.2009.01152.x,© 2009 Rothamsted Research Ltd. Journal compilation © 2009 British Society of Soil Science,
[8] Heuvelink, G.B.M., Webster, R., 2001. Modelling soil variation: past, present and future.Geoderma 100, 269–301. [9] Laslett, G.M., McBratney, A.B., 1990. Further comparison of spatial methods for predicting soil-pH. Soil Science
Society of America Journal 54, 1553–1558.
[10] Voltz, M., Webster, R., 1990. A comparison of kriging, cubic splines and classification for predicting soil properties from sample information. Journal of Soil Science 41, 473–490.
[11] Webster, R., 2000. Is soil variation random? Geoderma 97, 149–163.
[12] Heuvelink, G.B.M., Webster, R., 2001. Modelling soil variation: past, present and future.Geoderma 100, 269–301. [13] www.eolss.net/Sample-Chapters/C19/E1-05-07-03.pdf
[14] solim.geography.wisc.edu/pdfs/geoderma77.pdf
[15] sdmdataaccess.nrcs.usda.gov/documents/SoilDataAccessQueryGuide.pdf [16] www.asprs.org/a/publications/proceedings/reno2006/0078.pdf