DEVELOPING ENHANCED CLASSIFICATION
METHODS FOR ECG AND EEG SIGNALS
Thesis submitted in fulfilment of the requirements for the degree of Doctor of Philosophy
College of Engineering and Science Victoria University
Australia
by Roozbeh Zarei
c
2017 Roozbeh Zarei
ABSTRACT
A huge amount of biomedical data such as Electrocardiography (ECG) and Electroen-cephalography (EEG) signals are recorded daily from human body to assess and mon-itor human performance and physiological condition. The analysis of these signals is important for research as well as for medical diagnosis and treatment. Although ECG and EEG signals provide useful information about the heart and brain, the classification of these signals has not been well developed. Even now these signals are often examined manually by physicians. Hence, there is a need for developing automatic classification techniques that evaluate and assess these signals. This thesis presents enhanced methods for the classification of ECG and EEG signals in three areas: the detection of premature ventricular contraction (PVC), the identification of epileptic seizure, and the recognition of motor imagery (MI) tasks in Brain-Computer Interface (BCI).
The classification of ECG signals is essential to diagnosis of critical heart condi-tions. In this thesis, ECG signals are classified to detect PVC beats which are the most common arrhythmias in humans. A new replacing strategy is developed to study and check the effects of PVC and normal heartbeats on the variation of principal directions. It is observed that the PVC beats have a larger effect on principal directions compared to the normal ones. Based on this property, an online PVC detection method is pro-posed to identify the PVC beats in the real-time. The experimental results indicate that the variation of principal directions caused by PVC beats can be used to identify PVCs accurately with an accuracy of more than 98%. The results also show the capability of the proposed method to effectively and efficiently detect PVC beasts in online manner.
novel feature extraction technique based on the Douglas-Peucker algorithm (DP) and the principal component analysis (PCA) is presented for the identification of epileptic seizure in multi-category EEG signals. The DP is used to extract the most representative samples from a large number of EEG data, and then the PCA is applied to reduce the dimensionality of the extracted samples. Four machine learning techniques: random forest classifier (RF), k-nearest neighbour algorithm (k-NN), support vector machine (SVM), and decision tree classifier (DT) are employed to evaluate the effectiveness of the proposed method. The results indicate that the DP is effective for extracting repre-sentative samples from EEG data and the RF classifier is one of the best techniques for detection of the epileptic EEG signal. The proposed feature extraction method with the RF classifier achieves the overall classification accuracy of 99.85%.
appli-cations. Furthermore, Both MLP and LS-SVM classifiers perform well (above 99% overall classification accuracy) in the MI-based EEG signals classification.
DECLARATION
I, Roozbeh Zarei, declare that the PhD thesis entitled‘Developing Enhanced Methods
for Detecting Abnormalities in ECG and EEG Signals’is no more than 100,000 words in length including quotes and exclusive of tables, figures, appendices, bibliography,
references and footnotes. This thesis contains no material that has been submitted
pre-viously, in whole or in part, for the award of any other academic degree or diploma.
Except where otherwise indicated, this thesis is my own work.
This thesis is dedicated to my parents
for their love, endless support
ACKNOWLEDGEMENTS
I would like to thank my principal supervisor Prof. Yanchun Zhang for his knowledge, guidance, patience and support. I would also like to thank my associate supervisors Prof. Jing He and Dr. Guangyan Huang for all their valuable feedback, advice, encour-agement and support.
The research presented in this thesis was conducted in the College of Engineering and Science at Victoria University (2013-2017). I was supported by the Australian Post-graduate Research Scholarship (VUPRS) offered by the College of Engineering and Science. This financial support is gratefully acknowledged.
I have been warmed and encouraged by the enthusiastic support of my family and friends. I thank my parents Fariba and Iraj who often had more faith in me than I had in myself. I am grateful for the encouragement and support of my friends Leila Rahimi, Soheil Gohari, Peng Zhang and Lee Sun.
LIST OF PUBLICATIONS
Based on this research work, the candidate has written the following papers, which have been published or resubmitted for publication in international journals.
1. Roozbeh Zarei, Jing He, Guangyan Huang, and Yanchun Zhang, “Effective and efficient detection of premature ventricular contractions based on variation of principal directions.”,Digital Signal Processing(50): 93-102, 2016.
2. Roozbeh Zarei, Jing He, Siuly Siuly, and Yanchun Zhang, “A PCA Aided Cross-Covariance Scheme for Discriminative Feature Extraction From EEG Signals”, Computer Methods and Programs in Biomedicine, (146): 47-57, 2017.
3. Roozbeh Zarei, Jing He, Siuly Siuly, and Yanchun Zhang, “Exploring Douglas-Peucker Algorithm in the Detection of Epileptic Seizure from Multi-category EEG Signals”, Submitted toEngineering Applications of Artificial Intelligence, 2017.
LIST OF ADDITIONAL PUBLICATIONS
Additional related publications by the author of this thesis are listed below.
1. Siuly Siuly,Roozbeh Zarei, Hua Wang, and Yanchun Zhang. “A New Data Min-ing Scheme for Analysis of Big Brain Signal Data.”Databases Theory and Appli-cations. ADC 2017, pp. 151-164, 2017.
2. Jing He, Roozbeh Zarei, Jie Cao, Kersi Taraporewalla, Michale Steyn, Andre Van Zundert, Guangyan Huang, Haolan Zhang, and Chi-Hung Chi. “Building the Computational Virtual Reality Environment for Anaesthetists’ Training and Practice.”IEEE International Conference on Services Computing (SCC), pp. 242-248, 2015.
Process-ing.” In International Conference on Health Information Science, pp. 220-228. Springer International Publishing, 2014. (Best Paper Award)
TABLE OF CONTENTS
Declaration . . . iii
Dedication . . . iv
Acknowledgements . . . v
List of Publications . . . vi
Table of Contents . . . viii
List of Tables . . . x
List of Figures . . . xi
1 Introduction 1 1.1 Introduction . . . 1
1.2 Motivations and Problems . . . 2
1.3 Objectives and Contributions . . . 5
1.4 Thesis Structure . . . 7
2 ECG and EEG Signals-Background Knowledge and Classification 9 2.1 Background Knowledge Related to ECG Signals . . . 9
2.1.1 Human Heart: Anatomy and Function . . . 9
2.1.2 The Conduction System of the Heart . . . 12
2.1.3 Electrocardiogram . . . 15
2.1.4 Premature Ventricular Contraction . . . 21
2.2 Background Knowledge Related to EEG Signals . . . 23
2.2.1 Human Brain: Structure and Function . . . 23
2.2.2 Neurophysiology of Human Brain . . . 26
2.2.3 Electroencephalography . . . 30
2.2.4 Epilepsy and Epileptic Seizures . . . 33
2.2.5 Brain-Computer Interfaces . . . 36
2.3 Review of the ECG and EEG Classification . . . 39
2.3.1 PVC Beat Classification Methods . . . 40
2.3.2 Epileptic Classification Methods . . . 44
2.3.3 MI Signal Classification Methods in the BCI . . . 47
3 Effective and Efficient Detection of Premature Ventricular Contractions Based on Variation of Principal Directions 51 3.1 Introduction . . . 51
3.2 ECG Data . . . 54
3.3 Method for Online PVC Heartbeat Detection . . . 55
3.3.1 Heartbeat Detection . . . 57
3.3.2 Segmentation and Normalisation . . . 57
3.3.3 PVC Detection via Variation of Dominant Principal Directions . 58 3.4 Classification Performance Measures . . . 67
3.5 Results . . . 69
3.5.2 Comparison with Published Studies . . . 70
3.6 Conclusions . . . 75
4 Exploring Douglas-Peucker Algorithm in the Detection of Epileptic Seizure from Multi-category EEG Signals 76 4.1 Introduction . . . 76
4.2 Previous Work . . . 81
4.3 Proposed Approach . . . 83
4.3.1 Data Segmentation . . . 84
4.3.2 Douglas-Peucker Algorithm . . . 85
4.3.3 Dimension Reduction by PCA . . . 88
4.3.4 DP PCA Feature Set . . . 90
4.3.5 Classification by the RF,k-NN, SVM, and DT . . . 90
4.4 Data and Implementation . . . 94
4.4.1 The Epileptic EEG Data . . . 94
4.4.2 Implementation . . . 95
4.5 Results and Discussions . . . 101
4.5.1 Classification Results for Each Classifier . . . 102
4.5.2 Comparison . . . 108
4.6 Conclusion . . . 109
5 A PCA Aided Cross-Covariance Scheme for Classification of MI Tasks 111 5.1 Introduction . . . 112
5.2 Materials and Method . . . 114
5.2.1 EEG Datasets . . . 114
5.2.2 Proposed Method . . . 116
5.3 Performance Evaluation . . . 127
5.4 Experiments and Results . . . 128
5.4.1 Parameter Selection . . . 128
5.4.2 The MI Classification Results for Each Classifier Testing Dif-ferent Features Fs1 and Fs2 . . . 129
5.4.3 Performance Comparisons Between the Proposed Methods and the Existing Techniques . . . 134
5.5 Conclusions . . . 137
6 Conclusions and Future Work 139 6.1 Summary . . . 139
6.2 Future Work . . . 142
LIST OF TABLES
2.1 Significance of EEG in different frequency bands. . . 34
3.1 Heartbeat classes associated with the extracted beats for the full database, dataset 1 (Ds1) and dataset 2 (Ds2) from the MIT-BIH ar-rhythmia database. . . 55
3.2 The resulting angle of each heartbeat in the sample ECG. . . 63
3.3 The effect of different values ofkon resulting angles of different heart-beats classes for nine records in the training dataset DS1. . . 66
3.4 Performance measures used in this study for distinguishing PVC from non-PVC. . . 68
3.5 Overall performance for nine records in the training set (DS1) using different values ofr1 andr2 in the classification function. . . 69
3.6 Classification performance on each recording of DS1 using the AAMI recommended performance measures. . . 71
3.7 Confusion matrix on DS1 data set. . . 72
3.8 Classification performance on each recording of DS2 using the AAMI recommended performance measures. . . 73
3.9 Confusion matrix on DS2 data set. . . 74
3.10 Comparison between this study and published studies. . . 74
4.1 Summary of the epileptic EEG data. . . 95
4.2 The obtained value offor eachSegmin each of the five classes . . . . 97
4.3 The representative samples chosen by DP for eachSegmin each of the five classes. . . 99
4.4 Classification results on the epileptic EEG data. . . 103
4.5 Obtained false positive rate (FPR) for each of the proposed classifiers. . 106
4.6 Comparison with the existing methods on epileptic EEG database. . . . 110
5.1 Set of features extracted from each cross-covariance sequence. . . 123
5.2 The selected features by BestFirst+CfsSubsetEval for each subject in datasets (IVa and IVb). . . 124
5.3 The obtained values for the LS-SVM parameters (Υ and σ2) for each subject in dataset IVa. . . 130
5.4 The obtained values for the LS-SVM parameters (Υ and σ2) for the subject in dataset IVb. . . 130
5.5 The classification results of each classifier based on the eleven-feature set (Fs1) in dataset IVa. . . 131
5.6 The classification results of each classifier based on the two-features set (Fs2) in dataset IVa. . . 131
5.7 The classification results of each classifier based on the eleven-feature set (Fs1) and the two-feature set (Fs2) in dataset IVb. . . 133
LIST OF FIGURES
2.1 Basic heart anatomy schema (Adapted from [35]). . . 10
2.2 The AV plane and the four valves view from above with the atria and major vessels removed (Adapted from [36]). . . 11
2.3 The conduction system of the heart (Adapted from [35]). . . 13
2.4 Ion exchanges at the surface of the cell membrane that generate the action potential (Adapted from [39]). . . 14
2.5 The cardiac action potential for each of the specialised cells found in the heart (Adapted from [35]). . . 15
2.6 A typical ECG waveform (Adapted from [35]). . . 16
2.7 Standard 12-lead ECG placement (Adapted from [43]). . . 17
2.8 Standard limbs lead positions of Einthoven (Adapted from [43]). . . 19
2.9 Augmented lead positions and connections (Adapted from [43]). R stands for resistors which are usually set to 5 K. . . 19
2.10 Precordial lead positions (Adapted from [43]). R stands for resistors which are normally set to 5 K. . . 20
2.11 Frontal and horizontal planes (Adapted from [46]). . . 21
2.12 Typical ECG beat: . . . 22
2.13 Schematic midsagittal view of the human brain (Adapted from [57]). . 24
2.14 The four major lobes of the cerebrum (Adapted from [35]). . . 26
2.15 CNS nerve cells: (Adapted from [59]) . . . 27
2.16 Action potentials: (Adapted from [59]) . . . 28
2.17 Electrical dipole measured by EEG electrode (Adapted from [60]). . . 30
2.18 The International 10-20 electrode placement system (Adapted from [61]). 32 2.19 Example of EEG rhythms in different frequency bands (Adapted from [64]). . . 33
2.20 General BCI architecture (Adapted from [71]). . . 37
3.1 Schematic representation of the proposed PVC detection. . . 56
3.2 A segment of ECG recording 119, with the R-wave peaks of non-PVC beats marked by ‘N’ and PVC beats marked by ‘V’. . . 56
3.3 First segment extracted from the sample ECG signal shown in Figure 3.2. 58 3.4 The Construction of normal data matrixMand data matrixM20 . . . . 61
3.5 The effects of replacing a non-PVC or a PVC beat on the principal directions. . . 62
4.1 Block diagram of the proposed method for the classification of epileptic EEG signals. . . 84
4.2 An example of determiningSegmsfrom an EEG signals of a class. . . . 85
4.3 An example of DP sample point extraction. . . 86
4.4 The structure of random forest classifier. . . 91
4.6 The typical results of DP for the healthy subject: . . . 98 4.7 The typical results of DP for the epileptic patient: . . . 99 4.8 The cumulative eigenvalues for all 100 eigenvectors. . . 100 4.9 Individual classification performances of each of the ten folds in each
class for the proposed classifiers: (a) RF, (b)k-NN, (c) SVM, (d) J48 . . 104 4.10 The overall classification accuracy (OCA) in each of the ten folds. . . . 105 4.11 The AUC for the proposed classifiers. . . 107 4.12 Kappa statistics values for the proposed classifiers . . . 108
5.1 Block diagram of the proposed method for the MI tasks classification in BCIs. . . 116 5.2 The dominant temporal patterns extracted from: . . . 119 5.3 Typical cross-covariance sequences obtained for the right-hand and the
right-foot MI signal for the subjectaain dataset IVa. . . 121 5.4 Typical cross-covariance sequences obtained for the right-foot and the
left-hand MI signal for dataset IVb. . . 122 5.5 The total execution time of the proposed method based on: . . . 135 5.6 ROC area for the MLP, LS-SVM and LR classifiers with feature set Fs2
CHAPTER 1
INTRODUCTION
1.1
Introduction
Due to the rapid development of technology and increased usage of portable monitoring devices, a significant amount of biomedical data is recorded daily to monitor and observe physiological condition of human body. These biomedical signals quantify the physio-logical activities of different organs such as heart, brain, muscles, cornea, etc. They are usually obtained by placing one or more electrodes on the organ of interest. Electro-cardiogram (ECG) and Electroencephalogram (EEG) are the most common biomedical signals recorded from heart and brain, respectively.
ECG signal is an electrical signal generated by cardiac muscles. ECG signals reflect the electrical activity of the heart over time and provide useful information about the state of the heart. EEG signal is a recording of the electrical activities of the brain from electrodes on the scalp. EEG signals provide information about how the brain functions act over time. A detailed discussion about ECG and EEG is provided in Chapter 2. As EEG and ECG are fully safe and non-invasive procedures with no possible risk, they have become valuable tools for research purposes and disease diagnosis. ECG is commonly used for diagnosis of heart disease and abnormalities such as arrhythmia [1], detecting obstructive sleep apnea [2], and biometric identification [3]. EEG has been used in different fields, including brain disease diagnosis [4], fatigue monitoring [5], and brain computer interface [6].
and efficiently analyse these biomedical signals due to the complexity of these signals. The evaluation of these signals is generally conducted by trained medical experts who visually scan the ECG and EEG records. The visual scanning of ECG and EEG sig-nals is very time-consuming and costly; it may be inaccurate, very complex, subject to judgement and human error as these signals usually contain a huge amount of data. Therefore, there is an increasing need for developing automated classification methods not only to alleviate the expert’s burden of analysing long-term ECG and EEG signals but also to ensure a proper diagnosis and evaluation of diseases of the heart and brain.
This thesis focuses on the classification of ECG and EEG signals in three areas, namely, premature ventricular contraction (PVC) classification, epileptic seizure detec-tion, and classification of motor imagery tasks for BCI system.
1.2
Motivations and Problems
PVC is the most common arrhythmias in humans which can be linked to mortality as-sociated with myocardial infarction [7]. It is considered as a precursor of more severe cardiac arrhythmias such as ventricular fibrillation [8], and atrial fibrillation [9]. There-fore, their immediate detection and classification are essential to prevent the possible beginning of life-threatening cardiac conditions. PVCs detection and classification can be performed by monitoring and analysing the ECG signals as they generate a different ECG morphology than a normal heart beat. A description about PVC is provided in Chapter 2.
for this purpose. From the literature, it is observed that there are still some limitations in the PVC detection and classification methods. As ECG signals commonly exhibit inter-and intra-patient variability in morphology inter-and timing, one challenge in the current ECG classifications is how to achieve high classification accuracy over a large number of patients. A classifier can perform well and achieve high classification performance on relatively small data sets but it could easily fail when faced with a big dataset con-taining various ECG waveforms from different patients. Developing a simple classifier which is capable of classifying PVC arrhythmia on real-time is another challenge in ECG arrhythmia classification. Most of the existing techniques employ many compli-cated mathematical tools such as wavelet transform and artificial neural network to ex-tract the relevant information from ECG signals for arrhythmia classification. Thus, they are not suitable for real time implementation where the lower computation complexity is expected. The efficiency of these methods is mainly accompanied by high complexity and long computational time. To overcome these problems, in this thesis, a method was proposed for online PVC classification which is evaluated on the benchmark MIT-BIH arrhythmia database.
component in diagnosis and treatment of epilepsy.
BCI is a communication system that provides a direct communication channel for transmitting messages from the human brain to computers by analysing the brain’s men-tal activities [12]. BCI systems make the use of EEG signals to translate a subject’s thought or intention into a control signal that allows a subject, such as a disabled per-son, to communicate with a device, such as a wheelchair. BCI systems can only detect and classify specific activity patterns in continuous brain signals associated with certain events or tasks. In recent years, there has been increased attention to the classification of motor imagery (MI) tasks for BCI applications. MI task is a mental process by which a user simulates or imagine a given action such as movements of hands and feet, without performing it. A detailed discussion of BCI systems is provided in Chapter 2.
classification methods for epileptic seizure detection, and motor imagery classification in BCI.
1.3
Objectives and Contributions
This research aims to develop new methods and techniques for the classification of ECG and EEG signals. The main objectives of this thesis are:
• To develop a low complexity algorithm for online premature ventricular
contrac-tions detection from ECG signals.
• To propose a method for accurate epileptic seizure detection in multi-category
EEG signal.
• To introduce a method for classification of motor imagery based EEG signals in
BCI system.
• To empirically evaluate the classification performance of the proposed methods on
different benchmark ECG and EEG databases with some state-of-the-art methods presented in the literature.
In summary, the main contributions of this thesis are:
• A Method for Detection of Premature Ventricular Contractions
of the proposed method, an efficient computation for estimating principal direc-tions is also proposed. The proposed method is evaluated on two non-overlapping data sets from the MIT-BIH arrhythmia database to assess its performance over large data. The experimental results showed that the proposed PVC detection method can achieve high classification accuracy and outperforms some existing methods [13, 14, 15, 16]. This approach can help clinicians to diagnose PVC arrhythmia by processing ECG signal in an online manner.
• A Method for Identification of Epileptic Seizure
A novel feature extraction technique based on Douglas-Peucker algorithm (DP) and principal component analysis (PCA) is developed for classification of epilep-tic seizure in multi-category EEG signals. In this research, the effectiveness of the proposed method is evaluated by applying four machine learning techniques: random forest classifier (RF),k-nearest neighbour algorithm (k-NN), support vec-tor machine (SVM), and decision tree classifier (DT) on a benchmark epileptic EEG dataset. The results indicate that the proposed method can effectively extract the representative features set from EEG signals and the random forest classifier achieves the best performance on the proposed features set compared to the other classifiers tested. The proposed method also outperforms some recently reported methods [17, 18, 4, 19, 20, 21]. This method can help neurologists and researchers to classify the epileptic EEG signals.
• A Method for Classification of Motor Imagery Tasks
ver-ify the effectiveness of the proposed method, three machine learning techniques: multilayer perceptron neural networks (MLP), least square support vector ma-chine (LS-SVM), and logistic regression (LR) are employed for the classifi-cation of the extracted MI features. The proposed method is tested on two benchmark datasets, IVa and IVb of BCI Competition III. The results show all three classifiers achieve high classification performance for the proposed fea-ture set and the proposed method outperforms the most recently reported meth-ods [22, 23, 24, 25, 6, 26, 27, 28, 29, 30] in terms of average accuracy. The pro-posed method can effectively extract characteristic information from MI-based EEG signals in BCI applications and also reduce the computational complexity of classifiers by reducing the number of extracted features. It also has a poten-tial for developing an MI-based BCI analyses that can contribute in diagnosis and rehabilitation practices.
1.4
Thesis Structure
The rest of this thesis is organised as follows:
Chapter 2 provides background knowledge about ECG and EEG signals and
re-views some existing methods for ECG and EEG classification. It first introduces the general concepts and background knowledge about the human heart, the fundamentals of ECG, PVC and the effect of PVC on the ECG signals. Then a background knowledge about the human brain is provided, together with the fundamentals of EEG, epilepsy and BCIs. Finally, this chapter reviews some methods for the classification of ECG and EEG signals.
prin-cipal directions. In this approach, the effects of non-PVC and PVC heartbeats on the variation of principal directions are studied and used for the classification of PVC beats. It also introduces an effective computation for estimating principal directions to reduce the computational complexity of the proposed method.
Chapter 4introduces a novel feature extraction technique based on the DP and the PCA for detection of epileptic seizure from multi-category EEG signal. It also inves-tigates the effectiveness of DP algorithm in the classification of epileptic seizure from EEG data and identifies a suitable classifier for the proposed feature method by evaluat-ing four classification algorithms.
Chapter 5presents a robust feature extraction method combining the PCA and the CCOV for the extraction of discriminatory features from the mental states based on EEG signals in BCI applications. It also investigates which features are the best for characterising the distribution of mental states signals and evaluates three classification algorithms to find out an efficient classifier for the MI signal classification.
CHAPTER 2
ECG AND EEG SIGNALS-BACKGROUND KNOWLEDGE AND
CLASSIFICATION
This chapter provides background knowledge about ECG and EEG signals and reviews some existing methods for ECG and EEG classification. Section 2.1 provides the general concepts and background knowledge about ECG and PVC. A background knowledge about EEG, epilepsy and BCIs is given in Section 2.2. Section 2.3 reviews some meth-ods for the classification of ECG and EEG signals in three areas: the detection of PVC, the identification of epileptic seizure, and the recognition of MI tasks in BCI.
2.1
Background Knowledge Related to ECG Signals
This section provides the background knowledge related to ECG signals. As ECG is generated from the heart, Section 2.1.1 gives a brief overview on the anatomy of the heart and its functions. Section 2.1.2 focuses on the electrical system of the heart and the sources behind its electrical activities. A review on ECG and its waves is discussed in Section 2.1.3. Section 2.1.4 briefly describes PVC and its effect on the ECG.
2.1.1
Human Heart: Anatomy and Function
Figure 2.1: Basic heart anatomy schema (Adapted from [35]).
pericardium. The human heart is roughly the size of a clenched fist and weighs between about 280 to 340 grams in men and 230 to 280 grams in women [32].
The human heart consists of four chambers (as shown in Figure 2.1): upper left and right chambers (atria) and lower left and right chambers (ventricles) [33]. The right atrium and the right ventricle are together considered as right heart, and the left atrium and the left ventricle are considered as left heart [34]. The right heart pumps deoxygenated blood to lungs for oxygenation while the left heart pumps oxygenated blood to all body tissues for sustaining cellular respiration.
Figure 2.2: The AV plane and the four valves view from above with the atria and major vessels removed (Adapted from [36]).
a plane which is commonly known as the atrioventricular (AV) plane. Figure 2.2 shows an overview of the AV plane and all four valves. The four valves are surrounded by dense connective tissue which keeps the structure of the valves and electrically isolates the atria and ventricle.
The wall of the heart comprised of three layers: epicardium (outer layer), my-ocardium (middle layer), and endmy-ocardium (inner layer) [34]. The epicardium protects and lubricates the outside portion of the heart and is composed of connective tissues. The thickest part of the heart wall is the myocardium which is formed by cardiac muscle and is responsible for pumping the blood. The endocardium keeps blood from sticking and prevents the formation of harmful blood clots.
car-bon dioxide and receives oxygen in the lungs and returns as oxygenated blood to the left atrium through pulmonary vein. In the systemic circuit, oxygenated blood is forced out from the left ventricle to the systemic circulation via the aorta and then goes into smaller arteries and capillaries to provide oxygen to body tissues. From tissues, deoxygenated blood returns to the heart via the venae cavae and enters the right atrium. This blood circulation is achieved by a series of contractions and relaxation of the heart muscle in a cyclic pattern which can be described by the Cardiac Cycle.
2.1.2
The Conduction System of the Heart
The conducting system of the heart consists of a group of specialised cardiac muscle cells known as autorhythmic cells and conducting fibres. It is responsible for generat-ing electrical impulses and conductgenerat-ing them through the heart. Figure 2.3 illustrates the conduction system of the heart. The autorhythmic cells serve as a pacemaker to start the normal cardiac cycle and provide the conduction system to coordinate the contractions of cardiac chambers. These cells periodically generate electrical impulses without ner-vous input. However, the rate of electrical impulses produced by these cells is controlled by the autonomous nervous system depending on needs of the body.
Figure 2.3: The conduction system of the heart (Adapted from [35]).
an electrical impulse that propagates as an electrical wave through both atria towards the AV nodes. The electrical wave depolarises the atrial myocytes and creates a wave of contraction on both atria which pumps the blood to the ventricles. The electrical impulse from SA node eventually reaches the AV node which is located at the junction of atria and ventricles and is delayed briefly (120 milliseconds) in order to allow the atria to contract and fully pump all the blood into the ventricles. Both the mitral valve and the tricuspid valve close once the atria pump all blood into the ventricles. At this phase, the atria start to refill, and the electrical impulse travels through the AV node and Bundle of His into the Bundle branches and Purkinje fibres. Finally, the electrical impulse is spread throughout the ventricular wall cells causing them to contract. Then the right ventricle pumps blood to the lungs while the left ventricle pumps blood into the aorta.
16 Chapter 2. From a Normal Heart to Tetralogy of Fallot
Heart Conduction System Schematic ECG
Figure 2.4: Left panel: Heart conduction system. the electrical activity of the heart
is triggered by the sinuatrial nodes (1) and then the atrioventricular nodes (2). It is transported by the left bundle (5) and the right bundle (10) branches and finally
transmitted to the myocardium (8) through the Purkinje fibres (9). Right panel:
Simplified ECG with the main electrical waves (Images from Wikipedia).
Because the electrical wave controls the cardiac contraction, its healthiness is crucial for an efficient cardiac function. The vast majority of sudden deaths are due to local alterations of the cardiac electrophysiology. The APD can be locally altered by lesions, after a myocardial infarct for instance or due to chronic diseases or surgery sequels. Such adverse events can indeed damage cardiac cells, reducing their electrical conductivity, thus hampering the cardiac synchrony. Regions of non-excitable cells can for instance yield wave re-entry, the main source of cardiac fibrillation. Modelling cardiac electrophysiology is therefore a very active research field to predict complex and life-threatening cardiac abnormalities.
Figure 2.5: Ion exchanges at the surface of the cell membrane that generate the
action potential (Figure from [Marbán,2002]).
Figure 2.4: Ion exchanges at the surface of the cell membrane that generate the action potential (Adapted from [39]).
Figure 2.5: The cardiac action potential for each of the specialised cells found in the heart (Adapted from [35]).
2.1.3
Electrocardiogram
ECG is the non-invasive method used to record the electrical activity of the heart over time by attaching electrodes to the surface of the patient’s skin. It is a diagnostic tool which provides information about the state of the heart. It is widely used by physicians to study heart function and to diagnose heart diseases [40]. ECG device records the electrical cardiac signals as characteristic waves which reflect different periods of the heart cycle. Figure 2.6 illustrates a typical ECG beat signal and its various waves.
2.1.3.1 ECG Waves and Interval
Figure 2.6: A typical ECG waveform (Adapted from [35]).
electric currents during the atrial depolarisation [40]. The QRS consists of the Q, R, and S waves and represents the electrical wave spreads over the ventricles during the ventricular depolarisation. The T wave represents the repolarisation of ventricles. The repolarisation of the atria occurs during ventricular depolarisation and is buried within the QRS complex, so it is not visible on ECG signal [41]. A U wave may be present after the T wave which represents the late repolarisation of Purkinje fibres in ventricles. The PR interval is measured from the beginning of the P wave to the beginning of the QRS complex. The PR interval represents the time required for the electrical impulse to travel from SA node through the AV node and to enter the ventricles. The QT interval is measured from the beginning of the QRS complex to the end of the T wave. The QT interval reflects the time for both ventricular depolarisation and repolarisation.
Figure 2.7: Standard 12-lead ECG placement (Adapted from [43]).
of heart and comparing them to their nominal range. It worths to mention that other parameters such as age, sex and gene are also taken into account for the actual clinical diagnosis [42].
2.1.3.2 ECG Signal Acquisition
The 12-lead ECG consist of twelve leads: three standard limb leads (Leads I, II, and III), three augmented limb leads (Leads aVR, aVL, and aVF) and six precordial leads (leads V1, V2, V3, V4, V5, and V6). These leads are categorised in bipolar and unipolar. The bipolar leads are measured between two electrodes (positive and negative electrodes) and unipolar leads are measured between one electrode (positive electrode) and a reference point. The standard limb leads are bipolar while the augmented limb leads and the precordial leads are unipolar.
Einthoven [44] introduced the lead positions and connections for the standard (bipo-lar) limb leads. The electrodes are placed on the right arm, left arm and left leg of a person as shown in Figure 2.8. The standard limb leads are defined as:
I =ΦLA−ΦRA
II =ΦLL−ΦRA
III =ΦLL−ΦLA
(2.1)
where the VLA is the potential of the left arm, the VRA is the potential of the right arm, and the VLL is the potential of the left leg.
Figure 2.8: Standard limbs lead positions of Einthoven (Adapted from [43]).
aV R=ΦRA−
ΦLA+ΦLL 2
aV L=ΦLA−
ΦRA+ΦLL 2
aV F =ΦLL−
ΦRA+ΦLA 2
(2.2)
Figure 2.9: Augmented lead positions and connections (Adapted from [43]). R stands for resistors which are usually set to 5 K.
across the chest as shown in Figure 2.10. These leads are defined as the potential differ-ence between one of the electrodes and a common referdiffer-ence point which is commonly called Wilson Central Terminal (WCT). The WCT is obtained by a combination of the three standard limb leads and can be calculated as follows:
ΦW CT =
ΦRA+ΦLA+ΦLL
3 (2.3)
Figure 2.10: Precordial lead positions (Adapted from [43]). R stands for resistors which are normally set to 5 K.
Figure 2.11: Frontal and horizontal planes (Adapted from [46]).
2.1.4
Premature Ventricular Contraction
Cardiovascular diseases (CVD) can be considered as one of the leading causes of death in many developed countries. According to recent reports, CVD accounted for 54.5% and 30% of all deaths in the United States [47] and in Australia [48], respectively. Car-diac arrhythmias are one of the most common CVD. They are abnormal carCar-diac rhythms caused by a disturbance in the regularity, in the frequency, or in the cardiac electrical impulse. Among the various heart abnormalities, PVC is the most common arrhythmias in humans with an estimated occurrence of 1-4% in the general population on standard 12-lead ECG and between 40-75% on routine 24- to 48-hour Holter monitoring [49].
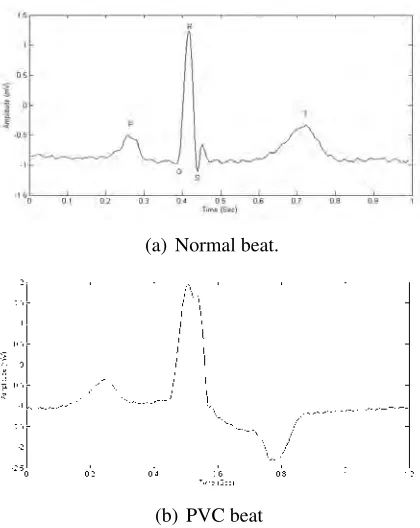
(a) Normal beat.
(b) PVC beat
Figure 2.12: Typical ECG beat:
a precursor of more severe cardiac arrhythmias such as ventricular fibrillation [8], and atrial fibrillation [9, 51]. Several studies have shown that PVCs occurred during exer-cise and recovery phases were associated with heart failure and sudden death in even adults without structural heart disease [52, 53]. Multiple frequent PVCs usually cause poor blood circulation which may lead to a temporary loss of consciousness or a dizzi-ness [54, 55]. Although PVCs are usually detected incidentally, they may manifest some symptoms such as palpitations, fatigue, shortness of breath and chest pain.
depolarisation phase (QRS complex) and repolarisation phase (mainly the T-wave). The amplitude of the QRS complex for the PVC beats is either much larger or lower than that of a normal beat. Also, there is distortion in the T-wave for the PVC beats. For assisting clinicians to diagnose PVC arrhythmias, this dissertation aims to develop a method that can identify PVCs by processing ECG signal in real-time.
2.2
Background Knowledge Related to EEG Signals
This section provides the background knowledge related to brain, neural system and EEG signals. Section 2.2.1 presents a brief overview on the anatomy of the brain and its function. The sources behind brain’s electrical activities are discussed in Section 2.2.2. Section 2.2.3 presents a description of EEG and its nature. Epilepsy and its effect on EEG are described in Section 2.2.4. Section 2.2.5 provides the information about BCI structure and its applications.
2.2.1
Human Brain: Structure and Function
The human brain is the central part of the nervous system that governs the functions of various organs in the body. The brain is separated into four major parts: cerebel-lum, brain stem, diencephalon, and cerebrum [56] as shown in Figure 2.13. A brief explanation of these parts is given below:
Figure 2.13: Schematic midsagittal view of the human brain (Adapted from [57]).
information to coordinates the body’s movements. It is also responsible for posture, vol-untary muscle movements, and balance. Damaging this brain region produces disorders in the coordination of body movement.
Thediencephalonis located deep in the brain between the cerebrum and midbrain. It consists of two main parts: hypothalamus and thalamus. The hypothalamus has several functions. It maintains homoeostasis by regulating body temperature, hunger, blood pressure, and water balance. It also regulates the pituitary gland and controls the ap-petite. On the other hand, the thalamus acts as a relay station for sensory impulses travelling to the cerebral cortex. It is involved in many functions such as the regulation of alertness, sleep, wakefulness, and consciousness.
Figure 2.14: The four major lobes of the cerebrum (Adapted from [35]).
2.2.2
Neurophysiology of Human Brain
The human body utilises its nervous system to interact with the physical world. The human nervous system is divided into two major parts: the central nervous system (CNS) and the peripheral nervous system (PNS). The CNS consists of all the nerves inside the brain and spinal cord. It is accountable for processing the information received from all parts of the body. The PNS contains all the nerves outside of CNS. It acts a communication relay connecting the CNS to the limbs and organs.
(a) anotomy
(b) electrical impulse generation
Figure 2.15: CNS nerve cells: (Adapted from [59])
the neuron which receives the electrical impulse from other nerve cells. The cell body is the heart of the cell which processes and integrates the impulse. The axon is a slender portion of the neuron that conducts the impulse to other cells.
(a) threshold limit
(b) ion exchange during generaion
Figure 2.16: Action potentials: (Adapted from [59])
surpasses the threshold conduction level for the postsynaptic neuron. The propagation of the AP along the axon involves two current flows: the active and passive currents as shown in Figure 2.15(b). The active current occurs through ion channels across the membrane while the passive current occurs inside the axon. Multiple presynaptic action potentials (from one presynaptic neuron or multiple presynaptic neurons) are almost always required for the EPSP to reach the threshold and to initiate an AP as seen in Figure 2.16(a). The membrane potential depolarises (becomes more positive) during the exchange of ions and generates a spike. The membrane repolarises after the spike and becomes more negative than the original membrane potential, known as the resting membrane potential, and then it returns to the normal.
(K+) ions. When the neuron receives the stimulus, the Na+ channels open and allow Na+ ions to move to the inside of the neuron cell membrane. Therefore, the membrane potential increases from the membrane resting potential (70 mV) up to the threshold potential (55 mV). When the threshold potential is reached, more Na+ channels (known as voltage-gated channels) open and allow more Na+ to move to the inside of the neuron membrane. This causes the membrane potential to increase to +30 mV. This process is known as depolarisation. Before reaching the peak, the Na+ channels become inactive and the K+ channels open to allow K+ ions to move to the outside of the neuron mem-brane. The membrane starts to repolarise and its potential decreases back to the rest potential. The repolarisation passes the resting membrane potential which is known as hyperpolarisation. The hyperpolarisation prevents the neuron to receive another stimu-lus which may cause another AP in the opposite direction. Therefore, the signal travels in one direction. The membrane potential then returns to its resting membrane potential. The entire process takes around 8ms.
Figure 2.17: Electrical dipole measured by EEG electrode (Adapted from [60]).
2.2.3
Electroencephalography
signal has a low amplitude that typically ranges from about 1 to 100 V in a normal adult. The EEG can vary depending on the location of the recording due to non-uniformity of brain architecture.
The international 10-20 electrode system is the conventional method for the place-ment of electrodes on the scalp. Figure 2.18 illustrates the electrodeposition of 21 elec-trodes on the brain according to the International 10-20 system. In this system, the positions of electrodes are determined based on two lines: the line from left side to right side of the skull and the line from nasion to inion points where the nasion is the point between the forehead and the nose and the inion is the lowest point of the skull at the back of the head. The 10-20 represents that the actual distances between electrodes are either 10% or 20% of the total distance of the two predefined lines. The letters F, T, C, P and O are used to refer to electrodes position on the Frontal, Temporal, Central, Parietal and Occipital, respectively. An electrode placed on the midline is labelled with z letter. Even and odd numbers refer to electrode positions on the right hemisphere and the left hemisphere, respectively. Although the international 10-20 electrode system is used to define the location of only 21 electrodes, a system with higher resolution setting can be obtained by adding more intermediate electrodes to the 10-20 electrode system. The new system is called Modified Combinatorial Nomenclature (MCN).
Since EEG measures the voltage difference between two electrodes, there are several ways for measuring the voltage difference and viewing EEG electrode which are called montages. A brief explanation of common montages is given below [62]:
Figure 2.18: The International 10-20 electrode placement system (Adapted from [61]).
Referential montage: the data in each channel represents the voltage difference
be-tween a certain electrode and a designated reference electrode. As there is no standard position for this reference electrode, it can be an electrode placed on the chin, earlobes, or nose. The electrodes placed on the midline are often considered as a reference elec-trode because they do not amplify the signal in one hemisphere versus the other.
Average reference montage: the data in each channel represents the voltage dif-ference between an active electrode and the average redif-ference which is calculated using the average of the outputs of all the electrodes.
Figure 2.19: Example of EEG rhythms in different frequency bands (Adapted from [64]).
EEG rhythms, and Table 2.1 shows the frequency range of each band and some related mental functions these bands correspond to.
2.2.4
Epilepsy and Epileptic Seizures
Table 2.1: Significance of EEG in different frequency bands.
Band Frequency (Hz) Location Mental State
Delta (δ) 0.5-4 Everywhere Deep sleep, severe brain disorder and lack of attention.
Theta (θ) 4-8 Temporal and parietal Emotional stress, cre-ative inspiration and deep meditation. Alpha (α) 8-13 Occipital lobe Eyes closed and
re-laxation;
Beta (β) 13-30 Frontal regions active thinking, active attention, focus, solv-ing problems
Gamma (γ) 30-100 Somatosensory cortex various cognitive and motor functions
Mu (µ) 8-13 Frontal (motor cortex) Suppression during motor activity
experience epilepsy at some point in their lives. Epilepsy is characterised by sponta-neously recurrent seizures [11]. Seizures are caused by rapid changes in the electrical functioning of the brain, which result in sudden behaviour changes such as jerky move-ments, temporarily loss of memory, losing consciousness and muscle spasm. These occur in the outside rim of the brain (Called the cortex).
influence on other neurons, glands, and muscles to generate human thoughts, feel-ings and actions. The normal neuronal activity pattern becomes disturbed in epilepsy. This causes strange emotions sensations and behaviours that sometimes lead to mus-cle spasms, convulsions, and loss of consciousness [67]. Epilepsy may be caused by a sudden surge of electrical activity from neurones that are inherently unstable due to a genetic defect (as in the different types of inherited epilepsy), or from neurones that are unstable by metabolic abnormalities such as very high or low blood glucose and alcohol. Moreover, the abnormal discharge can come from a localised area of the brain, such as in patients with epilepsy caused by head injury or brain tumour. During a seizure, neu-rons may fire as many as 500 times a second, much faster than the normal rate of about 80 times a second. This occasionally occurs in some people while may occur up to hundreds of times a day for others.
2.2.5
Brain-Computer Interfaces
A Brain-Computer Interface (BCI) is a system that allows to control an external device by brain activity only, without the need for any physical effort or muscle control [12]. It provides an alternative communication channel between the human brain and a com-puter [68]. Therefore, it allows a user to send messages and commands (encoded into the user’s brain activity) through a direct channel to a computer.
The BCI uses only brain activities to command a machine. An electrode cap is placed on a user’s head to measure EEG signals (users’ brain activities). Then, the user imagines different specific tasks such as movements of various body parts (hand, legs, etc.) and composing of words to command the machine. These tasks affect the EEG signals and produce different EEG patterns. Then computer classifies these patterns into different classes to control a machine (such as a wheelchair) or a computer application (e.g. cursor movement). There are two types of BCIs: invasive and non-invasive. The invasive BCIs record signals from electrodes implanted over the brain cortex (requiring surgery) while non-invasive ones record signals from electrodes placed on the scalp (outside the head) [12]. In most cases, the non-invasive technique is preferable than the invasive technique since it is harmless and easy to use.
2.2.5.1 BCI System Architecture
BCI system consists of six basic components shown in Figure 2.20. They include signal acquisition, signal pre-processing, feature extraction, classification, translation into a command and feedback [69, 70].
2 BRAIN-COMPUTER INTERFACE (BCI)
Brain–computer interfaces (BCI) are systems that aim to restore or enhance a user’s ability to interact with the environment via a computer and through the use of only thought. Such a task is achieved through a closed loop of sensing, processing and actuation. Bioelectric signals are sensed and digitized before being passed to a computer system. The computer then interprets fluctuations in the signals through an understanding of the underlying neurophysiology, in order to discern user intent from the changing signal. The final step is the actuation of this intent, in which it is translated into specific commands for a computer or robotic system to execute. The user can then receive feedback in order to adjust his or her thoughts, and then generates new and adapted signals for the BCI system to interpret. General scheme of the BCI is in figure 2.1. [11]
Fig. 2.1: Scheme of brain-computer interface
Setting the threshold has a direct influence on the accuracy and latency of the system: with low threshold the system is fast but may commit classification errors, which might be a desirable setting for a speller. On the other hand, if the threshold is high, the system will make very few errors but the response time will be long. The ideal BCI system should allow subjects to control effectors without extensive training by simply thinking about what they want the effector to do. In human subjects, such mental efforts activate neural circuits normally involved in overt motor control. For instance, cerebral cortical motor areas become active when paralyzed humans are asked to try to move body parts or to imagine that they are moving an effector [3]. The neural activity evoked during those covert volitional motor efforts has several
21
Figure 2.20: General BCI architecture (Adapted from [71]).
on different types of electrodes, various methods have been used for signal acquisi-tion. Then these signals are digitised and prepared for next step. In this thesis, EEG are utilised for measuring brain electrical activities. The recorded signals are sent to the pre-processing step for signal enhancement and noise reduction. In this step, the recorded signals are often filtered and cleaned in order to improve the relevant informa-tion embedded in the signals [72]. Feature extracinforma-tion step generates the discriminative characteristics (called features) from the brain patterns. These features represent the properties of the respective brain patterns. The classification step, also known as feature translation, tries to detect or classify certain brain states by assigning a class (associated with the type of mental states) to a set of features extracted from the signals. Once the mental state (class) is determined, BCI translates this mental state into a command (associated with this mental state) to control a given application such as a computer. Finally, some feedback is provided to the users regarding the identified mental state in order to help them to control their brain activities and increase their performances.
brain signals associated with certain events or tasks. The way a BCI user has to produce these patterns is determined by the mental strategy. The mental strategy is the foundation of any brain-computer communication. The mental strategy determines the necessary actions that have to be performed by the user to generate specific activity patterns that the BCI can interpret. The most common mental strategies are selective (focused) attention and MI [70]. BCIs based on selective attention require external stimuli. These stimuli are provided by the BCI system. On the other hand, BCIs based on motor imagery do not need any external stimuli. MI is a mental process by which a user simulates or imagine a given action without actually performing it. The BCI based on motor imagery is considered in this research.
2.2.5.2 BCI Applications
measure-ment device to evaluate users’ measure-mental states such as attention [77] or workload measure-mental fatigue [78], in order to prevent human failure in critical environments and to improve workplace conditions. BCIs have been studied in self-regulation such as emotional regu-lation [79] and controlling depression feeling [80]. BCI can also be used for gaming and entertainment [81, 82]. For instance, in the video game named BrainArena, players can play a football match by means of two BCIs (imagining left or right-hand movements).
Most of the BCI applications run on conventional computers that host a BCI system and its application. Communication or control based BCI technologies require specific brain activity patterns which can be generated by a subject and distinguished by a com-puter system. The subject needs to concentrate on a mental task (e.g. the imagination of a hand movement) to produce these specific patterns that are classified with the desired control. The user performs different mental tasks which generate different wave pattern in EEG signals. These wave patterns can be identified and translated into a control code-book for the user. In this thesis, a method is proposed to classify different mental tasks (MI tasks) for developing a communication-based BCI systems.
2.3
Review of the ECG and EEG Classification
con-tain a large amount of data, one of the main challenges is how to represent these signals for classification. It is important first to extract discriminatory information from raw ECG and EEG signals and then use this information to classify ECG and EEG signals.
The classification of ECG and EEG signals is divided into mainly two parts: feature extraction and classification. The feature extraction part aims to extracts the most impor-tant features from the signals. The classification part seeks to use the extracted features to determine the class of signals. In the feature extraction, the features are extracted to characterise the signals. These features are a smaller number of values that describe the properties of the signals. Different features could be extracted from the signals based on various classification purposes. In classification part, the extracted signal features are fed into a classifier for decision making i.e. identifying which class each signal belongs to.
In past two decades, several techniques have been developed for ECG and EEG classifications in different fields. Since the focus of this thesis is on developing methods for the classification of PVC beats, the epileptic EEG signals, and the MI-based EEG signals in BCI systems, an overview of classification methods in these three areas is provided. Section 2.3.1 reports the method used in the PVC beat classification. Section 2.3.2 reviews techniques for feature extraction and the classification in the epileptic EEG signal classification. The review of methods for the MI tasks classification is presented in Section 2.3.3.
2.3.1
PVC Beat Classification Methods
classifica-tion methods. Feature extracclassifica-tion methods include QRS complex morphology [83, 84], interbeat R-R intervals [83], filter bank [85], Hermite functions [86], wavelet trans-form [13, 14, 87], higher order cumulant features [88], Karhunen-Loeve expansion of ECG morphology [89], and correlation dimension and largest Lyapunov expo-nent [90, 91]. Several classifiers have been used for heartbeats classification including decision trees [85], nearest neighbors [92], Linear Discriminant [83], self-organizing maps [86, 93], neural networks [94, 95, 14], fuzzy neural network [13], support vector machines [96], and Optimum-path forest [97]. Some of these methods have been devel-oped for the classification between PVC and normal beats while others are develdevel-oped to identify several arrhythmias into different classes. As our proposed method for PVC beat classification is evaluated in the MIT-BIH Arrhythmia database [98] (The descrip-tion of the database is provided in Secdescrip-tion 3.2), only some of the recent methods that evaluated on this database are reviewed.
only 20 records of the MIT-BIH database, they achieved a sensitivity of 91.75% and a positive predictivity of 96.14%. A low-complexity data-adaptive approach for PVC identification based on template matching was developed by Li et al. [16]. The classifier was tested on 22 records of the MIT-BIH database, and the results were 93.1% of sen-sitivity and 81.4% of positive predictivity. In [104] authors developed a PVC detection method based on Lyapunov exponents and LVQ neural network. The algorithm achieved an accuracy of 98.90%, sensitivity of 90.26%, positive predictability of 92.31% for 20 records of the MIT-BIH database. Talbi and Ravier [105] developed a PVC classification method based on the fractional linear prediction. Using only 43 records of the MIT-BIH database, they evaluated several classifiers and achieved the maximum accuracy of 96% for Neural network trained by LevenbergMarquardt rule classifier with a Specificity of 98% and a sensitivity of 74%.
2.3.2
Epileptic Classification Methods
The key challenge of any automated epileptic seizure detection method is the extraction of the distinguishing features from EEG signals as it significantly affects the perfor-mance of the classifier. Representative characteristics or features extracted from EEG data can describe the key properties or morphologies of the signals for perfect detection of epileptic seizure [106]. In past two decades, a variety of methods has been developed for feature extraction in epileptic EEG data. These feature extraction techniques can be divided into four groups [107]: time domain, frequency domain, timefrequency domain andnonlinear methods.
The simplest features are extracted in the time domain. Three popular time do-main methods are PCA, independent component analyses (ICA) and linear discriminant analysis (LDA). PCA is an unsupervised method that transforms high-dimensional data into a low-dimensional feature subspace. In epileptic EEG signals classification, PCA can be used for feature enhancement [108] and feature reduction [109, 110]. Xie and Krishnan [111] developed an efficient feature extraction based on dynamic PCA with nonoverlapping moving window to separate EEGs from interictal and ictal for seizure detection. ICA is a feature extraction method that transforms a multivariate random signal into a signal with independent components [109]. It also can be utilised to re-move artefacts and to separate brain signals sources from EEG signals [112]. LDA is another method for dimension reduction. It finds a linear combination of features that can serve as a classifier to separate two or more classes [107]. Subasi and Gursoy [109] employed all three methods: PCA, ICA, and LDA and compared the effectiveness of them in epileptic EEG classification.
dis-tributions of a signal across the frequency. These methods can be divided into two categories [107]: the non-parametric methods which calculate spectra directly from sig-nals by using Fourier Transform (FT) method, and the parametric methods which derive spectral quantities from a statistical model of the signals. The periodogram and the cor-relogram are two common non-parametric methods. These methods can provide high resolution for adequately long data lengths. However, they suffer from spectral leakage effects and poor frequency resolution due to the use of windows and the finite length of data [17]. These limitations are overcome by the parametric method. Three parametric models are: the moving average (MA) model which is suitable for modelling spectra with broad peaks and sharp nulls, the autoregressive (AR) model which is suitable for modelling spectra with narrow peaks, and the autoregressive moving average (ARMA) model which is suitable for modelling spectra with both sharp peaks and deep nulls [17]. Polat and Gunes [113] used spectral parameters based on the Fourier transformation of EEG signals to detect epileptic seizures in EEG signals. ¨Ubeyli [114] classified nor-mal and ictal EEG time series using the AR method for feature extraction. Srinivasan et al. [115] proposed a two-class epilepsy detection methods based on EEG features extracted in bothtime domainandfrequency domain.
Decompo-sition (WPD), and Continuous Wavelet Transform (CWT) are the three types of wavelet transforms [107]. Among these methods, the DWT stands out in terms of efficiency and algorithmic elegance [126]. Lee et al. [127] used features based on the Euclidian dis-tance calculated from phase space representation (PSR) of wavelet coefficient to detect normal and epileptic seizure EEG signals. Pachori and Patidar [128] proposed a method for classification of ictal and seizure-free EEG signals using the 95% confidence ellipse area measured from the second-order difference plot (SODP) of intrinsic mode func-tions (IMFs) as a feature. Samiee et al. [129] proposed a feature extraction technique based on a rational discrete short-time Fourier transform for classification of normal and epileptic segments.
activity [19]. The FD parameter has been used effectively to discriminate the chaotic nature of EEG signals in interictal and ictal activities [136]. Acharya et al. [130] used the CD, H, and ApEn parameters for the automated detection of epilepsy. The value of ApEn has been found to show a strong connection with the synchronous discharge of large groups of neurons during seizure [139]. Acharya [142] used the RQA features for classification of the normal, interictal, and ictal EEG signals.
Once features are extracted from EEG signals, a classifier is employed to dif-ferentiate between normal and epileptic EEG. In past two decades, many classifi-cation methods have been used for seizure detection such as artificial neural net-works (ANNs) [144, 141], multilayer perceptron neural network (MLPNN) [144], re-current neural networks (RNNs) [135], Fuzzy Sugeno Classifier (FSC) [138, 145], SVM [146, 132, 147, 109], LS-SVM [148, 149], Gaussian mixture model (GMM) [130, 110], DT [123, 150],k-NN [151, 152], Mixture expert model [119], RF [20].
2.3.3
MI Signal Classification Methods in the BCI
used in [154] as features to discriminate right and left imagery movements. The Band Powers were also used in [171, 172] for the classification of mental tasks. The fea-ture extraction method based on AR model and Bayesian logistic regression model has been developed in [155] to classify motor imagery tasks. Tavakolian et al. [173] used AAR model parameters with five different machine learning techniques for clas-sification of mental tasks. Many researchers have used the PSD as features in BCI systems [174, 175, 176, 30]. Lachaux et al. [168] proposed the PLV which is the com-monly used feature extracted from phase information. A number of researchers have attempted to use PLV in BCI systems [167, 177, 160]. The combination of phase in-formation and conventional features such as BP and AR-based features have been used in [177] for the classification of motor imagery tasks. Krusienski et al. [160] used the phase information with other spectral features extraction by the Fast Fourier Transform or Magnitude-Squared Coherence to control cursor movement. Authors in [178, 6, 179] used the CSP to discriminate the spatial patterns for two classes of motor imagery in EEG-based BCIs.
is robust to dimensionality due to regularisation, which means a large training set is not required for good results, even with very high dimensional feature vectors [187]. This advantage is gained at the expense of a low speed of execution [181].
Neural Networks (NN)are non-linear classifiers that have been broadly used in BCI research [188, 181]. The most widely used NN for BCI is the MLP which has been ap-plied to mental task classification [189, 171, 190] and motor imagery [191]. As the MLP is universal approximators, it is sensitive to overtraining, especially with such noisy and nonstationary data as EEGs [192]. Therefore, careful architecture selection and reg-ularisation is required [193]. Besides MLP, different types of ANN architecture have been used in the design of BCI systems such as Gaussian classifier [189], Probabilistic Neural Networks [194, 195], Probability estimating Guarded Neural Classifiers [196], RBF Neural Network [197], Fuzzy ARTMAP Neural Networks [198], Finite Impulse Response Neural Networks (FIRNN) [199], and Bayesian Logistic Regression Neural Network [155]. The performance of MLP Neural Network with Driven Pattern Repli-cation (MLP-DPR), Probabilistic Neural Network Delta band (PNN-DB), Hierarchical Model (HM), and Modular Multi-net system (MMN) have been studied in [200] to se-lect the best classifier to control a mobile robot. The HM with statistical implementation achieved the best result with an accuracy of 91%.
systems; k Nearest Neighbour (kNN) and Mahalanobis Distance [180, 181]. KNN as-sign an unseen point to the dominant class among its k nearest neighbours inside the training set. These nearest neighbours are obtained using a metric distance as Euclidean distance [203]. KNN algorithms are not widespread in BCI applications due to being very sensitive to the curse-of-dimensionality [180], which made them fail in several BCI experiments [204]. However, they prove to be efficient In BCI system with low-dimensional feature vectors [205]. Mahalanobis Distance classifier is a simple yet robust classifier with good performances [204, 206, 207]. However, it has been hardly used in the BCI system [180, 181].
CHAPTER 3
EFFECTIVE AND EFFICIENT DETECTION OF PREMATURE
VENTRICULAR CONTRACTIONS BASED ON VARIATION OF PRINCIPAL
DIRECTIONS
The classification of ECG data stream is essential to diagnosis of critical heart condi-tions. It is vital to accurately detect abnormality in the ECG in order to prevent possible beginning of life-threatening cardiac symptoms. This chapter focuses on identifying PVC which is one of the most common heart rhythm abnormalities. A “Replacing” strategy is used to check the effects of each individual heartbeat on the variation of prin-cipal directions. Based on this idea, an online PVC detection method is proposed to classify the new arriving PVC beats in the real-time and online manner. The proposed approach is tested on the MIT-BIH arrhythmia database (MIT-BIH-AR). These results show that the proposed method is effective in terms of computation time and is capable of accurately classify PVCs in an online manner.
3.1
Introduction
The ECG is the non-invasive method used to detect heart disease. It reflects the electrical activity of the heart over time and provides information about the state of the heart. The ECG is commonly used to detect cardiac rhythm abnormalities also known as arrhyth-mias. Arrhythmias can be divided into two groups. The first group is life-threatening and require immediate treatment with a defibrillator such as ventricular fibrillation and tachycardia. The second group is not imminently life-threatening but may require treat-ment to prevent further problems such as premature ventricular contractions (PVCs).
to its ability to meet the growing clinical needs for personal healthcare and remote mon-itoring, etc. [215]. Its aim is to help clinicians to diagnose critical cardiac conditions by processing ECG signal in real-time. PVCs are premature heartbeats originating from the ventricles of the heart. They are one of the most common heart rhythm abnormalities which can be linked to mortality associated with myocardial infarction [7]. Therefore, their immediate detection and treatment is essential to prevent possible beginning of life-threatening cardiac conditions.
Many methods for automatic classification of various arrhythmias have been devel-oped based on different features extraction and classification methods. Features methods include ECG morphology [216, 1], heartbeat interval features [89, 14], frequency-based features [88, 14], higher order cumulant features [217], Karhunen-Loeve expansion of ECG morphology [89], and hermite polynomials [86]. Several classifiers have been used for heartbeats classification including linear discriminants [89, 218], artificial neu-ral networks [13, 14, 15], and self-organizing networks [86]. Although these methods accurately identify PVCs, they have long computational time. Therefore, due to high complexity of their algorithms, they are not suitable for portable ambulatory ECG de-vices where the computation resources to process ECG in real-time is limited. In addi-tion, some of existing high detection results are based on small data sets or used over-lapped training and testing data sets. For example, wavelet feature extraction in tandem with fuzzy neural network classification was used in [13] to classify PVC beat with 97.04% accuracy. However the method was tested on only seven files of the MIT/BIH arrhythmia database [219].
![Figure 2.1: Basic heart anatomy schema (Adapted from [35]).](https://thumb-us.123doks.com/thumbv2/123dok_us/7926673.1316117/25.612.197.448.82.290/figure-basic-heart-anatomy-schema-adapted.webp)
![Figure 2.2: The AV plane and the four valves view from above with the atria andmajor vessels removed (Adapted from [36]).](https://thumb-us.123doks.com/thumbv2/123dok_us/7926673.1316117/26.612.198.450.76.293/figure-plane-valves-atria-andmajor-vessels-removed-adapted.webp)
![Figure 2.3: The conduction system of the heart (Adapted from [35]).](https://thumb-us.123doks.com/thumbv2/123dok_us/7926673.1316117/28.612.238.410.80.312/figure-conduction-heart-adapted.webp)
![Figure 2.5: The cardiac action potential for each of the specialised cells found inthe heart (Adapted from [35]).](https://thumb-us.123doks.com/thumbv2/123dok_us/7926673.1316117/30.612.183.462.80.331/figure-cardiac-action-potential-specialised-cells-inthe-adapted.webp)
![Figure 2.7: Standard 12-lead ECG placement (Adapted from [43]).](https://thumb-us.123doks.com/thumbv2/123dok_us/7926673.1316117/32.612.213.442.85.328/figure-standard-lead-ecg-placement-adapted.webp)
![Figure 2.9: Augmented lead positions and connections (Adapted from [43]). Rstands for resistors which are usually set to 5 K.](https://thumb-us.123doks.com/thumbv2/123dok_us/7926673.1316117/34.612.239.417.75.262/figure-augmented-positions-connections-adapted-rstands-resistors-usually.webp)
![Figure 2.10: Precordial lead positions (Adapted from [43]). R stands for resistorswhich are normally set to 5 K.](https://thumb-us.123doks.com/thumbv2/123dok_us/7926673.1316117/35.612.233.404.204.428/figure-precordial-lead-positions-adapted-stands-resistorswhich-normally.webp)
![Figure 2.13: Schematic midsagittal view of the human brain (Adapted from [57]).](https://thumb-us.123doks.com/thumbv2/123dok_us/7926673.1316117/39.612.143.498.94.351/figure-schematic-midsagittal-view-human-brain-adapted.webp)
![Figure 2.14: The four major lobes of the cerebrum (Adapted from [35]).](https://thumb-us.123doks.com/thumbv2/123dok_us/7926673.1316117/41.612.174.473.92.352/figure-major-lobes-cerebrum-adapted.webp)
