Could I have the Menu Please? An Eye
Tracking Study of Design Conventions
John D McCarthy, M Angela Sasse &
Jens Riegelsberger
Department of Computer Science, University College London,
Gower Street, London WC1E 6BT, UK
Tel:
+44 20 7679 3644
Email: {j.mccarthy, a.sasse, j.riegelsberger}@cs.ucl.ac.uk
Existing Web design guidelines give conflicting advice on the best position for the navigation menu. One set of guidelines is based on user expectation of layout, the other on results from user testing with alternative layouts. To resolve this conflict we test whether placing the menu in an unexpected position has a negative impact on search performance. The results show that users rapidly adapt to an unexpected screen layout. We conclude that designers should not be inhibited in applying design recommendations that violate layout conventions as long as consistency is maintained within a site.
Keywords: Web design, design guidelines, information architecture, visual
scanning, eye movements, eye tracking.
1
Introduction
A problem facing users in a wide variety of interfaces is locating the right option to achieve their goal. This problem is especially acute on Web interfaces, where users are presented with a large number of simultaneous choices. The user’s task can be simplified by designing Web sites that conform to conventions or expectations. For example, Nielsen [1999] shows that success rate for product search is 80% when menu labels conformed to expectations. This drops to 9% with unfamiliar menu labels. From this finding and others Nielsen develops ‘Jacob’s Law of Web user experience’:
Conventions play an important role in Web design guidelines. For example, the IBM design guidelines [IBM 2003] suggest that persistent navigation links should be placed on the left or top of the page ‘because these are the areas users expect to find them’. But is expectation alone justification for a design guideline? The National Cancer Institute Guidelines [NCI 2002] give different advice. These suggest that the navigation menu should be placed on the right of the page. From a study of extended use of a portal they observed that users clicked on topics much more efficiently with a right-justified menu, as it was located close to the scroll bar. The advantages observed were even more pronounced on laptop computers [Bailey et al. 2000].
But if user testing shows better performance and greater user satisfaction with right-justified menus, why are they not more widespread? If guidelines are based on
current conventions, how can new interfaces be introduced? TheQWERTYkeyboard
is just one example where culturally endemic expectations are non-optimal in terms of task performance, user satisfaction and user cost [Shneiderman 1998, pp.307-15]. Clearly, user expectation needs to be challenged if interfaces are to change. But what exactly is the impact of placing the menu in an unexpected location?
In this paper, we investigate the impact of challenging user expectations by
measuring search performance with the menu in three different locations. To
examine in detail where people look, we utilize eye tracking to measure their search process as it proceeds.
2
Background
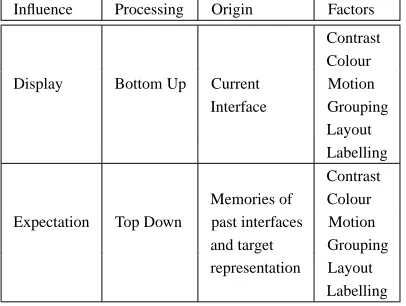
Patterns of searching Web interfaces are governed by both the display and the expectations of the user. The display exerts a bottom-up influence. Expectations exert a top-down influence. Careful manipulation of static display factors such as layering, separation, colours and contrast can draw the eye to important pieces of information and reduce competition between display elements [Tufte 1990]. Motion or animation is also an effective cue to capture attention [Hillstrom & Yantis 1994]. Rensink [2000] claims two types of information can be extracted from bottom-up processing without attention. One is the abstract meaning or ‘gist’ of the scene. ‘Gist’ would distinguish the particular type of interface facing the user, e.g. Web Page, Word Processor, Spreadsheet. The other type of information is the spatial arrangement or layout of objects in the scene. This representation is vital to integrate information from individual eye fixations into a structure capable of directing subsequent eye movements.
Influence Processing Origin Factors
Contrast Colour Display Bottom Up Current Motion
Interface Grouping Layout Labelling Contrast Memories of Colour Expectation Top Down past interfaces Motion
and target Grouping representation Layout
Labelling
Table 1: Factors governing search behaviour.
Bernhard [2001] found that most users expected the navigation menu to be found on the left of the screen. Such expectations are top-down factors based on memories of ‘what is where’ from previous interactions and are a defining feature of a convention. These two processes, top-down and bottom-up, exert an influence on search behaviour (see Table 1). An important interaction between them results in what has been described as information scent [Pirolli 1997]. Scent is perceived when
the proximal cues (bottom-up) provided by page elements such as such asWWW
links, graphics, icons or menu items are evaluated relative to the current goals (top-down). This gives an indication of the value, cost, and location of the distal content on the linked page. Thus, information scent is a basis for selection, but it cannot be perceived unless an element is actually looked at. It therefore cannot guide the visual search process itself. To understand the factors that influence search behaviour we need to examine the eye movements of the user.
3
Eye Tracking Usability Studies
On the empirical side, there is surprisingly little published research on how people actually do conduct search within a Web page. Perhaps the best-known eye tracking study of Web use is the Stanford-Poynter study [Lewenstein et al. 2000]. This examined how users read news articles online and measured where users looked on a page in the first three glances. Their results show that users’ attention was drawn to text over graphics and photos, and run against findings from traditional print media which suggests that users are attracted to photo elements first [Kroeber-Riel 1996].
In an excellent review article, Jacob & Karn [in press] summarize 21 usability studies since 1950 incorporating eye-tracking. The earliest study, by Fitts et al. [1950], used cine cameras to study the eye movements of pilots landing planes. Of the studies conducted since, only 3 explicitly examine search of Web pages.
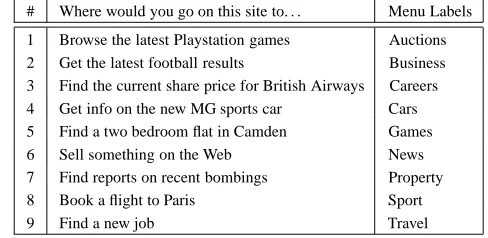
# Where would you go on this site to. . . Menu Labels
1 Browse the latest Playstation games Auctions 2 Get the latest football results Business 3 Find the current share price for British Airways Careers 4 Get info on the new MG sports car Cars 5 Find a two bedroom flat in Camden Games 6 Sell something on the Web News 7 Find reports on recent bombings Property 8 Book a flight to Paris Sport
9 Find a new job Travel
Table 2: Search tasks given to users and menu labels on the sites.
with both a standard task performance measure (time) and the number of fixations. Other work has shown that the number of fixations is strongly correlated with task duration, and this measure has been used as a proxy for measures of task performance [Goldberg & Kotval 1998].
Ellis et al. [1998] examined search for textual information on a page layout with a two-column, graphic-text block design. Performance was compared to three alternate designs, one with more hyperlinks, a second with text descriptions instead of pictures, and a third with a ‘book-like layout’ containing no graphics and text across the width of the page. Their results show that the ‘book-like’ layout led to faster and more efficient processing of information on the page although it was liked the least by users.
Goldberg et al. [2002] used eye tracking to examine a Web search conducted across several screens of Web portal application. They found little evidence of a change in strategy across different screens and a bias towards horizontal search of screens (across columns) rather than vertical search (within a column). They also found evidence that strong information scent heading labels were largely ignored in the search process. The Goldberg et al. [2002] result illustrates that information scent based on label identity is not actually a driver for eye behaviour.
4
Menu Study
To investigate the impact of top-down and bottom-up factors on search, we examined performance on 9 different search tasks across different sites (see Table 2). On all tasks, the task target was an option on the navigation menu. The menus labels were identical across all site variations and were derived from the most frequent menu options found across the top 5 UK Internet Service Providers (ISPs). Menu labels where ordered alphabetically (see Table 2). Each participant was given nine tasks, each one relating to an option available on the menu.
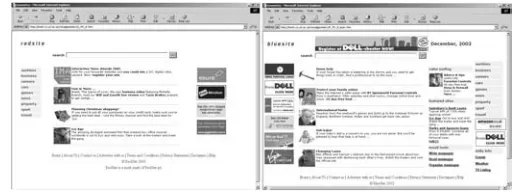
Figure 1: Screen shots of Simple and Complex sites with different menu positions.
search would be driven by expectation about where the menu would be located. As users expect the menu to be located on the left of the screen [Bernhard 2001], we predicted that performance would be better for menus located in this position.
H1: Search performance is better with left navigation menus.
To examine the influence of bottom-up factors, we manipulated the number of screen objects that would compete for users’ attention. Two types of site were used — Simple and Complex. Simple Sites had only four content areas and four banner ads (see Figure 1). Complex Sites had 9 content areas and 9 Banner Ads (see Figure 1). We predicted that search performance would be better on the simple sites, as there would be less competition for attention from other screen elements.
H2: Search performance is better on simple sites.
4.1
Method
4.1.1
Participants
We used an eye tracking system that does not require head restraint. This meant that when participants changed their body posture too quickly or moved out of the tracking field, data was lost. To ensure high-quality data, we excluded from
the analysis any participant who was tracked less than 90% of the time. This
strict criterion left 31 subjects with tracking rates of 90% or greater. Of these 31 participants, 17 were male and 14 female. The mean age of the participants was 22 years. All participants were experienced Web users who used the Internet at least 3 hours/day. Participants were paid £5 Sterling.
4.1.2
Stimuli and Equipment
The template for the interfaces presented to participants was based on the design of a large Internet Service Provider (ISP) in the UK. Content and ads for the site were
taken directly from theISP homepage. Eye movements were measured using the
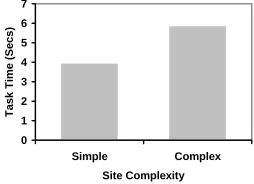
0 1 2 3 4 5 6 7
Simple Complex
Site Complexity
Task Time (Secs
)
Figure 2: Task performance on simple and complex sites.
used the EyeBrowse1software to display stimulus pages and to define functionally
distinct areas that could be analysed separately, called regions of interest.
4.1.3
Design
All participants performed 9 tasks in total, three tasks on each of three types of sites. All tasks involved finding a target on the navigation menu. The three types of site had a navigation menu on the left, right or top of the page. The effects of presentation order were counterbalanced between-subjects using presentation sequences based on
a Latin squares design. The experimental design was a 233 mixed design. The
between-subject variable was Site Complexity — Simple vs. Complex. Within subject variables were Menu Position — Left, Right and Top, and Page Visit — First, Second and Third.
4.1.4
Procedure
Participants were briefed about the nature of the experiment and the measures that were going to be taken. The eye tracker was then calibrated to the participant’s eye movements. They were then presented with an alternation of instruction and test screens. Instruction screens provided participants with the current goal — e.g. “Where would you go on this site to search for something on the Internet?”. They were then presented with the page on which to complete the task. All participants received a single practice trial.
4.2
Results
4.2.1
Task Completion Time
To examine differences in task performance, we conducted an ANOVA on
task completion times. The raw scores were transformed using a natural log
transformation to approximate a normal distribution. The reported results are
transformed back into seconds to simplify interpretation.
TheANOVArevealed three findings of interest. Firstly, there was a significant
difference between Simple and Complex sites (see Figure 2), with participants taking almost 50% longer to complete the search task on the complex site, F(1,29) = 7.33,
1EyeBrowse is Open Source software developed as part of this research project. Please contact
0 1 2 3 4 5 6 7 8
Left Right Top
Menu Position
Task Time (Secs
)
First Page Visit Second Page Visit
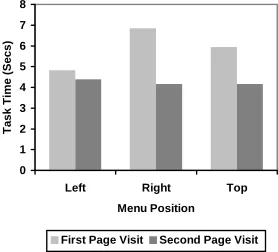
Figure 3: The effects of expectation on the first page visit.
0 1 2 3 4 5 6 7
1st 2nd 3rd
Page Visit
T
ask Time (Sec
s)
Figure 4: Decrease in task time after first page visit.
p < 0.05. This supports H2 — that search performance is better on simple sites — and shows how bottom-up display factors influence search performance.
The effect of Menu Position was not significant, F(2,58) = 1.31, n.s. In
other words, averaging across tasks and site complexity, there was no evidence that performance was better when the menu is placed in the expected position on the left. This result suggests that expectation of where the menu is placed does not affect task performance. However, closer examination of the results revealed an interaction between Menu Position and Page Visit. Specifically, on the first page visit, performance is indeed better with a left navigation menu than with a right menu, F(1,29) = 6.26, p < 0.05 (see Figure 3). However, this difference disappears on the second page visit.
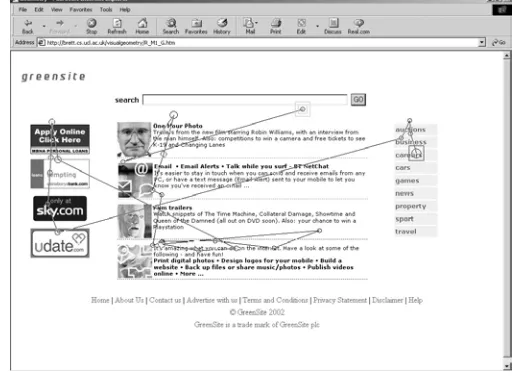
Figure 5: An example scan path from a search task.
Visit (See Figure 4) — showing a significant decrease in task completion time after the first page visit, F(2,58) = 8.75, p < 0.05. No other effects or interactions where significant.
4.2.2
Where do People Look?
To examine where people look when searching, we used location information from the eye tracker. Figure 5 illustrates a sample trace from one of the participants. The search scan path starts just below the search box and terminates on the right menu bar. The circles on the scan path in Figure 5 represent fixations — the larger the circle the longer the fixation.
According to Fitts et al. [1950], frequency and duration of eye movements should be treated as separate metrics, with duration reflecting difficulty of information extraction and frequency reflecting the importance of that area of the display. As we were primarily interested in the importance or attraction of different screen positions, we adopted a frequency measure. Our basic unit of analysis is glance frequency where a glance is defined as one or more successive fixations to the same screen object. Seven types of screen object where identified as the basis for this analysis. The categorization scheme for objects was a hybrid of the schemes used by Nielsen & Tahir [2002] and Krug [2000] to classify screen objects
on Web pages. The objects were — Logo, Search Box, Menu, Content
Text,Content Picture,Ad,Quick Links(Complex Site only) andPage
Footer.
0 0.1 0.2 0.3 0.4 0.5 0.6 0.7 0.8 0.9 1
0 10 20 30 40 50 60 70 80
Number of Glances
P
roportion of Searches Completed
.
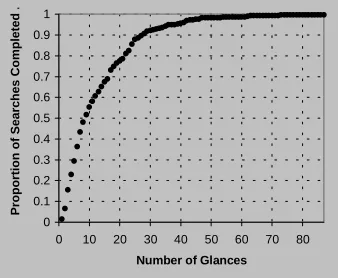
Figure 6: Proportion of searches completed by glance number.
20 %
18 %
1 %
48% 13 %
Figure 7: Glance distribution across all site variations.
we have fewer data points (i.e. a smaller sample size) to estimate the probability of glancing at different screen regions. Consequently, the subsequent analysis is restricted to the first 23 glances to ensure a reasonable sample size (> 50).
To give an indication of the spatial distribution of search, we categorized screen objects according to their position on the screen. Figure 7 shows the distribution of gaze to the Top, Left, Middle, Right and Bottom screen. Across all sites and tasks, there were very few glances to the bottom region of the screen (~1%), and although task targets where always to be found either top, left or right — these screen regions do not receive the most glances. Somewhat surprisingly, the eye tracking data shows that people focus the bulk of their search in the middle content area.
To examine how search proceeds through time we calculated the Attraction (A) of each screen area, where:
A
Simple Site 0 0.1 0.2 0.3 0.4 0.5 0.6 0.7
0 5 10 15 20 25
Glance Number
P
roportion of Glance
s
Middle Top Left Right
Complex Site 0 0.1 0.2 0.3 0.4 0.5 0.6 0.7
0 5 10 15 20 25
Glance Number
P
roportion of Glance
s
Middle Top Left Right
Figure 8: Attraction of screen regions on Simple and Complex sites.
Left Menu - First Page Visit
0 0.1 0.2 0.3 0.4 0.5 0.6 0.7
0 5 10 15 20 25
Glance Number
P
roportion of Glance
s
Middle Top Left Right
Left Menu - Second Page Visit
0 0.1 0.2 0.3 0.4 0.5 0.6 0.7
0 5 10 15 20 25
Glance Number
P
roportion of Glance
s
Middle Top Left Right
Figure 9: Attraction of areas on sites with a LEFT navigation menu.
A measures the proportion of glances made to a screen region and varies
between 1 and 02. Figure 8 shows the attraction measures for Simple and Complex
Web sites throughout the search sequence. Most striking about this figure is the similarity in search patterns. Although on the task performance measure there are clear differences in search time with Simple and Complex sites, the eye tracking data shows that although search is slower on the Complex site, the search process is the same. Therefore the difference in speed is not driven by a difference in strategy.
Figures 9–11 show the changes in search strategy for sites with Left, Right and Top menus across the First and Second page visits. Across all variations the middle (content) region of the page attracts the most glances. On the first page visit, the left menu sites receive a surprisingly small proportion of glances on the left hand side of the page, with most glances being directed to the middle and top of the page. The immediate response of the subjects is to search the middle of the page for the target. By the second page view, however, the strategy has changed, with more glances earlier on to the left region of the page. (See Figure 9.)
2Previous work has used a binary measure of attraction to indicate whether a region is glanced at
or not [Riegelsberger et al. 2002]. This is simply a transformation of the continuous measure used here where:
attraction
Right Menu - First Page Visit 0 0.1 0.2 0.3 0.4 0.5 0.6 0.7
0 5 10 15 20 25
Glance Number
P
roportion of Glance
s
Middle Top Left Right
Right Menu - Second Page Visit
0 0.1 0.2 0.3 0.4 0.5 0.6 0.7
0 5 10 15 20 25
Glance Number
P
roportion of Glance
s
Middle Top Left Right
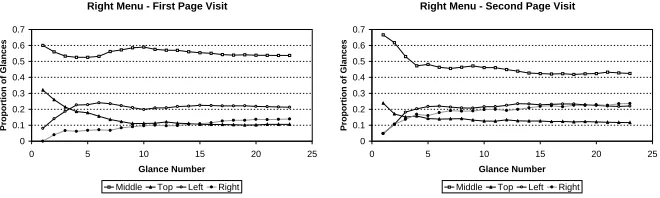
Figure 10: Attraction of areas on sites with a RIGHT navigation menu.
Top Menu - First Page Visit
0 0.1 0.2 0.3 0.4 0.5 0.6 0.7
0 5 10 15 20 25
Glance Number
P
roportion of Glance
s
Middle Top Left Right
Top Menu - Second Page Visit
0 0.1 0.2 0.3 0.4 0.5 0.6 0.7
0 5 10 15 20 25
Glance Number
P
roportion of Glance
s
Middle Top Left Right
Figure 11: Attraction of areas on sites with a TOP navigation menu.
For sites with the navigation menu on the right, there is a large proportion of glances on the left hand side on the first page visit — particularly in the first ten glances (see Figure 10). This is interpreted as the search for the left menu driven by a mismatch with expectation. By the second page visit, the proportion of glances to the right has doubled, although there are still a significant number to the left hand side. On sites with the right-justified menu, the left side the page only contains banner ads — yet the fact that participants are glancing at these on the second visit — does not appear to affect task completion times (see Figure 3)
Results on sites with a Top navigation menu show a similar adaptation across Page Visit, although the change in search pattern is much more pronounced (see Figure 11). By the second page view, the top region of the page is attracting more glances than the middle region in the search for the target.
5
Discussion
On the measure of task performance, we found that sites that conform to expectations do indeed lead to faster search times, but this advantage is short-lived. The second time a site is visited, search times are equivalent irrespective of menu position. This shows that violating the expectation or convention of the left menu bar has little long-term effect on task performance.
available to the user while keeping the complexity low enough that they can still find what they are looking for. While a detailed evaluation of this issue would require another study, the present results support the design heuristic for search — simple is better.
The eye tracking measures give an extra dimension to the results above and beyond task time. Where differences in task time where found between Simple and Complex sites, there were no differences in search strategy revealed in the eye behaviour. By contrast, on the second page visit, the task performance measures show no significant differences between different sites, yet analysis of the eye data shows marked differences in search strategy — clearly mirroring changes in the
interface. From this data we find clear evidence of expectation driving search
behaviour with first impressions of a site. The data also gives insight into the rapid adaptation to the unexpected layout as new tasks are performed. This could not be seen from measures of task time alone.
6
Conclusions
The results show that violating expectation of menu position on Web pages has little long-term impact on task performance when searching a single page. The user quickly adapts to designs violating layout conventions. This should encourage design practitioners to take on board findings that menus on the right, close to the scroll bar, are better when searching across several pages [Bailey et al. 2000]. On this particular design feature, it is the internal consistency of a site that is important, rather than consistency with other Web sites. Practitioners should not be inhibited from applying guidelines based on evidence because of deviation from the standard. Although the present investigation is limited to search of Web pages, the methodology can be applied to wide range of use cases with different tasks and interfaces. For researchers, the study demonstrates the value that eye movement studies add to evaluation methodologies. The eye data provides a detailed picture of where people look, when, and is sensitive to interface changes where task completion time is not. This level of detail can only benefit the design and development of future tools by challenging the assumptions implicit in craft design approaches. The most surprising result of the current study for us was the bias toward searching the middle of the screen. As the task is a search task, our ‘folk’ assumption was that people would look to the navigation menus first. The data obtained from eye tracking does not support this belief. Eye tracking allows researchers to evaluate and test beliefs implicit in the design process so that future developments proceed on a firm empirical foundation.
Acknowledgement
The research was funded by BT as part of the HIGHERVIEW Project
http://www.cs.ucl.ac.uk/research/higherview/
References
Bernhard, M. L. [2001], Developing Schemas for the Location of Common Web Objects, in
Proceedings of the Human Factors and Ergonomics Society 45th Annual Meeting, Human
Factors and Ergonomics Society, pp.1161–5.
Cowen, L. [2001], An Eye Movement Analysis of Web Page Usability, MRes Thesis, Department of Psychology, Lancaster University.
Ellis, S., Candrea, R., Misner, J., Craig, S., Lankford, C. & Hutchinson, T. [1998], Windows to the Soul? What Eye Movements Tell Us about Software Usability, in ***EDITOR*** (ed.), Proceedings of the Usability Professionals’ Association 7th Annual Conference, Usability Professionals’ Association, pp.151–6.
Fitts, P. M., Jones, R. E. & Milton, J. L. [1950], Eye Movements of Aircraft Pilots during Instrument-landing Approaches, Aeronautical Engineering Review 9(2), 24–29.
Goldberg, J. H. & Kotval, X. P. [1998], Eye Movement-based Evaluation of the Computer Interface, in S. K. Kumar (ed.), Advances in Occupational Ergonomics and Safety, IOS Press, pp.529–32.
Goldberg, J. H., Stimson, M. J., Lewenstein, M., Scott, N. & Wichansky, A. M. [2002], Eye Tracking in Web Search Tasks: Design Implications, in A. T. Duchowski, R. Vertegaal & J. W. Senders (eds.), Proceedings of the ETRA 2002 Symposium, ACM Press, pp.51–8.
Hillstrom, A. P. & Yantis, S. [1994], Visual Motion and Attentional Capture, Perception &
Psychophysics 55(4), 399–411.
IBM [2003], Web Design Guidelines, http://www-3.ibm.com/ibm/easy/eou_ext.nsf/
Publish/572 (last accessed 2003.05.26).
Jacob, R. J. K. & Karn, K. S. [in press], Eye Tracking in Human–Computer Interaction and Usability Research: Ready to Deliver the Promises (Section Commentary), in J. Hyona, R. Radach & H. Deubel (eds.), The Mind’s Eyes: Cognitive and Applied Aspects of Eye
Movements, Elsevier Science.
Kroeber-Riel, W. [1996], Bildkommunikation: Imagerysysteme für die Werbung, Vahlen.
Krug, S. [2000], Don’t Make Me Think: A Common Sense Approach to Web Usability, New Rider Publishing.
Lewenstein, M., Edwards, G., Tatr, D. & DeVigal, A. [2000], The Stanford Poynter Project, http://www.poynter.org/eyetrack2000/ (last accessed 2003.05.26).
NCI [2002], Research Based Web Design and Usability Guidelines,
http://usability.gov/guidelines/ (last accessed 2003.05.26).
Nielsen, J. [1999], Do Interface Standards Stifle Design Creativity?, Jakob Nielsen’s
Alertbox, August 22. http://www.useit.com/alertbox/990822.html (last accessed
2003.05.26).
Nielsen, J. & Tahir, M. [2002], Hompage Usability — 50 Web sites Deconstructed, New Rider Publishing.
Pirolli, P. [1997], Computational Models of Information Scent-following in A Very Large Browsable Text Collection, in S. Pemberton (ed.), Proceedings of the CHI’97 Conference on
Rensink, R. A. [2000], Seeing, Sensing, and Scrutinizing, Vision Research 40(10-2), 1468– 87.
Riegelsberger, J., Sasse, M. A. & McCarthy, J. D. [2002], Eye-catcher or Blind Spot? The Effect of Photographs of Faces on E-commerce Sites, in J. L. Monteiro, P. M. C. Swatman & L. V. Tavares (eds.), Proceedings of the 2nd IFIP Conference on E-commerce, E-business,
E-government (i3e), Kluwer, pp.383–98.
Shneiderman, B. [1998], Designing the User Interface: Strategies for Effective Human–
Computer Interaction, third edition, Addison–Wesley.
Treisman, A. & Gelade, G. [1980], A Feature Integration Theory of Attention, Cognitive
Psychology 12(1), 97–136.
Author Index
McCarthy, John D, 1
Riegelsberger, Jens, 1
Keyword Index
design guidelines, 1
eye movements, 1 eye tracking, 1
information architecture, 1
visual scanning, 1