`
Available online: https://edupediapublications.org/journals/index.php/IJR/ P a g e | 1513
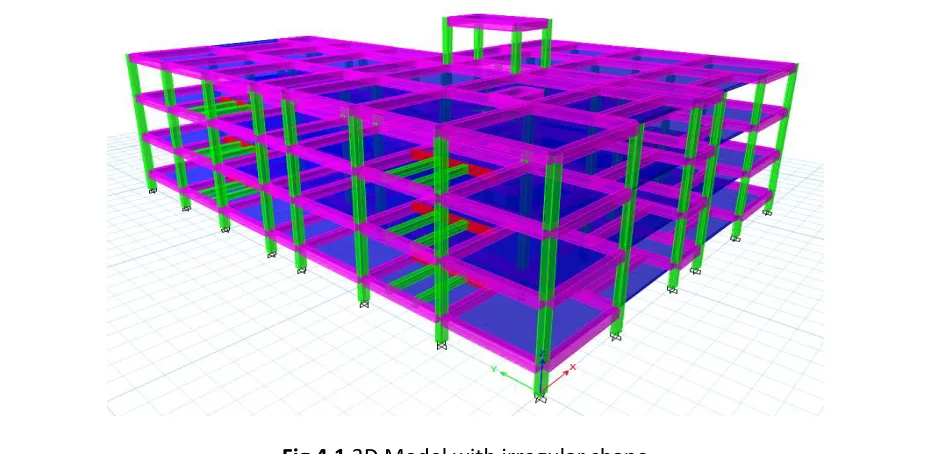
Dynamic Analysis and Design of RCC Framed Irregular
Structure” Using ETABS & RCDC.
D.SIVA SEKHAR, Mrs. V. BHARGAVI M.E. Ph.D.
1 Student,Dept of Structural Engineering Visakha Technical Campus, Narava, Visakhapatnam, Andhra Pradesh, 53001
2 Assistant Professor,Dept of Structural Engineering Visakha Technical Campus, Narava, Visakhapatnam, Andhra Pradesh, 53001
ABSTRACT
A building that lacks symmetry and has discontinuity in geometry, mass, or load resisting elements is called irregular. These irregularities may cause interruption of force flow and stress concentrations.
Horizontal irregularities which refer to asymmetrical plan shapes (e.g. L, T, U, F) or discontinuities in the horizontal resisting elements such as cut-outs, large openings, re-entrant corners and other abrupt changes resulting in torsion, diaphragm deformations and stress concentration.
In this stu dy, the dynamic analysis of “L” shaped G+2 residential building has been analyzed and designed by using ETABS -16 and RCDC softwares for various seismic Zones (Zone-II, Zone-III, Zone-IV, Zone-V). Bending moment, shear force, and storey drift has been calculated by considering different load conditions.
Maximum Bending moment, shear force, support reactions are found to be increasing with the increasing in seismic Zone.
I.INTRODUCTION
1.1 TYPES OF IRREGULARITIES:
`
Available online: https://edupediapublications.org/journals/index.php/IJR/ P a g e | 1514
875-part-3 entire India is divided into different wind zones based on wind velocities 33m/s, 39 m/s, 43m/s, 50m/s, 55m/s and also velocity of wind increases with height of the structure.
Urban infrastructure had resulted in many irregular structures such as
1. Load path irregularity 2. Plan irregularity 3. Vertical irregularity 4. Mass irregularity 5. Stiffness irregularity
2.LITERATURE REVIEW
P. MANJUNATH et.al, (2016)10 The work done on analysis of multi storey building on sloping
and plain ground with flat slab. In this study 10 storied 3D model with 4 bays in Y direction and 6 bays in X direction has been taken. The slope of the ground is taken between 00 to 300. ETABS
`
Available online: https://edupediapublications.org/journals/index.php/IJR/ P a g e | 1515
zone V. They concluded that decrease in seismic weight is seen when the slope at the base is increased and the performance of the building is increased when the stiffness of the soil is more. They also said that decrease in acceleration, displacement and drift is seen for stiffer soil compared to loose soil.
PRALOBH S. et.al, (2015)17 The paper gives the possibility of dynamic investigation of Steel and
RCC with unsymmetrical setup. The investigation carried on a model of G+9 stories of RCC and Steel working with unsymmetrical floor design. The examination is via conveyed by utilizing ETABS software. The parameter, for example, story float, story shear and torsion is resolved. For dynamic examination reaction spectra technique or time history strategy is utilized. Dynamic investigation ought to be performed for symmetrical and also unsymmetrical building. Dynamic investigation is as full nonlinear dynamic time history examination. If the RCC and Steel building have unsymmetrical setups, the torsional impact will be creating in the both the building and are contrasted with each other with decide the effective working under torsion.
NITIN.M. WARADE & P.J. SALUNKE (2013)8submitted a research paper “Comparative
Study of Analysis and Design of R.C. and Steel Structures” it is concluded that base shear in steel structure is less than the R.C. Structure because of the less seismic weight which gives better seismic response during earthquake. In this paper for the frame analysis a 3-D model was prepared in ETABS for the earthquake zone 5. The graphs for that are given below which show us that steel frame is having lesser values of base shear than RC frame due to its lesser weight. And bare frame is having lesser values of base shear than masonry infill frame due to its lesser weight.
F.Jalayer, and C. A. Cornell (2009)5, conducted a non-linear dynamic analysis procedures.
using real ground motion records; can be used to make probability-based seismic assessments. These procedures can be used both to obtain parameter estimates for specific probabilistic assessment criteria such as demand and capacity factored design and also to make direct probabilistic performance assessments using numerical methods. Multiple-stripe analysis is a non-linear dynamic analysis method that can be used for performance-based assessments for a wide range of ground motion intensities and multiple performance objectives from onset of damage through global collapse. Alternatively, the amount of analysis effort needed in the performance assessments can be reduced by performing the structural analyses and estimating the main parameters in the region of ground motion intensity levels of interest. In particular, single-stripe and double-stripe analysis can provide local probabilistic demand assessments using minimal number of structural analyses (around 20 to 40). As a case study, the displacement-based seismic performance of an older reinforced concrete frame structure, which is known to have suffered shear failure in its columns during the 1994 Northridge Earthquake, is evaluated.
3.METHODOLOGY
`
Available online: https://edupediapublications.org/journals/index.php/IJR/ P a g e | 1516
1. Foundation depth =1.5 m
2. Supports = All are fixed Supports 3. Number of storey's = G+2
4. Height of each floor = 3 m
5. Total height of the building = 12 m
6. Cross section of the main beam = 300 mm x 500 mm 7. Cross section of the secondary beam = 250 mm x 400 mm 8. Cross section of the column = 250 mm x 400 mm
9. Height of the parapet wall = 1.2 m 10. Thickness of the walls
* External wall = 230 mm * Internal wall - 115 mm 11. Thickness of the plaster = 10 mm
12. Density of the brick =20 KN/ m3
13. Density of the concrete in the members except walls =25KN/m3 14. Floor finish =1 KN/m2
15. Slab thickness=0.15m 16. Number of beams =332 17. Number of columns =180 18.Importance factor =1
19.Responce Reduction factor = 5
Number of earthquake zones =4 (II. Ill, IV, V)
Table 3.1 zone factors
ZONE ZONE FACTOR(Z)
II 0.1
`
Available online: https://edupediapublications.org/journals/index.php/IJR/ P a g e | 1517
IV 0.24
V 0.36
Some examples for each zone are:
Zone -II Visakhapatnam, Allahabad, Aurangabad, Bangalore
Zone –III Agra, Bijapur, Bokaro.
Zone-IV Ambala. Amritsar, Chandigarh.
Zone-V Guwahati. Imphal, Gujarat
4 STRUCTURAL MODELING
4.1 GENERAL:
For complex or irregular structures which do not have clearly defined orthogonal directions, it may be unclear as to how the orientation of response-spectrum analysis should be applied. A building frame model involves the assemblage of structural elements viz., beams, columns, slabs, footing etc. To represent the structural aspects of a typical frame in a building and exhibit its behavior under external loading. An analytical model must ideally represent its mass distribution, strength, stiffness and deformability through a full range of local and global displacements. This chapter deals with the modeling of irregular RC framed of G+2 storey building using response spectrum Analysis.
`
Available online: https://edupediapublications.org/journals/index.php/IJR/ P a g e | 1518
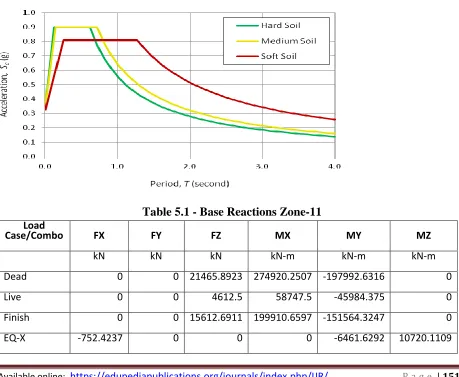
5 RESPONSE SPECTRUM ANALYSIS OF RC FRAMES
5.1 GENERAL:
Response-spectrum analysis (RSA) is a linear-dynamic statistical analysis method which
measures the contribution from each natural mode of vibration to indicate the likely maximum
seismic response of an essentially elastic structure. Response-spectrum analysis provides
insight into dynamic behavior by measuring pseudo-spectral acceleration, velocity, or
displacement as a function of structural period for a given time history and level of damping. It
is practical to envelope response spectra such that a smooth curve represents the peak
response for each realization of structural period.
Table 5.1 - Base Reactions Zone-11
Load
Case/Combo FX FY FZ MX MY MZ
kN kN kN kN-m kN-m kN-m
Dead 0 0 21465.8923 274920.2507 -197992.6316 0
Live 0 0 4612.5 58747.5 -45984.375 0
Finish 0 0 15612.6911 199910.6597 -151564.3247 0
`
Available online: https://edupediapublications.org/journals/index.php/IJR/ P a g e | 1519
EQ-Y 0 -571.3137 0 4906.3011 0 -6160.115
RES Max 601.73 462.5611 0 3327.4054 4509.655 8976.2747
UDCon1 0 0 62536.6252 800367.6156 -593311.997 0
UDCon2 -902.9084 0 50029.3001 640294.0925 -482403.5526 12864.1331 UDCon3 902.9084 0 50029.3001 640294.0925 -466895.6425 -12864.1331 UDCon4 0 -685.5764 50029.3001 646181.6539 -474649.5976 -7392.138 UDCon5 0 685.5764 50029.3001 634406.5312 -474649.5976 7392.138 UDCon6 1128.6355 - 0 55617.8752 712246.3656 -534027.8782 16080.1664 UDCon7 1128.6355 0 55617.8752 712246.3656 -514642.9907 -16080.1664 UDCon8 0 -856.9705 55617.8752 719605.8173 -524335.4345 -9240.1726 UDcon9 0 856.9705 55617.8752 704886.9139 -524335.4345 9240.1726
Table 5.12 : Variation of maximum bending moment in beams
Height of structure (m) maximum bending moment kNm
Zone-2 128.31
Zone-3 135.62
Zone-4 149.36
`
Available online: https://edupediapublications.org/journals/index.php/IJR/ P a g e | 1520
From table 5.12 we can say that the maximum bending moment at II is 128.31kNm, Zone-III is 135.62kNm, Zone-IV is 149.36kNm and Zone-V is 163.89kNm. it is represented by graph.
7.DESIGN OF MEMBERS
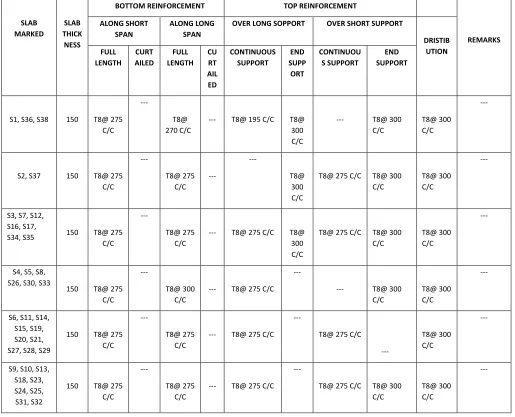
7.1 DESIGN OF SLAB
Slabs are plain structural members forming floors and roofs of building whose thickness is quite small compared to their other dimensions. These carry load primarily by flexure and are various shapes such as square, rectangular, circular and triangular in buildings, tanks etc. inclined slabs may be used as ramps for multistoried as parking. A stair case is considered to be an inclined slab.
Slab may be supported by beams or by walls and may be simply supported or continuous over one or more supports. When the ratio of the length to the width of a slab is more than 2 and the most of the load is carried by the shorter span and in such a case is known as one-way in case the ratio is less than 2 then it is called a Two-way slab which is further classified as
128.31 135.62
149.36
163.89
0 20 40 60 80 100 120 140 160 180
Zone-2 Zone-3 Zone-4 Zone-5
`
Available online: https://edupediapublications.org/journals/index.php/IJR/ P a g e | 1521
restrained and simply supported slabs. The various other types of the slabs are flat slabs, which rest directly on columns with beams and Grid Floors or Ribbed slabs.
Table 7.1 SLAB REINFORCEMENT SCHEDULE
SLAB MARKED
SLAB THICK NESS
BOTTOM REINFORCEMENT TOP REINFORCEMENT
REMARKS ALONG SHORT
SPAN
ALONG LONG SPAN
OVER LONG SOPPORT OVER SHORT SUPPORT
DRISTIB UTION FULL LENGTH CURT AILED FULL LENGTH CU RT AIL ED CONTINUOUS SUPPORT END SUPP ORT CONTINUOU S SUPPORT END SUPPORT
S1, S36, S38 150 T8@ 275 C/C
---
T8@ 270 C/C
--- T8@ 195 C/C T8@ 300 C/C
--- T8@ 300 C/C
T8@ 300 C/C
---
S2, S37 150 T8@ 275 C/C --- T8@ 275 C/C --- --- T8@ 300 C/C
T8@ 275 C/C T8@ 300 C/C
T8@ 300 C/C
---
S3, S7, S12, S16, S17,
S34, S35 150 T8@ 275 C/C
---
T8@ 275 C/C
--- T8@ 275 C/C T8@ 300 C/C
T8@ 275 C/C T8@ 300 C/C
T8@ 300 C/C
---
S4, S5, S8, S26, S30, S33
150 T8@ 275 C/C
---
T8@ 300 C/C
--- T8@ 275 C/C ---
--- T8@ 300 C/C
T8@ 300 C/C
---
S6, S11, S14, S15, S19, S20, S21, S27, S28, S29
150 T8@ 275 C/C
---
T8@ 275 C/C
--- T8@ 275 C/C ---
T8@ 275 C/C
---
T8@ 300 C/C
---
S9, S10, S13, S18, S23, S24, S25, S31, S32
150 T8@ 275 C/C
---
T8@ 275 C/C
--- T8@ 275 C/C ---
T8@ 275 C/C T8@ 300 C/C
T8@ 300 C/C
`
Available online: https://edupediapublications.org/journals/index.php/IJR/ P a g e | 1522
8. RESULT DISCUSSION AND CONCLUSIONS
A major purpose of the project being commented upon is to determine forces on components of a irregular building or a structure as required for design purposes. For buildings, Earthquake force is required in order to design with supporting elements, from which the forces get transferred to the framework. Thus the building frame experiences the cumulative effect of Earthquake forces produces forces on different parts of nodal joints. These forces are used in designing the framework. This project provides values of bending moments, shear forces, storey drifts for a variety of cases covered.
The effects of the underestimation of basic earthquake quantity and of bending moment values for buildings, can lead in some situations to designs that do not meet intended minimum requirements for earthquake forces.
Maximum Bending moment is found to be increasing with the increasing in seismic Zone,
Maximum Bending moment is observed in Zone-1V
`
Available online: https://edupediapublications.org/journals/index.php/IJR/ P a g e | 1523 Sum of Model mass participation factor values in Global X, Y, Z directions reached “1” at
15th mode of model case.
The stability of a structure shall be checked both with and without the earthquake loads.
Structural performance objectives are taken into account during preliminary design and
response-spectrum analysis.
Maximum support reactions are found to be increasing with the increasing in seismic Zone,
Maximum support reactions are observed in Zone-1V
Response spectrum base shear reached more than 80% of static base shear.
Maximum shear force is found to be increasing with the increasing in seismic Zone,
Maximum shear force is observed in Zone-1V
The results of model building were design for worst earthquake combinations
REFERENCES
1. Armella and anthoine “a simple displacement control technique for pushover analysis”, earthquake engineering and structural dynamics, 2006; vol.35 pg.no. 851-866.
2. Chen, wai-fah and kishi. n., "semi rigid steel beam-to-column connections: data base and modeling", journal of structural engineering, 1989, vol.115, no.l, pp.105-119
3. Chinitha a, umesha p.k. “evaluation of seismic performance of an existing steel building –
wind analysis approach”, iset journal of earthquake technology, 2008, vol.41, pg no. 159-181.
4. Earthquake Resistant Design of Structure by Pankaj Agarwal Manish shrikhande. 5. ETABS -16 Technical Notes Manual by Computers & Structures, INC.
6. Erol Kalkan and sashi k. Kunnath “method of modal combinations for wind analysis of
buildings”, 13th world conference on earthquake engineering, August 1-6, 2004 Paper no. 2713.
7. F.jalayer, and c A. Cornell "alternative non-linear demand estimation methods for probability-based seismic assessments1'', earthquake engineering and structural dynamics, 2009; vol.38 pg no. 951-972.
8. K. Chopra and Rakesh K. Goel (2000), “Building Peirod Formulas for Estimating
`
Available online: https://edupediapublications.org/journals/index.php/IJR/ P a g e | 1524
9. IS 456:2000, "code of practice for plain and reinforced concrete" bureau of Indian standards, New Delhi, (2000).