Towards Computer Vision Based Ancient Coin
Recognition in the Wild – Automatic Reliable Image
Preprocessing and Normalization
Brandon Conn and Ognjen Arandjelovi´c
†School of Computer Science
University of St Andrews
St Andrews KY16 9SX
Fife, Scotland
United Kingdom
†
[email protected]
Abstract—As an attractive area of application in the sphere of cultural heritage, in recent years automatic analysis of ancient coins has been attracting an increasing amount of research attention from the computer vision community. Recent work has demonstrated that the existing state of the art performs extremely poorly when applied on images acquired in realistic conditions. One of the reasons behind this lies in the (often implicit) assumptions made by many of the proposed algorithms – a lack of background clutter, and a uniform scale, orientation, and translation of coins across different images. These assumptions are not satisfied by default and before any further progress in the realm of more complex analysis is made, a robust method capable of preprocessing and normalizing images of coins acquired ‘in the wild’ is needed. In this paper we introduce an algorithm capable of localizing and accurately segmenting out a coin from a cluttered image acquired by an amateur collector. Specifically, we propose a two stage approach which first uses a simple shape hypothesis to localize the coin roughly and then arrives at the final, accurate result by refining this initial estimate using a statistical model learnt from large amounts of data. Our results on data collected ‘in the wild’ demonstrate excellent accuracy even when the proposed algorithm is applied on highly challenging images.
I. INTRODUCTION
Numismatics is an academic discipline that is concerned with the study of currency [1]. In a more colloquial sense, the term is also used to describe the hobby of collecting various forms of money, such as coins, banknotes, or tokens. Indeed, from the very inception of the first forms of money, its collecting and analysis has attracted the fascination of many enthusiasts.
The study of ancient coins, the most popular of which are Ancient Greek and Ancient Roman coins, is particularly interesting from a computer vision perspective for two key reasons. Firstly, automatic methods can offer genuine practical benefit both to experts as well as amateur enthusiasts [2]. Potential uses include the identification of coins, study of style across time or geographical regions, identification of forgeries, automatic monitoring of websites for stolen items, etc. Secondly, various problems which fall under the scope of interest of ancient numismatists, present a breadth of technical
challenges. These include challenges in feature extraction and representation, joint modelling of appearance and geometry, retrieval and matching, and numerous others. These challenges are not only interesting in their own right but also offer translational potential.
Recent work, and the first thorough and systematic eval-uation of the current state of the art [3], has highlighted a series of methodological limitations of previous work on computer vision based analysis of ancient coins. One of the most important of these is the assumption of overly controlled conditions used to image coins – coins are assumed to be well localized, canonically oriented and scaled, and the background uniform and clear of clutter. As illustrated in Figure 1, this assumption is very much at odds with the type of data encountered in practice. Hence, in the present work our aim is as follows: given a pair of potentially cluttered input images of a coin’s obverse and reverse, we wish to localize the coin and accurately delineate its boundary.
A. Terminology
Considering the interdisciplinary nature of the present paper, it is important to explain the relevant numismatic terminology so that the specific task at hand and its challenges can be clearly understood. A succinct summary is presented next.
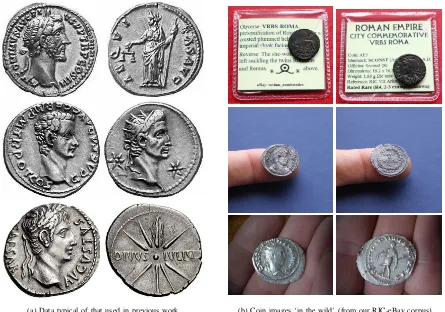
(a) Data typical of that used in previous work (b) Coin images ‘in the wild’ (from our RIC-eBay corpus)
Fig. 1. Comparison of images of ancient coins typical of (a) previous work, and of (b) real-world interest. The former can be seen to show high quality coins, photographed in focus, well localized, canonically oriented and scaled, and with the background uniform and clear of clutter. In contrast, the latter exhibit variable positioning, scale, and orientation, extensive background clutter, and often unfavourable lighting.
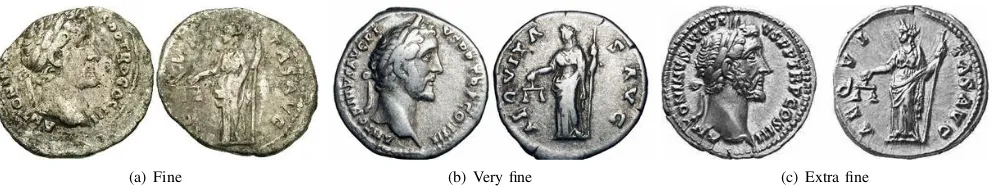
specimens of the same type, that the spatial arrangements of the legend (by definition the same in all cases) is different between the very fine example in Figure 3(b) and the extra fine example in Figure 3(c). In the former case the break (space) in the legend is AEQVITA-SAVG, and in the latter AEQVI-TASAVG. Nevertheless the type is the same.
1) Condition grades: An important consideration in the analysis of a coin is itscondition. Succinctly put the condition describes the degree of preservation of a coin, or equivalently the amount of damage it suffered since it was minted. The usual grading scale adopted in ancient numismatics includes the following main grades: (i) poor, (ii) fair, (iii) good, (iv) very good, (v) fine, (vi) very fine, and (vii) extremely fine. Virtually universally (i.e. save for extremely rare coin types) only the last three are considered of interest to collectors, that is fine (F), very fine (VF), and extremely fine (EF or XF). Note that less frequently used transitional grades can be derived from the main seven by qualifiers e.g. near or almost fine (nF, aF), better than fine (F+) etc.
An ancient coin in a fine condition displays all the main visual elements of the type, as illustrated with an example in Figure 3(a). A very fine coin also has more subtle elements pre-served such as clothing creases as exemplified in Figure 3(b). An extremely fine condition coin is in approximately the same condition in which it was when it was minted, showing the entirety of the original detail, as can be seen in Figure 3(c).
2) Miscellaneous: In order to appreciate the challenge of the task at hand, it is important to recognize a number of factors other than the condition which affect the appearance of a coin. These include die centring, surface metal changes (due to oxidation or other chemical reactions), and die wear.
Die centring refers to the degree to which the centre of the die coincides with the centre of the actual piece of metal against which it is struck to create the coin. A coin with poor centring may have salient design elements missing e.g. a part of the legend. An example of a somewhat poorly centred obverse can be seen in Figure 3(c).
Depending on the presence of different substances in a coin’s environment (soil, air, etc.), the surface metal can change its colour and tone as it reacts with chemicals it is exposed to. Observe the difference in the tone of the coins in Figure 3.
B. Previous work
To appreciate the motivation behind the present work it is crucial to understand the state of the art of computer vision based ancient coin analysis at the present time, and specifically the (often implicit) assumptions that the proposed methods are highly reliant on. Herein we summarize the relevant body of work.
Most early and some more recent attempts at the use of computer vision for coin analysis have concentrated on modern coins [4], [5], [6]. This is understandable considering that modern coins are machine produced and as such pose less of a challenge than ancient coins. Modern coins do not exhibit variation due to centring issues, shape, different depictions of semantically identical elements, etc. From the point of view of computer vision, two modern coins at the time of production are identical. This far more restricted problem setting allows for visual analysis to be conducted using holistic representations such as raw appearance [7] or edges [8], and off-the-shelf learning methods such as principal component analysis [7] or conventional neural networks [9]. However such approaches offer little promise in the context of ancient numismatics.
The existing work on computer vision based ancient coin analysis can be categorized by the specific problem addressed as well as by the technical methodology. As regards the former categorization, some prior work focuses on coin instance recognition i.e. the recognition of a specific coin rather than a coin type. This problem is of limited practical interest, its use being limited to such tasks as the identification of stolen coins or the detection of repeated entries in digital collections. Other works focus on coin type recognition, which is a far more difficult problem [10], [11], [12]. Most of these methods are local feature based, employing local feature descriptors such as SIFT [13] or SURF [14]. The reported performance of these methods has been rather disappointing and a major factor appears to be the loss of spatial, geometric relationship in the aforementioned representations [15], [16]. In an effort to overcome this limitation, a number of approaches which divide a coin into segments have been described [17]. These methods implicitly assume that coins have perfect centring, are registered accurately, and are nearly circular in shape. None of these assumptions are realistic. The sole method which does not make this set of assumptions builds meta-features which combine local appearance descriptors with their geometric relationships [12]. Though much more successful than the alternatives, the performance of this method is still insufficiently good for most practical applications.
[image:3.612.322.568.56.184.2]All of the aforementioned work shares the same limi-tation of little use of domain knowledge. In particular, the general layout of the key elements of Roman imperial coins is generally fixed, save for few rare exceptions. Hence it makes sense to try to use this knowledge in analysis. The few attempts in the existing literature generally focus on the coin legend [2]. In broad terms this appears sensible as the legend carries a lot of information, much of which is shared with the coin’s pictorial elements. For example, the obverse legend in almost all cases contains the name of the emperor depicted, and the reverse the name of the deity shown. The denarius of Antoninus Pius with Aequitas (goddess of justice and equality) in Figure 3 illustrates this well, the obverse
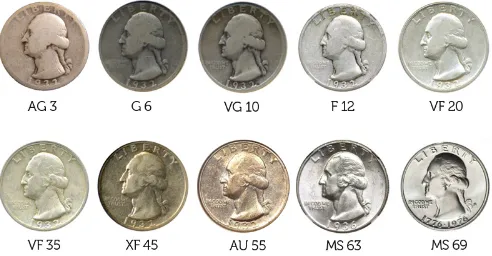
Fig. 2. An example of a modern, machine produced coin. Shown is the well-known silver Washington quarter dollar in different condition grades used for grading modern coins. Unlike ancient coins which suffer from imperfect die centring and which within the same type exhibit variation in the appearance of the semantically identical elements, and the overall coin shape, no such challenges exist in the analysis of modern coins.
legend beingANTONINVSAVGPIVSPPTRPCOSIII, and the reverse AEQVITASAVG. However, in spite of this, methods such as that described in [2] offer little promise for practical use. The key reason for this lies in the fact that the legend, with its fine detail, is one of the first elements of the coin to experience damage and wear. Coins with clearly legible legends are generally expensive and rare, and thus of little interest to most collectors. They are also the easiest to identify, by the very nature of their good preservation, and hence do not represent the target data well.
It is important to highlight that all work to date has been highly unstructured andad hocin its evaluation methodology. Some authors use data sets with coins in different conditions and unstated distributions thereof [12], and others very small data sets with coins in extremely rare, museum grade [11]. In the first large-scale, systematic evaluation to date, Fare and Arandjelovi´c [3] demonstrated that the current state of the art performs extremely poorly when applied on coins in the state of preservation of interest in practice, even in the absence of clutter or a number of other confounding factors which make coin analysis even more challenging.
II. CONTRIBUTIONS
In this section we detail the key contribution of the present work, which involves the localization of an ancient coin in a possibly cluttered image, and its accurate delineation (or segmentation). We start with an overview of the approach and then proceed with explanations of each of the steps of the algorithm.
A. Overview
(a) Fine (b) Very fine (c) Extra fine
Fig. 3. Specimens of Antoninus Pius’s denarius (RIC 61) from our RIC-ACS data set described in Section II-B1.
in appearance, coins are roughly oval and this property allows them to be readily distinguished from the rest of the image content.
Considering that the second stage of our method, that concerned with the accurate delineation of a coin’s boundary, is statistical in nature and requires learning from data, we first summarize the collection and content of the data sets employed for the purposes of the present work, and then go on to describe the two stages (coarse and fine) of our algorithm in Sections II-C and II-D respectively.
B. Data
A major limitation of existing research on computer vision based ancient coin analysis concerns the evaluation methodol-ogy. In particular, virtually all experiments in previous work were performed using extremely small data sets and using images acquired in highly controlled and uniform conditions. To cater to the goals of the present work, set out in Section I, we collected two new data sets, which we describe in detail next. Their use will be made clear in the subsequent sections in which we explain the technical aspects of the proposed algorithm.
1) Data set 1 (RIC-ACS): The data set that herein we refer to as RIC-ACS is a large data set of high quality images acquired professionally and in controlled conditions (mostly uniform background, favourable illumination, stan-dardized coin orientation, etc.). The data set comprises images of 200,000 coins and was kindly made available to us by the Ancient Coins Search Engine (acsearch.info). This is a highly diverse corpus in that it spans the entire timespan of the Roman empire (from the rise of Octavian in 29 BC until the fall of Romulus in 476 AD), includes all denominations used in this period (sestertii, dupondii, asses, denarii, antoninianii, foll¯es, AE4s, AE3s, etc.), as well as coins of different conditions. It is worth noting that coin types in RIC-ACS are highly heterogeneously distributed across different classes of interest (emperors, as the issuing authorities). This is an consequence of the manner in which data were collected and the inherent differential in the scarcity of different emperors’ coins – certain classes (usually those corresponding to emperors who ruled for prolonged periods of time, such as Antoninus Pius) contain many exemplars, while others very few (similarly, usually those which correspond to usurpers who ruled for brief periods of time, like Didius Julianus). Examples are shown in Figure 1(a) and Figure 3.
2) Data set 2 (RIC-eBay): The data set introduced in the previous section was acquired in controlled conditions, and by skilled professionals. As we will explain in Section II-D
images from this corpus are used for training purposes only. Given the aim of the present work and our focus on images of coins ‘in the wild’, we manually acquired another, smaller data set comprising images of 100 coins listed for sale on eBay (note that the total number of images is 200, as each coin is photographed separately from the obverse and the reverse). We specifically rejected any professionally acquired images or images with a uniform background, and sought challenging and varied examples. Some are illustrated in Figure 1(b).
C. Step 1: Coarse localization
Our approach to coarse localization involves the use of a simple geometric primitive as a hypothesis employed as a bootstrap for the subsequent refining step. We start with an explanation of the baseline methodology which uses a circular primitive and then progress to the final, more complex approach used in our final implementation.
1) Coarse localization using the circular shape assump-tion: Notwithstanding shape irregularities which are effected during the minting process or subsequently as a consequence of damage (through use, due to erosion by substances in the coin’s environment, etc.), as the first approximation coins are roughly circular. Indeed, it is this feature which enables humans to localize them quickly even in greyscale images or even when the visual elements of the coin are absent. Therefore, it is reasonable to approach the first stage of the proposed algorithmic pipeline, that of coarse localization, as a circle detection problem. This idea is particularly attractive considering that circle detection has been studied in detail since some of the earliest days of computer vision. Circle detection is usually performed using binary, edge images [12], and herein we adopt the same strategy. Hence we start by applying the Canny edge detector [18] to the original input.
The option of exhaustively exploring the entire parameter space, e.g. using the Hough transform [19], is simple but unattractive. Not only is it highly inefficient but it also fails to exploit the information obtained when hypotheses are tested in guiding future search efforts. To overcome these limitations we adopt an approach which uses a genetic algorithm [20]. Our methodology is inspired by the work of Ayala-Ramirez
et al. [21] but with important differences in the core design, which we shall explain shortly.
that when encoded as a ‘chromosome’ (in the context of a genetic algorithm), operations such as crossover, mutations, and others, are likely to effect an improvement in the fitness of a hypothesis. With this goal in mind, we parameterize a circle (hypothesis) using three points on its circumference and, unlike Ayala-Ramirez et al. [21], use a short, non-binary chromosome comprising the coordinates of these points. By enforcing the indivisibility of coordinate values (which the binary chromosome of Ayala-Ramirez et al. does not do) we ensure that the constraint imposed by two circumference points is retained during evolutionary operations, thereby achieving a higher chance of greater generational fitness improvement.
The fitness of a specific hypothesis is evaluated in a straightforward fashion. Firstly, from three circumference points (xa, ya), (xb, yb), and (xc, yc), the coordinates of the circle’s centre (x0, y0) can be computed using closed form
expressions:
x0=
x2
b+yb2−x2a−x2b 2(yb−ya) x2
c+yc2−x2a−x2b 2(yc−ya)
4 [(xb−xa)(yc−ya)−(xc−xa)(yb−ya)], (1)
y0=
2(xb−xa) x2b+y2b−x2a−x2b
2(xx−ya) x2c+y2c−x2a−x2b
4 [(xb−xa)(yc−ya)−(xc−xa)(yb−ya)] , (2)
as well as its radius r:
r=p(xa−x0)2+ (xa−x0)2. (3)
From this parameterization, the fitness of a hypothesis can be readily quantified by (i) uniformly sampling the circum-ference of the corresponding circle, and (ii) computing the number of samples which are located on edge pixels of the edge image. Formally, if there arenssamples, and the samples are {(x1, y1),(x2, y2), . . . ,(xns, yns)}, the fitness becomes:
φ=
Pns
i=1E(xi, yi)
ns , (4)
whereE(x, y)is the value of the pixel(x, y)in the edge image
E.
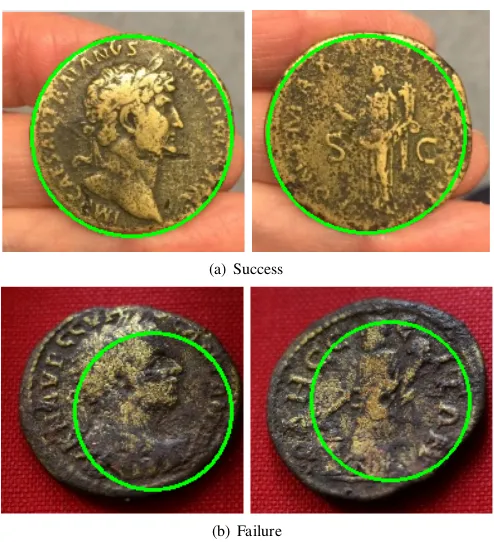
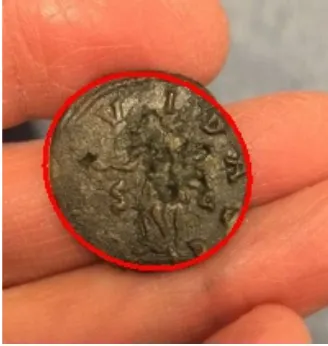
2) Coarse localization using the basic elliptical shape assumption: Two representative examples of coarse coin local-ization using the circular shape assumption, described in the previous section, are shown in Figure 4. In the first case, in Figure 4(a), the localization can be seen to be highly successful both in the obverse and in the reverse images. Despite the presence of background clutter (edge features of the palm which supports the coin), the coin is localized well, owing to its circularity which matches the basic assumption of the localization algorithm. However, in the example in Figure 4(b), the coin is distinctly non-circular, its shape being closer to an ellipse with significant eccentricity. Thus, unsurprisingly, this violation of the assumption underlying the localization algorithm misleads our genetic algorithm which finds as the best hypothesis a circle that matches a part of the coin’s boundary, which is approximately circular.
These observations, pertinent in many (if not most) in-stances of ancient coin images in the wild, motivated us to
pro-(a) Success
[image:5.612.322.569.49.320.2](b) Failure
Fig. 4. Examples of coarse coin localization using the circular shape assump-tion, described in Section II-C1. Shown are (a) successful, and (b) unsuccessful examples. In the former case, despite the presence of background clutter, the coin is localized well, owing to its circularity. In the latter example, the coin is distinctly non-circular and exhibits shape closer to elliptical. Unsuccessful localization is effected by this violation of the assumption underlying the localization algorithm and an approximately circular boundary segment which misleads our genetic algorithm.
pose several improvements to the previously designed coarse localization algorithm. Firstly, we abandoned the assumption of circularity and instead regard coins to be roughly elliptical. Secondly, we employ edge orientation information to ensure local shape coherence.
Unlike a circle, an ellipse embedded within a 2-dimensional Euclidean space is parameterized not by three but five param-eters. This can be readily seen from the implicit equation:
x2+kxyxy+kyyy2+kxx+kyy+k= 0. (5) Hence, we now construct chromosomes by concatenating the coordinates of five points on an ellipse’s circumference. From these, (xa, ya), (xb, yb), (xc, yc), (xd, yd), and (xe, ye), the parameters in (5) can be obtained by solving a simple linear equation: x2
a xaya y2a xa ya 1 x2
b xbyb y2b xb yb 1 x2
c xcyc y2c xc yc 1 x2
d xdyd y2d xd yd 1 x2
e xeye y2e xe ye 1 1 kxy kyy kx ky k = 0 0 0 0 0 . (6)
As in Section II-C1, to evaluate the fitness of a hypothesis we first generate equispaced samples along the circumference of the corresponding ellipse. This is readily done using the canonical form, i.e. using the major and minor radii (a and
[image:5.612.53.304.253.395.2]relative to the coordinate system:
a= −
√
2ψψ1
k2
xy−4kyy
and b= −
√
2ψψ2
k2
xy−4kyy , (7)
x0=
2kyykx−kxyky k2
xy−4kyy
and y0=
2ky−kxykx k2
xy−4kyy , (8)
where:
ψ=k2y+kyykx2−kxykxky+ (k2xy−4kyy)k, (9) ψ1=1 +kyy+
q
(1−k2
yy) +kxy2 , (10) ψ2=1 +kyy−
q
(1−k2
yy) +kxy2 . (11)
As noted earlier, we evaluate the fitness of the hypothesis from the generated set of samples by counting the proportion of samples which fall onto edge pixels whose direction matches the direction of the ellipse tangent at the sample within a tolerance thresholdτα:
φ=
Pns(a,b)
i=1 E(xi, yi)u(∆α≤τα)
ns(a, b) , (12)
where ∆α is the aforementioned direction difference, and
u(. . .) the function which is equal to 1 when its argument is true, and 0 when false. Note that we also make the number of samples ns a function of the ellipse circumference length.
This was done to eliminate the bias towards smaller ellipses which is effected by the local correlation in the appearance of an edge image – for small ellipses consecutive sampling can even sample the same pixel twice, thus falsely increasing the measured fitness of the hypothesis.
3) Coarse localization using the coherent elliptical shape assumption: Our experiments readily demonstrated that the algorithm we introduced in the previous section vastly out-performed the simplistic localization using the circular coin shape assumption described in Section II-C1, both in terms of producing more accurate fitting, as well as in terms of overall robustness to irregularities in the shape of coins, background clutter, etc. Nevertheless, in a small but practically significant proportion of cases, we observed a particular weakness. Specif-ically, in some instances we found that one side of the coin (the obverse or the reverse) was localized well but not the other. This may happen when different backgrounds were present in the two images, or when one of the sides of the coin contains a motif which itself is circular in shape (for example, the design of many reverses includes a circular boundary of dots, as can be seen in Figure 3).
[image:6.612.362.526.54.227.2]Our idea for overcoming the aforementioned problem was to perform localization in the obverse and reverse images concurrently, ensuring coherence between the two. This is far from a simple task. Firstly, considering that in the present work we are interested in images acquired by amateurs and in uncontrolled conditions, the coin scale cannot be assumed to be the same in the images of its two sides. Indeed, the scale is often very different. Similarly, no assumptions on the relative orientations of the coin in the two images can be made – misalignment may be introduced by the person imaging the coin, with the further unknown rotation due to the die axis angle. These challenges introduce algorithmic problems too. In particular, it is not clear how the chromosome based
Fig. 5. An example of rough localization result obtained using our approach based on the coherent elliptical shape assumption described in Section II-C3.
representation of a shape hypothesis used in Sections II-C1 and II-C2 may be adapted to represent coherent shapes in both the obverse and the reverse images.
We propose an algorithm which maintains two separate sets of chromosome populations, one for the obverse and one for the reverse image. The interaction and coherence between the two is achieved when chromosomal fitness is assessed. In particular, given that both scale and orientation can vary, we quantify the fitness of a particular hypothesis by combining its baseline individual fitness, evaluated using the expression introduced previously in (12), with the baseline fitness of the chromosome in the counterpart population with the closest matching eccentricity of the corresponding ellipses. The combined fitness is computed as:
ˆ
φ= (φ1+φ2)
|1−2|
1+2
, (13)
whereφ1andφ2are the two baseline fitness values, and1and
2the corresponding eccentricities. In our final implementation
we increase the robustness of this process by searching for the
nm closest matching hypotheses and selecting the one which results in the greatest combined fitness. A typical result is illustrated in Figure 5.
D. Step 2: Localization refinement using a statistical model learnt from data
Recall from Section II-A that our algorithm involves two steps, the first of which concerns rough localization of a coin in an image, and the second which performs fine segmentation. We perform the latter task using a statistical approach which is data driven, and explain it in detail next.
an elliptical annulus. If the points of the mesh arexi,j where different values of the index i correspond to the movement along the circumference of the ellipse, and of the index j
perpendicular to it, the coin boundary is detected by finding the best sequence:
j(1), j(2), . . . , j(nb), (14)
or, equivalently:
(x1,j(1), v1,j(1)),(x2,j(2), v2,j(2)), . . . ,(xnb,j(nb), ynb,j(nb)).
(15)
Optimality in this context is governed by two factors. The first of these concerns the differential lateral displacement between two consecutive points in the sequence (xi,j(i), yi,j(i)) and
(xi+1,j(i+1), yi+1,j(i+1)). We treat the distribution of these
displacements as being Gaussian, with a zero mean and the variance learnt from data (as we will explain shortly). In effect, this is a statistical way of representing how the flan of the coin behaves when struck during the minting process, and how it is affected by the use of the coin and by the exposure to various environmental factors. The second factor which defines the optimality of a specific boundary delineation is dependent on local image appearance. Following Arandjelovi´c and Zisserman [22] we estimate the magnitude of the gradient at a specific mesh point in the direction perpendicular to the initial elliptical approximation, and assign a high weight (high chance of inclusion in the final boundary delineation) to points at which the gradient exceeds a certain threshold, and a low weight to others. By doing this we ensure that unfavourable imaging conditions (shadow, locally similar coin and background colour, etc.) can be overcome using the learnt statistics on boundary shape variability. Formally, the likelihood of our model for a given sequence of mesh points can be written as:
L(j1, . . . , jnb) =p(x1,j1, y1,j1|xnb,jnb, ynb,jnb)· (16)
ψ(x1,j1, y1,j1)·ψ(xnb,jnb, ynb,jnb)· (17)
nb
Y
i=2
p(xi,ji, yi,ji|xi−1,ji−1, yi−1,ji−1)· (18)
ψ(xi,ji, yi,ji)·ψ(xi−1,ji−1, yi−1,ji−1) (19) where ψ is the aforementioned gradient based weight. The optimal solution is found by likelihood maximization:
(j1∗, . . . , jn∗
b) = arg maxj
1,...,jnb
L(j1, . . . , jnb), (20)
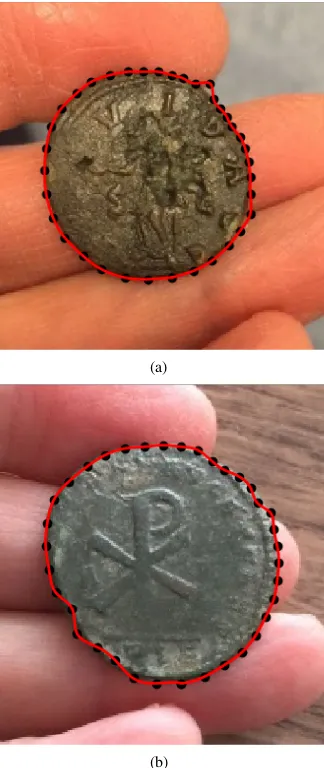
which can be performed efficiently (in linear time in the number of mesh points) using dynamic programming and the so-called Viterbi algorithm [23], [24]. Typical results are illustrated in Figure 6.
a) On training.: As our approach illustrates, the prob-lem we address is similar in nature to that of face segmentation considered by Arandjelovi´c and Zisserman [22], though with a notable difference. Namely, unlike faces which have a single and well defined axis of (approximate) symmetry [25], [26], [27], the statistical behaviour of the coin shape can be considered to be isotropic – deviations from the circular shape, effected in the minting process or thereafter, are equally likely to occur in all directions. A welcome consequence of this is
(a)
[image:7.612.364.526.53.437.2](b)
Fig. 6. Examples of the final segmentation result obtained by coarsely localizing a coin using our coherent elliptical shape assumption based method described in Section II-C3, and then refining the segmentation boundary using the Markov chain based statistical model detailed in Section II-D.
that the statistical properties of coin boundaries considered here, in contrast to those of faces, can be learnt independently of direction, thus allowing for more knowledge to be extracted from the same number of images.
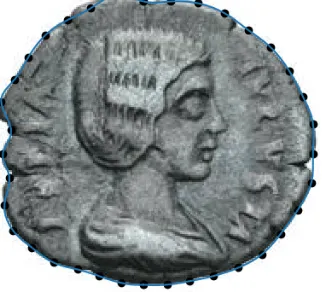
The second difference between the problem in this paper and that in the work of Arandjelovi´c and Zisserman is of a practical nature: unlike faces, coins can (and often are) readily imaged in controlled conditions with a uniform background. This allows us to collect large numbers of training images from which ground truth segmentation data can be obtained in a straightforward manner. As indicated earlier, this is the key reason for our use of the RIC-ACS corpus described in Section II-B1. Considering that the background in these images is uniform, the background is readily detected by applying the flood fill algorithm starting from the sides of an input image, as illustrated in Figure 7.
III. SUMMARY AND FUTURE WORK
non-Fig. 7. An example of a coin from our RIC-ACS corpus used for training our Markov chain based statistical model for fine coin boundary fitting. The uniform background of images in RIC-ACS facilitates simple segmentation by applying the flood fill algorithm starting from the sides of an image. The boundary is then sampled and the spatial relationships between consecutive samples used as ground truth training data.
professional, e.g. a hobby numismatist. We proposed a two stage approach which first uses a simple shape hypothesis to localize the coin roughly and then arrives at the final, accurate result by refining this initial estimate using a statistical model learnt from data. Our results on data collected ‘in the wild’ demonstrate excellent accuracy even when the proposed algorithm is applied on highly challenging images. A weakness of our approach which we intend to address in future concerns the potential confounding effect of elliptical elements in the background of a coin (e.g. from a coin holder). The use of colour [28] or superpixel based segmentation [29] are likely to be of help in this context.
REFERENCES
[1] H. Mattingly,The Roman Imperial coinage. Spink, 1966, vol. 7. [2] O. Arandjelovi´c, “Reading ancient coins: automatically identifying
denarii using obverse legend seeded retrieval.” In Proc. European Conference on Computer Vision, vol. 4, pp. 317–330, 2012.
[3] C. Fare and O. Arandjelovi´c, “Ancient Roman coin retrieval: a new dataset and a systematic examination of the effects of coin grade.”In Proc. European Conference on Information Retrieval, 2017.
[4] P. Davidsson, “Coin classification using a novel technique for learning characteristic decision trees by controlling the degree of generalization.” In Proc. International Conference on Industrial and Engineering Ap-plications of Artificial Intelligence and Expert Systems, pp. 403–412, 1996.
[5] M. N¨olle, H. Penz, M. Rubik, K. Mayer, I. Holl¨ander, and R. Granec, “Dagobert - a new coin recognition and sorting system.” In Proc. Internation Conference on Digital Image Computing, 2003.
[6] X. Pan and L. Tougne, “Topology-based character recognition method for coin date detection.” In Proc. IEEE International Conference on Image Analysis and Processing, 2016.
[7] R. Huber, H. Ramoser, K. Mayer, H. Penz, and M. Rubik, “Classi-fication of coins using an eigenspace approach.” Pattern Recognition Letters, vol. 26, no. 1, pp. 61–75, 2005.
[8] L. van der Maaten and P. Boon, “COIN-O-MATIC: A fast system for reliable coin classification.”In Proc. MUSCLE CIS Coin Recognition Competition Workshop, pp. 7–18, 2006.
[9] Y. Mitsukura, M. Fukumi, and N. Akamatsu, “Design and evaluation of neural networks for coin recognition by using GA and SA.”In Proc. IEEE International Joint Conference on Neural Networks, vol. 5, pp. 178–183, 2000.
[10] M. Zaharieva, M. Kampel, and S. Zambanini, “Image based recognition of ancient coins,” In Proc. International Conference on Computer Analysis of Images and Patterns, pp. 547–554, 2007.
[11] M. Kampel and M. Zaharieva, “Recognizing ancient coins based on local features.”In Proc. International Symposium on Visual Computing, vol. 1, pp. 11–22, 2008.
[12] O. Arandjelovi´c, “Automatic attribution of ancient Roman imperial coins.” In Proc. IEEE Conference on Computer Vision and Pattern Recognition, pp. 1728–1734, 2010.
[13] D. G. Lowe, “Distinctive image features from scale-invariant keypoints.” International Journal of Computer Vision, vol. 60, no. 2, pp. 91–110, 2003.
[14] H. Bay, A. Ess, T. Tuytelaars, and L. V. Gool, “SURF: Speeded up robust features.”Computer Vision and Image Understanding, vol. 110, no. 3, pp. 346–359, 2008.
[15] W. Rieutort-Louis and O. Arandjelovi´c, “Bo(V)W models for object recognition from video.”In Proc. International Conference on Systems, Signals and Image Processing, pp. 89–92, 2015.
[16] O. Arandjelovi´c, “Object matching using boundary descriptors.” In Proc. British Machine Vision Conference, 2012, DOI: 10.5244/C.26.85. [17] H. Anwar, S. Zambanini, and M. Kampel, “Coarse-grained ancient coin classification using image-based reverse side motif recognition.” Machine Vision and Applications, vol. 26, no. 2, pp. 295–304, 2015. [18] J. Canny, “A computational approach to edge detection.”IEEE
Trans-actions on Pattern Analysis and Machine Intelligence, vol. 8, no. 6, pp. 679–698, 1986.
[19] T. Atherton and D. Kerbyson, “The coherent circle hough transform,” In Proc. British Machine Vision Conference, 1993.
[20] O. Arandjelovi´c and R. Cipolla, “Achieving robust face recognition from video by combining a weak photometric model and a learnt generic face invariant.”Pattern Recognition, vol. 46, no. 1, pp. 9–23, 2013. [21] V. Ayala-Ramirez, C. H. Garcia-Capulin, A. Perez-Garcia, and R. E.
Sanchez-Yanez, “Circle detection on images using genetic algorithms.” Pattern Recognition Letters, vol. 27, pp. 652–657, 2006.
[22] O. Arandjelovi´c and A. Zisserman, “Automatic face recognition for film character retrieval in feature-length films.”In Proc. IEEE Conference on Computer Vision and Pattern Recognition, vol. 1, pp. 860–867, 2005. [23] O. Arandjelovi´c, “Contextually learnt detection of unusual motion-based
behaviour in crowded public spaces.”In Proc. International Symposium on Computer and Information Sciences, pp. 403–410, 2011.
[24] ——, “Discovering hospital admission patterns using models learnt from electronic hospital records.” Bioinformatics, vol. 31, no. 24, pp. 3970–3976, 2015.
[25] O. Arandjelovi´c and R. Cipolla, “Face set classification using maximally probable mutual modes.” In Proc. IAPR International Conference on Pattern Recognition, pp. 511–514, 2006.
[26] O. Arandjelovi´c, “Gradient edge map features for frontal face recog-nition under extreme illumination changes.”In Proc. British Machine Vision Conference, 2012, DOI: 10.5244/C.26.12.
[27] R. S. Ghiass, O. Arandjelovi´c, A. Bendada, and X. Maldague, “Ves-selness features and the inverse compositional AAM for robust face recognition using thermal IR.”In Proc. AAAI Conference on Artificial Intelligence, vol. 1, no. 0, pp. 357–364, 2013.
[28] O. Arandjelovi´c, “Colour invariants under a non-linear photometric camera model and their application to face recognition from video.” Pattern Recognition, vol. 45, no. 7, pp. 2499–2509, 2012.
[image:8.612.97.258.54.200.2]