c
Sharif University of Technology, December 2010 Research Note
Application of Endurance Time
Method in Performance-Based
Design of Steel Moment Frames
A. Mirzaee
1, H.E. Estekanchi
1;and A. Vafai
1Abstract. In this paper, application of the Endurance Time (ET) method in the performance-based design of steel moment frames is explained from a conceptual viewpoint. ET is a new dynamic pushover procedure that predicts the seismic performance of structures by subjecting them to a gradually intensifying dynamic action and monitoring their performance at various excitation levels. Structural responses at dierent excitation levels are obtained in a single time-history analysis, thus signicantly reducing the computational demand. Results from three analyses are averaged to reduce the random scattering of the results at each time step. A target performance curve is presented based on the required performance criteria, as a continuous function of an increasing intensity measure. The actual performance is then plotted against this target performance based on the results of ET analysis. The overall performance of the structure can be anticipated by comparing the target to actual performance at various intensity levels and the design can be improved based on the observed performance. Results are indicative of a good potential for application of the ET method in the performance-based design of steel moment frames.
Keywords: Dynamic pushover analysis; Performance-based design; Endurance time method; Intensifying accelerograms.
INTRODUCTION
Seismic performance of structures during strong earth-quakes is one of the most sensitive considerations, regarding their safety and economic requirements, to be set as their design criteria. Nowadays, usually the owners like to know the performance of their structures during an earthquake in order to make relevant eco-nomic decisions with a reasonable level of condence. This interest has led engineers to develop methods for designing structures that are capable of deliver-ing a predictable performance durdeliver-ing an earthquake. Performance-based earthquake engineering essentially consists of various procedures, whereby the structure is ensured for an acceptable seismic performance. The procedure involves identication of the hazard level for the site, development of conceptual, preliminary 1. Department of Civil Engineering, Sharif University of
Tech-nology, Tehran, P.O. Box 11155-9313, Iran. *. Corresponding author. E-mail: [email protected]
Received 31 January 2010; received in revised form 24 May 2010; accepted 2 October 2010
and nal structural designs, construction, and the maintenance of a building during its lifetime [1].
As per FEMA-302 NEHRP Recommended Pro-visions for the Seismic Regulations for New Buildings and Other Structures (BSSC, 1997) [2] and FEMA 273 NEHRP Guidelines for the Seismic Rehabilitation of Buildings (BSSC, 1997) [3], three Performance Levels (PLs) are considered. These are termed Immediate Oc-cupancy (IO), Life Safety (LS) and Collapse Prevention (CP). In the rst damage state Immediate Occupancy (IO), only minor structural damages are visible and no substantial reduction in building gravity or lateral resistance has occurred. In the Life Safety (LS) level, although signicant damage to the structure has occurred, structural elements have enough capability to prevent collapse. The Collapse Prevention (CP) level is dened as the post-earthquake damage state in which critical damages are occurred and the structure is on the verge of experiencing collapse [3]. Another practical notion is \Performance Objective", which consists of the specication of a structural performance level (e.g. collapse prevention, life safety, or immediate
occu-pancy) for a given level of seismic hazard. For example, in accordance with SAC 2000, ordinary buildings are expected to provide less than a 2% chance over 50 years of damage exceeding CP performance [1].
Evaluating the performance of existing struc-tures during an earthquake is another important task through which the operational situation of a structure during and after the event can be predicted. The per-formance evaluation consists of structural analysis with computed demands on structural elements compared against specic acceptance criteria provided for each of the various performance levels [4]. These acceptance criteria are really some limitations that are specied for various structural parameters (such as interstory drift and plastic rotation at joints) at dierent performance levels.
The performance evaluation might sound a straightforward process, but in reality it is not a simple undertaking. The erratic nature of earthquakes, uncertainties in the existent analysis methods and lack of enough information about the current strength of the structures are some factors that make the procedure intricate.
In this paper, a new methodology for extending the application of Endurance Time method into the area of performance-based design is introduced [5]. In the ET method, the structural responses at dierent excitation levels are obtained in a single time-history analysis, thus signicantly reducing the computational demand. So using the ET method and regarding the concepts of performance-based design, the performance of a structure at various levels of seismic hazard can be predicted in a single time-history analysis. In other words, one can estimate if the structure satises its performance objectives by only one time-history analysis. This characteristic of the ET method can best be utilized by extending its concepts to incorporate the basic concepts from performance-based design, which is the main purpose of this paper.
As will be explained in detail, in this proposed methodology, two new concepts of continuous \Per-formance Curves" and generalized \Damage Levels" are incorporated. Utilizing some equations, such as Gutenberg-Richter equations, the equivalent endurance times corresponding to each PL are obtained. A newly introduced \Target Performance Curve" or \Target Curve" representing the required performance as a continuous function of the excitation level is drawn. The denition of the mentioned curve is accomplished, assuming that the PLs are continuous, and, theoreti-cally, it is possible to consider an unlimited number of PLs between these three previously said levels in the form of a continuous curve. Then in order to have a more versatile numerical presentation of the PLs, an index is introduced called \Damage Level" (or \DL"), which is dened as a numerical index in the arbitrary
range of (0, 4) for the purpose of this study. Integer numbers in this interval are representatives of codied PLs, thus a convenient numerical equivalent is created for each PL. As will be explained, this index is used in order to draw a continuous target curve as the indicator of PLs.
The actual performance is then plotted against this target performance based on the results of ET analysis. The overall performance of the structure can be anticipated by comparing the target to the actual performance and the design can be improved based on the observed performance.
Finally, the performance of three steel moment frames is evaluated using the target curve, and the advantages and limitations of this procedure are ex-plained. As will be explained, by providing a good es-timate of structural performance at dierent excitation levels in each response-history analysis, the ET method can considerably reduce the huge computational eort required for the practical performance design of struc-tures. Also the concepts of \Performance Curve" and \Damage Level" provide a simplied presentation of performance analysis results that can be used as a tool in practical design cases.
Endurance Time Concept
Endurance Time (ET) is a new dynamic pushover procedure that predicts the seismic performance of structures by subjecting them to a gradually intensify-ing dynamic action and monitorintensify-ing their performance at dierent excitation levels. Structures that can endure the imposed intensifying acceleration function for longer are expected to be capable of sustaining stronger seismic excitation. In fact, since intensifying acceleration functions are used, the time axis in ET analysis can be correlated to the intensity of excita-tion [6].
The concept of the ET method can be physically presented by a hypothetical shaking table experiment. Three dierent frames with unknown seismic properties are xed on the table and the table is subjected to an intensifying shaking. After a short time, one of the frames (assume frame 1) fails. The second model will also fail as the amplitude of the vibration is increased. Assume that this happens to frame number three. Considering the times at which the models have been failed, and regarding that the lateral loads induced by the shaking table somehow correspond with earthquake loads, one can rank the three frames according to their seismic resistance. Hence, here, the endurance time of each structure against intensifying shaking can be considered as the seismic resistance criterion. In this hypothetical analysis, the second frame is the strongest or the best performer, the rst frame is the worst and the third's performance is somewhere in between [7].
Figure 1. demand/capacity of frames under acceleration function action [6].
In Figure 1, the schematic result of the above hy-pothetical analysis is presented. The demand/capacity ratio has been calculated for these frames as the maxi-mum absolute value of the endurance index during the time interval from 0.0 to t. Since a structure collapses when its demand/capacity ratio exceeds unity, the endurance time for each frame can be easily derived from this gure.
To start an ET time history analysis, after a representative model has been constructed, one should set a suitable damage measure and an appropriate ET accelerogram (Figure 2). The analysis results are usually presented by a curve in which the maximum absolute value of the damage measured in the time interval [0; t] (as given in Equation 1) corresponds to time.
(f(t)) max(Abs(f() : 2 [0; t]): (1) In the above equation, is a max Abs operator and f(t) is the desired structural response history, such as interstory drift ratio, base shear or damage index. For application of the ET method, intensifying accelerograms are generated in such a way as to pro-duce dynamic responses equal to the desired response spectrum (such as code's design spectrum) at a pre-dened time, tTarget [7]. If such an accelerogram were
designed and used, it would be possible to compare
Figure 2. Typical ET accelerogram.
the results of the ET time history analysis with those obtained from other analysis methods and, moreover, to compare the performance of dierent structures with dierent periods of free vibration. The rst suggested intensifying accelerograms for ET had a linear inten-sication scheme, i.e. the response spectrum of an ET accelerogram should intensify proportionally with time. Hence, the target acceleration response of an ET accelerogram can be related to the codied design acceleration spectrum as:
SaT(T; t) SaC(T ) t t
Target; (2)
where SaT(T; t) is the target acceleration response at
time t, T is the period of free vibration and SaC(T ) is
the codied design acceleration spectrum.
Using unconstrained optimization in the time domain, the problem was formulated as follows: Find ag(t)j 8 T 2 [0; 1);
t 2 [0; 1) ! (u(t)) = SaT(T; t): (3)
Or:
Minimize F (ag(t))= TZmax
0 tZmax
0
fAbs[Sa(T; t) SaT(T; t)]
+ Abs[Sd(T; t) SdT(T; t)]gdt dT; (4)
where ag is the ET accelerogram being sought,
SaT(T; t) and SdT(T; t) are the target acceleration
response and displacement response at time t, re-spectively, Sa(T; t) and Sd(T; t) are the acceleration
response and displacement response of the acceleration function at time t, respectively, is a weight parameter set to 1 and T is the period of free vibration [6].
It should be noted that based on the mentioned linear scheme, dierent sets of ET accelerograms can be generated according to their compatibility with dierent spectrums and in dierent ranges (linear range or nonlinear range). Each set consists of a group of intensifying acceleration functions (usually 3). For example, three acceleration functions named \ETA20d01-03" or briey \d series" in this study, are created in such a way that the response spectrum at t = 10 sec would be compatible with the INBC 2800 design spectrum and support nonlinear ranges.
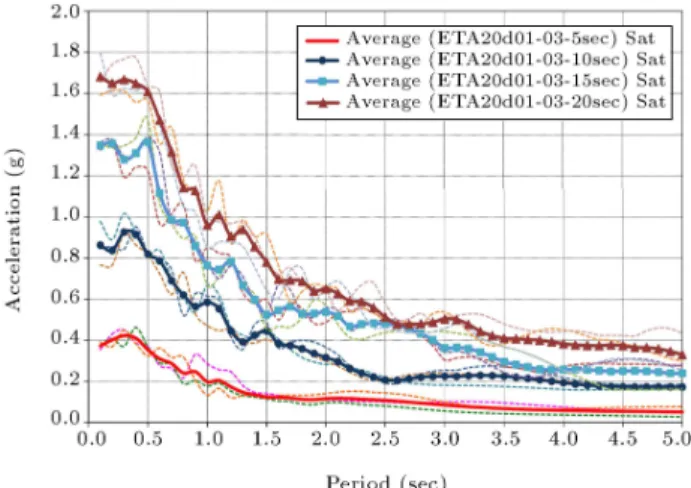
Sample response spectra generated using various time windows of ET accelerograms are shown in Fig-ure 3. In this gFig-ure, the curves are taken as average values between the results of three accelerograms of the d series. As can be seen in this gure, the response spectra produced by the ET acceleration function proportionally grow with time.
Figure 3. Acceleration response generated by ET accelerograms at various times.
Performance Levels
Performance levels are structural damage states that must be clearly dened as one of the rst steps in a performance-based design procedure. These levels are usually expressed as some distinct bands in the damage spectrum of a structure, and divide the damage status of structures according to the amount of damage to structural and nonstructural components. Moreover, some other concepts, such as cost, repair time and injury can also be related to performance levels [8].
Noting that the Performance Levels (PLs) are usually investigated at some specic levels of design earthquake motion, they can be thought of as a criteria for limiting values of measurable structural response parameters (such as interstory drift and absolute accel-eration and displacement) under each mentioned level of earthquake motion.
There are three performance levels considered by FEMA-273 [3]: Immediate Occupancy (IO), Life Safety (LS) and Collapse Prevention (CP), which were determined according to structural damages observed in earthquakes. For example, at the Immediate Occu-pancy Level, the building has experienced limited dam-age, since at the Collapse Prevention Level, damage is relatively extreme.
On the other hand, in FEMA-356 Prestandard and Commentary for the Seismic Rehabilitation of Buildings, four levels of probabilistic earthquake haz-ard are dened [9]. Combining these levels with the PLs, a table of Performance Objectives (POs) can be created. These objectives are dierent according to the type of structure that is to be built. For example, if a hospital is planned to be built, an appropriate PO might be that it is capable of meeting the LS performance level in an earthquake with a mean return period of 2475 years, and the IO performance level in an earthquake with a mean return period of 475 years. So if one wants to evaluate the performance of a specic
Table 1. Selected performance objective for a residential building.
Earthquake Having Probability of Exceedance
Mean Return Periods (years)
Performance Level
50% per 50 year 75 IO 10% per 50 year 475 LS 2% per 50 year 2475 CP
model of a hospital, he or she should rst analyze the model under two sets of considered earthquakes with the dened mean return periods separately and, then, see if the model satises the related code criteria for each PL.
Since the descriptions of the performance objec-tives are mostly qualitative, some performance criteria have been dened to bind these descriptions to engi-neering demand parameters, so that the performance objectives can be predicted in the analysis and design process [1]. In fact, these criteria are the rules and guidelines that must be met to ensure that the designed structure satises the performance objectives. In this research, the performance level shown in Table 1 is considered for a residential building.
TARGET AND PERFORMANCE CURVE As previously mentioned, the target curve is a concept by means of which the specic properties of the ET method can be readily put into use in the performance-based design procedure. Using the target curve is an appropriate way to evaluate the performance of structures in the ET method. In fact, the target curve will be used as the criteria curve for the ET response curve and the performance of a structure at dierent excitation levels can be evaluated by comparing the ET response curve with the target curve.
Since in the target response curve (or simply target curve), the target and the ET response curves will be compared in a single chart, the horizontal and vertical axes of the target curve should be dened, such as to match with the corresponded axes in the ET response curve, i.e. the time in seconds on the horizontal axis and a damage index on the vertical axis. On the other hand, the target curve should be inclusive of a relation between the performance levels and the corresponding performance criteria. The performance criteria are conceptually similar to the damage indices. Thus the challenge is to correlate the performance levels to the endurance times. In other words, the rst step in the process of creating the target curve is to identify the respective endurance time of each PL. To do so, the procedure shown in Figure 4 should
Figure 4. Target curve construction procedure.
be followed step by step. It is noticeable that this procedure is not an exact one. To have an exact calculation, it is needed to obtain the hazard curve for a special site and the PGA should be acquired according to that curve, but since the main purpose of this research is to illustrate the basic concepts of the proposed procedure, the following approximate procedure can be considered as appropriate. The corresponding magnitude of each earthquake hazard has been obtained, rst, using the Gutenberg-Richter relation as follows [10]:
log N = a bM; (5)
where:
N is the return period of earthquake (years); M is the magnitude of earthquake in Richter; b is called the \b-value", and is typically in the
range of 0.8-1.2
a is called the \productivity".
`a' and `b' are some parameters that severely depend on the properties of the region in which the earthquake had occurred. For Iran, the following form is recom-mended by Kaila [11]:
log N = 6:02 1:18M: (6)
After that, the Peak Ground Acceleration (PGA) must be acquired from magnitude. The following formula is suggested for Iran [12]:
ln(PGA) = 3:65 + 0:678M 0:95 ln(R); (7) where `PGA' is peak ground acceleration in cm/sec2,
`M' is magnitude in Richter and `R' is the distance to the fault in km, which is to be considered as 18 in this research.
This acceleration can be easily related to the endurance time. For this purpose, it is needed to specify which series of accelerograms are to be used. According to its conformability with the Iranian code 2800 standard [13], the `d' series of accelerograms (i.e. ETA20d01-03) has been chosen. Considering this series, the equivalent endurance times in ET records, corresponding to the 3 mentioned PGA, can be identied. To do so, it is enough to trace the times in the ET acceleration function at which the PGAs exceed the values of the PGAs corresponding to each PL.
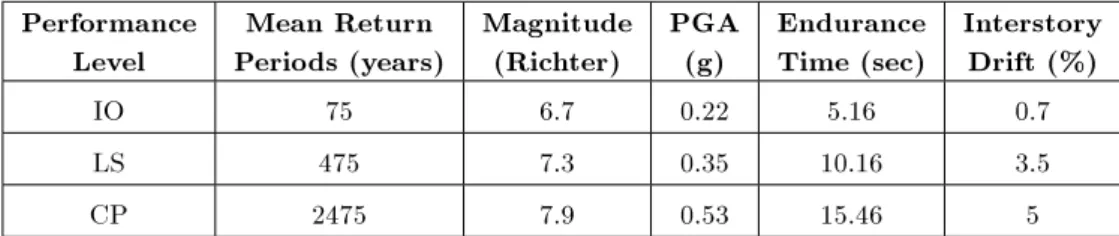
The results of the above procedure are shown in Table 2. In this table, the relevant interstory drift for each PL is indicated. These quantities are for steel moment frames and based on the FEMA-356 standard. Although these values are not intended in FEMA-356 to be used as acceptance criteria for evaluating the performance of structures, and are just some quantities which qualitatively indicate the behavior of structures at each level of performance, in this research, these values will be used as an index to show the limits of each performance level. Plastic rotation in beams is the other index which is used here to evaluate the performance of structures. To accurately evaluate the performance, one should obtain the values of plastic de-formations in all elements (including beams, columns, panel zones, braces etc.), and compare them to the acceptance criteria given in the FEMA-356 standard.
This means that the design of a typical structure should be such that if the `d' series of accelerograms were applied to the structure, it would be capable of meeting the IO performance level up to 4.14 sec, the LS performance level up to 10.21 sec and the CP performance level up to 19.11 sec.
Table 2. Endurance times related to each PL. Performance
Level
Mean Return Periods (years)
Magnitude (Richter)
PGA (g)
Endurance Time (sec)
Interstory Drift (%) IO 75 6.7 0.22 5.16 0.7 LS 475 7.3 0.35 10.16 3.5 CP 2475 7.9 0.53 15.46 5
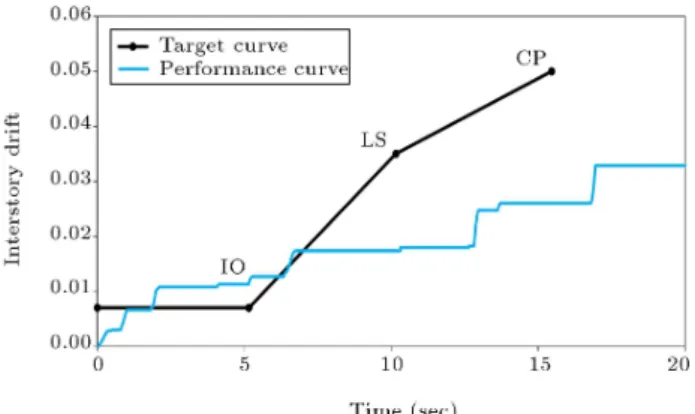
Figure 5. Target and existing performance curves.
Based on the above discussion, the target curve has been drawn and compared with a 3-story frame performance curve in Figure 5. In this gure, the limit of each performance level has been specied on the target curve. This frame is subjected to the `d' series of ET accelerograms and its interstory drift response is considered as the damage index. It should be noted that, while there are no criteria for damages below the IO level, this area is restricted by a horizontal line in the target curve.
Damage Level
The above target curve has some ambiguities and incompetency; one is that in order to evaluate the performance of structures, the performance of all el-ements should be checked by observing their plastic deformations and comparing the values with the ac-ceptance criteria. Since dierent limits are set on these parameters for various elements in each PL, it is dicult to compare the performance of dierent elements and clearly dene the critical one. Thus to accurately evaluate the performance of a structure, one should create a target curve for each mentioned index and element, and compare the related response curve with that target curve. In this way, even though the performance can be identied, the specication of the critical index is not a simple matter. A combined damage indicator has been dened for the purpose of this study that simplies the compilation of damage levels indicated by various indexes into one normalized numerical value. This index is named \Damage Level" or DL in this study. Another property of the damage level is that this dimensionless index creates a numer-ical presentation for performance levels, i.e. one could distinguish and compare the performance of dierent structures with only one number. Moreover, if two structures lie within the same PL, their performance can be still comparable with this index.
To specify such an index, ve performance levels are considered as OP (Operational), IO (Immediately Occupancy), LS (Life Safety), CP (Collapse
Preven-tion) and CC (Complete Collapse, an arbitrary point to extend the target performance curve beyond CP), which is a rather arbitrary level to simplify formulation. It should be noticed that OP and CC levels are just used as the limits of the performance and also the limits of the damage level. Until more research is available to dene the CC point, based on more rational criteria, it will be considered arbitrarily in such a way that the slope of the target performance curve before the CP level is maintained. This additional point is required in order to theoretically extend the performance curve beyond CP, and has no practical signicance in this study. The formulation proposed for the DL has been arranged is such a way as to assign an explicit number (preferably an integer) to each PL and use the determining parameters (such as interstory drift and plastic rotation) to compute the DL in a clear and understandable way.
An appropriate formulation, which satises the abovementioned considerations, can be expressed as follows:
DL =
n
X
i=1
max[i 1; min(; i)] i 1
i i 1 ; (8)
where is the related parameter-like drift, which should be computed from analysis and iis the
FEMA-356 Prestandard boundary of that parameter for each performance level. The values of i for interstory drift
and plastic rotation for each PL and the corresponding DLs are given in Table 3.
As can be seen in Table 3, the obtained DL will satisfy its purpose satisfactorily. Because, rstly, it denotes the performance level of the structure, secondly, since it is a number, it will satisfy the need to create a numerical presentation for performance levels, thirdly, it can present all parameters in a normalized form and this will ease future computations.
In light of the above discussion, the determining parameter like interstory drift (or plastic rotations) can be replaced by DL in the target curve. Likewise, the structure performance or response curve should be drawn according to this new index to comply with the target curve.
MODEL DESIGN
In order to demonstrate how the target curve can ease the visualization of the performance of structures, a set of 2D steel moment-resisting frames with a dierent number of stories and spans were selected and used in this research. These models consist of three-story one-bay, and seven-story three-bay frames that are designed in three alternatives (standard, weak and strong frames), and a twelve-story three-bay frame that is designed in two standard and strong alternatives.
Table 3. Assigning damage levels to performance levels. Performance Damage i i (Plastic Rotation)
Level Level (Drift) Case (a) Case (b) Case (c) IO 1 0.7 1 0.25 Interpolation
LS 2 3.5 6 2 is
CP 3 5 8 3 required
CC 4 7 11 6
* Case (a): bf=2tf< 52=pFyeand h=tw< 418=pFye,
Case (b): bf=2tf > 65=pFyeor h=tw> 640=pFye,
Case (c): Other.
** CC is an auxiliary point included so that the performance curve can be theoretically extended beyond CP.
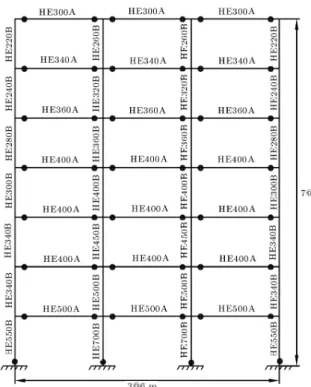
These frames are designed according to the AISC-ASD89 design code. To compare the performance of the frames with varying seismic resistance, the standard, weak and strong frames have been designed using base shears equal to 1, 0.5 and 1.5 times the codied base shear, respectively. As an example, the geometry and section properties of the seven-story three bay frame are shown in Figure 6. In this gure, the black circles stand for the plastic hinges and show that the failure mechanism follows the strong column-weak beam concept. As can be seen in Figure 7, these hinges have been modeled as a rotational spring with a moment-rotation curve shown in this gure. The capital letters in this gure (A to E) determine the boundaries of various behaviors of the hinge model.
Figure 6. Standard seven-story frame geometry and sections.
Figure 7. Plastic hinge model and its generalized force-deformation curve.
ANALYSIS RESULTS
The modeling and nonlinear analysis were done with Opensees software [14] Nonlinear models of the frames are prepared by using the beam element with nonlinear distributed plasticity. In this research, the damping ratio is assumed to be 0.05 of the critical value and P eects have been included in the nonlinear analysis. Applicability of the ET method in nonlinear analysis and the acceptability of its approximation in estimating various damage indexes have already been studied [6,15,16]. A similar level of approximation is considered to be adequate for the purpose of this study. The drift and plastic rotation responses of frames were obtained and converted to the DL index, ac-cording to Equation 8. Then, the ET response curve (performance curve) of each frame is plotted for each aforementioned parameter's related DL, separately. In Figure 8, the response curve for the plastic rotation and drift in a 3-story standard frame is depicted. As illustrated in this gure, using the concepts of endurance time and DL, it is possible to compare
Figure 8. Performance curves for plastic rotation and drift in frame F3s1b.
the situation of various parameters, such as plastic rotation and drift, and identify the critical parameter in any seismic intensity. For example, in a 3-story standard frame, as can be seen in Figure 8, drift is the critical parameter in low-intensity ground motions, but plastic rotation is critical at high-intensities. Note that the nal performance curve for each frame should be created considering the maximum value of DL and considering both the drift and rotation (or any other parameters that need to be considered based on the design criteria). The nal DL response curve (or performance curve) for three alternatives of a 3-story frame is shown in Figure 9. Using this gure, one can easily study and compare the performance of these three alternatives in various seismic intensities. For example, according to Figure 9, it can be concluded that all three alternatives fail the criteria of the IO per-formance level, but remain in the safe region of LS and CP performance levels; the standard frame performs similar to the weak frame at low-intensities, but its performance resembles the strong frame performance as seismic intensity increases.
Figure 10 shows the performance curves of three
Figure 9. Performance curves for 3-story frames.
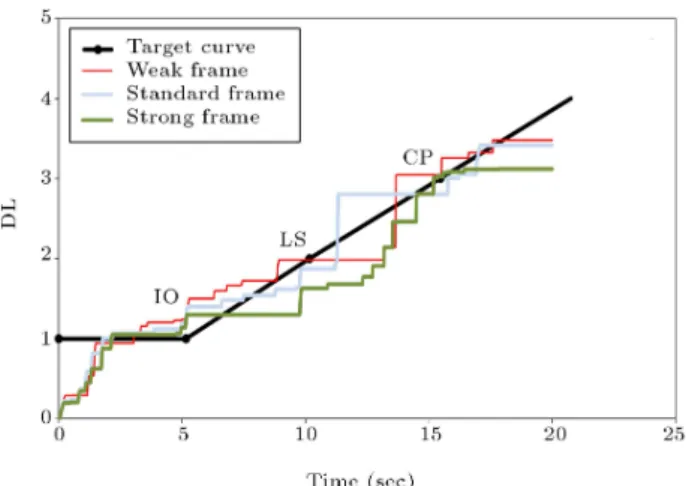
Figure 10. Performance curves for 7-story frames.
types of 7-story frame. A good performance of the strong frame in comparison with two other frames can be easily observed in this gure. Moreover, it can be seen that the weak frame lies above the target curve almost at all times. The behavior of 12-story frames can be evaluated with a similar procedure.
Using the target curve, the performances of strong frames with various numbers of stories and bays can also be compared with each other. Such a comparison has been done for three strong frames with 3, 7 and 12 stories (Figure 11). Although all these three frames were designed on the basis of 1.5 times the codied base shear, their performance is not similar. The twelve-story frame is the best performer and the three-twelve-story frame is the worst one in this study.
To show and verify the versatility of the target curve, the 3-story standard frame has been subjected to some earthquake records and its performance is eval-uated by the target curve. To have a good evaluation, 7 earthquake records have been selected from the FEMA-440 recommended records and scaled in such a way as to create 7 modied records at each performance level (i.e. 21 records). To do so, some correction factors are
Table 4. Properties of used records and the correction factors.
No Record HP LP DT Name CF for CP CF for LS CF for IO PGA 1 Northridge 24278 0.12 23 0.02 NRORR360 4.035 2.222 1.053 0.171 g 2 Landers 12149 0.07 23 0.02 LADSP000 2.664 1.467 0.695 0.259 g 3 Loma Preita 1652 0.2 41 0.005 LPAND270 1.575 0.868 0.411 0.438 g 4 Loma Preita 47006 0.2 45 0.005 LPGIL067 2.255 1.242 0.588 0.306 g 5 Morgan Hill 57383 0.1 27 0.005 MHG06090 1.933 0.504 0.504 0.357 g 6 Loma Preita 58065 0.1 38 0.005 LPSTG000 2.828 1.577 0.615 0.244 g 7 Loma Preita 58135 0.2 40 0.005 LPLOB000 1.342 0.739 0.35 0.514 g
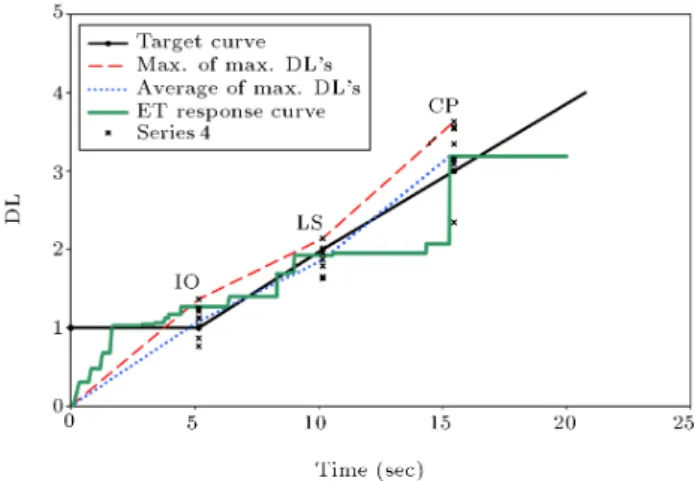
required to be computed and applied to each record. The correction factors for each PL and each record are the ratio of PL related PGA (see Table 2) to record's PGA. In Table 4, the properties of used records and the mentioned correction factors for each PL are indicated. Thus, 21 time history analyses have been per-formed and the responses of the frame are calculated in the form of the DL index. To provide a logical overview of the performance of the standard frame, it is recommended that the maximum and average of the DL indices in each PL be considered and compared to those related to ET analysis results. Figure 12 shows the aforementioned comparison. In this gure, the crosses stand for the results of 21 time history analyses. As can be seen in this gure, the average values are compatible with ET analysis results, i.e. the performance estimated by the ET method is consis-tent with that of time history analysis using ground motions. Now, it seems that if a line connects the average (or maximum) values, the performance of the frame will be coincident with this line at various seismic intensities. In fact, this line is similar to the familiar performance curve. However, it should be mentioned that selecting the optimal form of the connecting curve requires further research in this area.
Figure 12. Comparison of ET and earthquakes results at equal PGA for 3-story standard frames.
CONCLUSION REMARKS
In this paper, a methodology is proposed in order to extend the application of the Endurance Time method (ET) to the performance-based design of structures. Application of the Endurance Time method in the performance-based design of steel frames is investigated from a conceptual viewpoint. In the ET method, structures are subjected to an intensifying acceleration function, thus an estimate of the structural response at dierent levels of excitation is obtained in a single response history analysis, thus considerably reducing the required computational eort. The concept of performance levels has been extended from discrete presentation to a continuous target performance curve. This target performance curve, while theoretically more attractive, turns out to be quite versatile when investigating the ET analysis results, as shown in the paper. In order to be able to combine several dierent performance criteria into a single numerical performance index, a generalized Damage Level (DL) index has been proposed. The DL index proposed in this paper creates a versatile numerical representation of performance levels and, also provides a uniform index to express a performance of structures that incorporates various parameters (such as drift, plas-tic rotation etc.). Furthermore, the target curve is an eective tool for estimating the performance of structures under various seismic intensities by the ET response curve. This curve can be used to anticipate the seismic performance of structures subjected to earthquakes. The target performance curve has a good potential to be used in the performance-based design of structures. The concepts of Performance Curve and Damage Level introduced in this paper lay the necessary foundation for a more versatile application of the ET method in the practical performance-based design of structures. The analysis results are shown to be consistent with those obtained using ground motions scaled to represent particular excitation levels. It should be noted that extensive research in this area is required in order to assess the precision and level
of condence that can be expected from the proposed methodology.
ACKNOWLEDGMENTS
The authors would like to thank Sharif University of Technology, Research Council, and the Structures and Earthquake Engineering Center of Excellence for their support of this Research.
NOMENCLATURE
Abs absolute value function ag(t) ET acceleration function
bf ange width
CC complete collapse
CP collapse prevention performance level F (ag) optimization target function
Fye yield strength
IO immediate occupancy performance level
LS life safety performance level
M earthquake magnitude
max maximum of the values
N earthquake mean return period PGA peak ground acceleration R distance to the fault Sa spectral acceleration
Sa(T; t) acceleration response for period T at
time t
Sa(T ) acceleration response as a function of
period T
SaC(T ) codied design acceleration spectrum
SaT(T; t) target acceleration response for period
T at time t
Sd(T; t) displacement response value for period
T at time t
SdT(T; t) target displacement response value for
period T at time t T free vibration period (sec)
t time
tf ange thickness
tTarget target time (= 10 sec in this paper)
Tmax maximum free vibration period (sec)
to be considered in the optimization tmax time corresponding to the end of
acceleration function
weighting factor in optimization target function (= 1.0 in this study)
i determinant parameter (drift ratio or
plastic rotation)
(f(t)) endurance time analysis result equal to max(Abs(f(t1))) : t1 2 [0; t]
j such that
8 for all values
REFERENCES
1. Krawinkler, H. and Miranda, E. \Performance-based earthquake engineering", in Earthquake Engineering: From Engineering Seismology to Performance-Based Engineering, Y. Bozorgnia and V.V. Bertero, Eds., CRC Press, USA (2004).
2. FEMA-302 \NEHRP recommended provisions for seis-mic regulations for new buildings and other struc-tures", Part 1 - Provisions, prepared by the Building Seismic Safety Council for the Federal Emergency Management Agency, Washington, D.C. (1997). 3. FEMA \NEHRP guidelines for the seismic
rehabili-tation of buildings", FEMA-273, Federal Emergency Management Agency, Washington, D.C. (1997). 4. Humberger, R.O. \A framework for performance-based
earthquake resistive design", EERC-CUREe Sympo-sium in Honor of Vitelmo V. Bertero, Berkeley, Cali-fornia (1997).
5. Estekanchi, H.E., Vafai, A. and Sadeghazar, M. \En-durance time method for seismic analysis and design of structures", Scientia Iranica, 11(4), pp. 361-370 (2004).
6. Riahi, H.T. and Estekanchi, H.E. \Seismic assessment of steel frames with endurance time method", Journal of Constructional Steel Research, 66(6), pp. 780-792 (2010).
7. Estekanchi, H.E., Valamanesh, V. and Vafai, A. \Ap-plication of endurance time method in linear seismic analysis", Engineering Structures, 29(10), pp. 2551-2562 (2007).
8. Grecea, D., Dinu, F. and Dubina, D. \Performance criteria for MR steel frames in seismic zones", Journal of Constructional Steel Research, 60, pp. 739-749 (2004).
9. FEMA-356 \Prestandard and commentary for the seis-mic rehabilitation of buildings", Federal Emergency Management Agency, Washington, D.C. (2000). 10. Mohraz, B. and Sadek, F. \Earthquake ground motion
and response spectra", in Earthquake Engineering Handbook, W.F. Chen and C. Scawthorn, Eds., CRC Press, Boca Raton, Florida (2003).
11. Kaila, K.L. and Narian, H. \A new approach for the preparation of quantitative seismicity maps", Bull. Seis. Soc. Amer., 61, No. 1275-91 (1971).
12. Ghodrati Amiri, G., Mahdavian, A. and Manouchehri Dana, F. \Attenuation relationships for Iran", Journal of Earthquake Engineering, 11, pp. 469-492 (2007). 13. BHRC. Standard No. 2800 \Iranian code of practice for
seismic resistance design of buildings", In: Permanent committee for revising the Iranian code of practice for
seismic resistant design of buildings. Tehran (Iran): Building and Housing Research Center, 3rd Ed. (2005). 14. Pacic Earthquake Engineering Research Center (PEERC), 2004 \Open system for earthquake en-gineering simulation", (OpenSees), Berkeley, CA: Pacic Earthquake Engineering Research Center (http://opensees.berkeley.edu/).
15. Riahi, H.T., Estekanchi, H.E. and Vafai, A. \Appli-cation of endurance time method in nonlinear seismic analysis of SDOF systems", Journal of Applied Sci-ences, 9(10), pp. 1817-1832 (2009).
16. Estekanchi, H.E., Arjomandi, K. and Vafai, A. \Esti-mating structural damage of steel moment frames by endurance time method", Journal of Constructional Steel Research, 64(2), pp. 145-155 (2008).
APPENDIX Equations
(f(t)) max(Abs(f() : 2 [0; t]); (A1)
SaT(T; t) SaC(T ) t t
Target; (A2)
Find ag(t)j8T 2 [0; 1); t 2 [0; 1) ! (u(t))
= SaT(T; t); (A3)
Minimize F (ag(t)) = TZmax
0 tZmax
0
fAbs[Sa(T; t)
SaT(T; t)] +
Abs[Sd(T; t) SdT(T; t)]gdt dT; (A4)
log N = a bM; (A5)
log N = 6:02 1:18M; (A6)
ln(PGA) = 3:65 + 0:678M 0:95 ln(R); (A7)
DL =Xn
i=1
max[i 1; min(; i)] i 1
i i 1 : (A8)
BIOGRAPHIES
Amin Mirzaei was born in 1983. He was a student at the Allameh Helli Secondary and High School (aliated to NODET; the National Organization for
Developing Exceptional Talents) in Kerman, Iran, from 1995 to 2001. He received a B.S. degree in Civil En-gineering and a M.S. degree in Structural EnEn-gineering from Sharif University of Technology (SUT), Tehran, Iran, in 2005 and 2007, respectively. His M.S. degree thesis was entitled \Application of Endurance Time Method in Performance-Based Design of Steel Moment Frames", which he successfully defended in September 2007. He is currently a Ph.D. candidate in Structural and Earthquake Engineering in the Department of Civil Engineering at SUT.
His research interests include: Dynamic Anal-ysis of Structures using Endurance Time Method, Performance-Based Design, Seismic Behavior of Steel Moment Frames, Rehabilitation of Steel Structures and Evaluating the Seismic Performance of Structures.
He was ranked 6th in the 12th National Civil Engineering Olympiad, 2007, in Iran and also in the same year authored `Fluid Mechanics' for M.S. Candidates; a Dibagaran Publication, in Tehran. Homayoon Estekanchi is the Associate Professor of Civil Engineering at Sharif University of Technology (SUT), Tehran, Iran. He received his Ph.D. in Civil Engineering from SUT in 1997, where he is now a faculty member. He is a member of the Iranian Construction Engineers Organization, ASCE, Iranian Inventors Association and several other professional organizations. His research interests include a broad area of topics in Structural and Earthquake Engi-neering with a special focus on the design of Tall Buildings and Industrial Structures. He regularly teaches the design of `Steel Structures', `Tall Buildings' and `Industrial Structures' at SUT. In recent years, his research interests mainly focus around the development of a new seismic analysis and design procedure called the `Endurance Time Method', which he proposed in 2000, the area in which he has published various research articles in collaboration with other colleagues and students.
Abolhassan Vafai, Ph.D., is a Professor of Civil Engineering at Sharif University of Technology (SUT), Tehran, Iran. He has authored/co-authored numerous papers in dierent elds of engineering, including: Applied Mechanics, Biomechanics and Structural En-gineering (steel, concrete, timber and oshore struc-tures). He is also active in the area of higher education and has delivered lectures and published papers on the `Challenges of Higher Education', the `Future of Science and Technology', and `Human Resources Development'.
![Figure 1. demand/capacity of frames under acceleration function action [6].](https://thumb-us.123doks.com/thumbv2/123dok_us/8394789.2230390/3.892.68.416.146.377/figure-demand-capacity-frames-acceleration-function-action.webp)