Supporting Material
A New Method for Measuring Edge Tensions and Stability of
Lipid Bilayers: Effect of Membrane Composition
A New Method for Measuring Edge Tensions
and Stability of Lipid Bilayers:
Effect of Membrane Composition
(Supporting Material)
Thomas Portet
Institut de Pharmacologie et de Biologie Structurale, CNRS UMR 5089, Universit´e Paul Sabatier, Toulouse, France
and
Laboratoire de Physique Th´eorique,
CNRS UMR 5152, Universit´e Paul Sabatier, Toulouse, France.
Rumiana Dimova 1
Max Planck Institute of Colloids and Interfaces, Potsdam, Germany.
November 1, 2010
1Corresponding author. Address: Max Planck Institute of Colloids and
In-terfaces, Science Park Golm, 14424 Potsdam, Germany. Tel.: +49 331 567 9615, Fax: +49 331 567 9612, E-mail: [email protected]
1
Theoretical considerations of pore dynamics
The description below follows the theoretical model introduced in (1). We consider a spherical vesicle of initial radiusRin under tensionσ0, embeddedin a medium of bulk viscosityη. When the tension of the vesicle increases, a pore can be created, which relaxes the tension. Thus, we have three dynamic variables possibly coupled to each other: the current vesicle radius
R, the membrane tension σ, and the pore radiusr. A set of three equations can fully describe the system evolution. Considering the stretching of the membrane by the tensionσ and assuming that the total amount of lipid in the vesicle is conserved during the opening and closing of the pore, from the pore and vesicle areas we obtain:
σ σ0
= 1− r
2 r2 c
−4(R2in−R2) r2
c
, (1)
where rc2 = 4(R2in −R20), and R0 denotes the radius of the vesicle under
zero tension. The second equation is given by pore dynamics in vesicles and reads (1):
ηS
˙
r
r =σ− γ
r , (2)
where ηS denotes the surface viscosity of the lipid membrane (note that it
is related to the membrane ’bulk’ viscosityηm via ηS=dηm wheredis the
membrane thickness),γ is the edge tension, and ˙r is the derivative ofr with respect to timet. The third and last equation governing the vesicle radius
R is derived considering the flux of internal solution through the pore and estimating the leakout velocity by equating the Laplace pressure and the shear stresses involved. It reads
2σ
3ηRr
3 =−4πR2R ,˙ (3)
η being the bulk viscosity of the surrounding medium. We now dispose of a set of three equations governing the evolution of the three variables r,R
and σ. Brochard-Wyart et al. carried out a detailed numerical study of this system of equations, providing analytical solutions for some limiting cases (1). Here, we focus on the results for the limit corresponding to our experiments. In this limit, there are four consecutive stages in the pore life: (i) a growth period; (ii) reaching of the maximal pore radius; (iii) a quasi-static leakout regime during which r decreases slowly; and (iv) the last stage of fast closure. These two later stages can be distinguished in the data shown in Fig. 2 in the main text. The pore spends the majority of its
2
lifetime in the third regime of slow closure, which we use to determine the edge tension. If the pore radius changes very slowly, we can make the quasi-static approximationrσ ≈γ from Eq. 2. This approximation is reasonable if we evaluate the left-hand-side (LHS) term in Eq. 2. The surface viscosity of the membraneηS is on the order of 5×10⁻⁹ Ns/m (2). The rate of pore
closing ˙r is approximately 5×10⁻⁵ m/s as seen from our experiments: a pore of radius r = 5 µm closes within about 100 ms. Thus, the LHS term in Eq. 2 is on the order of 5×10⁻⁸ N/m. The term γ/r on the right-hand side of the equation is at least on the order of 10 pN/5 µm, i.e., 2×10⁻⁶ N/m. The LHS term is negligible compared to this term, which justifies the assumption that r changes slowly. The membrane tension is also not expected to vary significantly as long as the pore is present in the vesicle. We differentiate Eq. 1 with respect to time to obtain
rr˙≈4RR .˙ (4)
Inserting Eq. 4 andrσ≈γ into Eq. 3 finally yields
R2r˙ r ≈ −
2γ
3πη . (5)
If we integrate this equation assuming R stays constant (in section 5 we justify this assumption), we find that the quantityR2ln(r) should decrease
linearly as a function of timetwith a slopea=−2γ/(3πη). We monitor the evolution of the pore radius r and measure the vesicle radius R. From the linear part of R2ln(r) corresponding to the slow closure stage we extract
the slope a. The edge tension γ is then obtained from the relation γ =
−(3/2)πηa.
2
Transmembrane potential and lysis tension
Lipid bilayers are impermeable to ions. In the presence of an electric field, charges accumulate at the bilayer interface building the transmembrane po-tential, ∆ψ, across the membrane. At time t, the potential induced on a nonconductive membrane by a DC pulse is given by (3):
∆ψ(t, θ) = 3
2R|cos(θ)|E
1−exp
− t τc
, (6)
where R is the vesicle radius, E is the magnitude of the applied field, θ is the angle between the vesicle surface normal and the direction of the electric field, and τc is the membrane charging time, given by (3):
τc =RCm
1
λin
+ 1
2λex
. (7)
Here,Cm is the membrane capacitance, Cm≈1µF/cm2 for lipid
mem-branes (4), and λin and λex are the conductivities of the solutions in the
vesicle interior and exterior, respectively. For our experiments in solutions with low conductivity and for explored vesicle radii in the range 10-40 µm,
τc lies between 50µs for small GUVs and 250 µs for the larger ones.
Above some critical transmembrane potential ∆ψc, the membrane
po-rates, becoming conductive and permeable. The relatively short charging time of our system implies that the critical transmembrane potential is reached already during the pulse, i.e., poration occurs within the first couple of milliseconds. This supports our hypothesis that the observed macropores originate from coalescence of smaller suboptical pores. At the time of maxi-mally expanded pore, the critical transmembrane potential can be estimated using Eq. 6. Since the charging time (at most 250µs) is much shorter than the time at which the maximally expanded pore is observed (several millisec-onds), the exponential term can be ignored. We evaluate the transmembrane potential in the area around the edge of the pore replacingθ with the angle
θp delimiting the pore boundaries, see also section Electroporation
thresh-olds and stability of membranes with various compositions in the main text. This is a rather crude approximation, which probably leads to slightly over-estimating the critical transmembrane potential ∆ψc, but as discussed in
the main text, the values obtained with this procedure agree well with data reported in the literature.
The electroporation phenomenon can also be understood in terms of a stress in the bilayer created by the electric field. The transmembrane potential induces an effective electrical tensionσel, as defined by the Maxwell
stress tensor (4, 5). This tension is given by
σel=m0
h
2h2 e
∆ψ2 , (8)
wherem and0 are the membrane and vacuum permittivities, respectively, his the total bilayer thickness andhe is the dielectric thickness. For vesicles
with some initial tensionσ0, the total tension reached during the pulse is
σ=σ0+σel . (9)
The total membrane tension cannot exceed the tension of rupture, also known as lysis tension. For lipid membranes, the lysis tension σlys is on
4
the order of 5 mN/m (4, 6). Neglecting the initial membrane tension σ0
(see next paragraph), we evaluatedσlys∼=σel(∆ψc) for different membrane
compositions using Eq. 8. The values of the total bilayer thickness,h, were taken from (7, 8). For the values of the dielectric thickness we have taken
he = h− 0.99 nm, which accounts for the PC headgroup region (9). For
the membrane permittivity we used m = 2, even though m = 4 is also
reported. If the latter number is taken, the estimates for the lysis tension are twice higher than those given in Table 1. The values ofσlys exhibit the
same trends as the critical poration potentials.
Lipid EggPC DOPC DOPC:cholesterol SOPC
h, nm 3.69 3.67 3.90* 3.91
he, nm 2.70 2.68 2.91 2.92
∆ψc, mV 920 950 680 1100**
σlys, mN/m 3.79 4.08 1.89 4.91
Table 1: Values for the total thicknessh, the membrane dielectric thickness
he and the measured critical poration potential ∆ψc for various lipid
com-positions. The lysis tensionσlys was estimated on the basis of Eq. 8. *The
value forhis only approximate because it corresponds to DOPC:cholesterol 4:1 mole fraction. **The value of ∆ψc measured for SOPC was obtained
from (4).
From Eqs. 8 and 9, it is clear that vesicles with high initial tension would porate at lower transmembrane potential. For the vesicles made of DOPC:cholesterol 5:1, we observe lower poration threshold as discussed in the main text. Vesicles with this composition, however, did not exhibit higher initial tensions as examined with fluctuation analysis (10) suggesting that the measured critical transmembrane potentials and the estimated lysis tensions were not influenced by the initial tensionσ0.
From Eqs. 6, 8 and 9, it is obvious that the membrane tension during the pulse evolves with time and has an angular dependence on the tilt angle
θ along the vesicle surface. This nonuniform tension does not allow us to apply the theoretical model developed in (1) to the initial stages of pore opening and stabilization in our system. However, with the pores formed in the vesicle, the membrane tension relaxes and thus, it is not expected to influence the slow pore closing stage.
3
Image analysis
The image processing procedure was divided into two stages: membrane detection and pore size measurement.
In the first stage, we performed an image background correction using the background subtraction rolling-ball algorithm (11). We then located the membrane position using a common Sobel edge detector to highlight sharp changes in the intensity. Phase contrast images of sucrose-loaded GUVs in glucose environment show a bright halo around the vesicle, and a dark region in the inner proximity of the bilayer; see the phase contrast snapshots in Fig. 1 in the main text. The membrane is situated at the interface between these two regions, where the amplitude of the intensity gradient is the highest. When the membrane is porated, mixing of solutions occurs in the pore area, leading to lost intensity gradient due to the absence of the bilayer or the presence of a pore. The last step in the membrane detection stage is the conversion of the image to a binary one, whereby the threshold value is calculated using the classical Isodata algorithm (12). In the binary image, the outer white circle corresponds to the boundary between the bright halo surrounding the vesicle and the gray background of the external solution, while the inner one indicates the membrane position; see the binary images in Fig. 1 in the main text. As we consider pores located on the cathode-facing side of the vesicle, in each image we analyzed only the region containing this vesicle hemisphere. The image processing tasks described above were performed with ImageJ (National Institutes of Health, Bethesda, MD).
Pore radius measurements were carried out using an appropriate custom made algorithm, based on cluster detection and distance measurements be-tween extremal cluster pixels. The accuracy of the procedure was checked on several individual cases.
4
Case of several pores
Sometimes, several pores can be created in a single vesicle. Here, we justify the validity of Eq. 5 in this case. Let us assume we have a GUV of size R
containing two pores of radiir1 and r2. Eqs. 1 and 3 are thus modified and
now read:
σ σ0
= 1−r
2 1 r2 c
−r22 r2 c
−4(R2in−R2) r2
c
(10) and
6
2σ
3ηR(r 3
1+r23) =−4πR2R .˙ (11)
We also have two equations analogous to Eq. 2 for both radii r1 and r2,
which leaves us with a set of four equations and four unknowns. Making the assumptions described in section 1, we find the same law for the closure dynamics of both pores. Therefore we conclude that the theoretical model of Brochard-Wyart et al. (1) for the slow closure stage is applicable to vesicles with several pores. This conclusion is indeed supported by the observed linear time dependencies of our data forR2ln(r) for vesicles with more than one pores. It is further corroborated by the coherence and the reproducibility of our results.
5
Decrease in the vesicle size
R
during
electropo-ration
When exposed to millisecond electric pulses, liposomes can shrink (13). As seen in Fig. 1 in the main text, the vesicle radius can decrease by up to about 10 %. This observation raises the question whether the approximation for constant vesicle radius is reasonable.
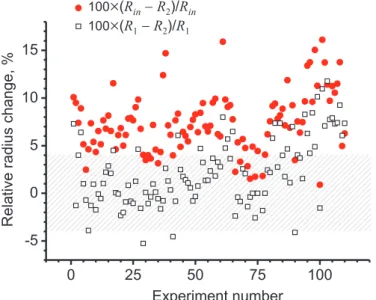
Let us denote the initial radius of the GUV before the pulse with Rin,
and with R1 and R2 the vesicle radii at the beginning and at the end of
the stage of linear pore closure (LPC), respectively. In the experiments,
R2 was measured to be equal to the final vesicle radius after the pore has
completely closed. Inspection of the three radiiRin, R1 and R2 for all 110
experiments reported in the main text showed that the major decrease in the vesicle size occurs before the LPC stage. In the supplementary Fig. 1 we plotted normalized radii changes for all studied lipid vesicles. Over the whole observation time interval, the vesicle radii decrease by about 7.5 % on the average, while the decrease during the LPC stage is only about 2.2 % on the average. In a large fraction of the measurements (33 out of 110),
R1−R2 is negative suggesting an increase in the vesicle radius during the
LPC stage. However, this scatter, including the negativeR1−R2 values, is
associated with limits imposed by microscopy resolution, i.e, by the accuracy with which the radius is measured. One pixel represents 0.7528µm, implying that an error of 1 pixel in the vesicle size measurement leads to a variation of about 4 % for a vesicle with a radius of 20 µm (the variation is even higher for smaller vesicles). Thus, the radius change measured during the LPC stage, R1−R2, is within the measurement accuracy implying that for
the negative data points, R1 −R2 ∼= 0. Therefore, the vesicle size can be
assumed constant during this stage. In the data analysis, we used the values ofR2 for determining the edge tensions.
The error in the determination of the vesicle radius, ∆R, is approxi-mately 2-4 %. The deviation in the measured value of the edge tension arising from this imprecision, ∆γ, is then on the order of
∆γ γ = 2
∆R
R . (12)
yielding a relative error of 4-8 % for γ. The standard errors in our experi-ments were of this order.
References
1. Brochard-Wyart, F., P. de Gennes, and O. Sandre, 2000. Transient pores in stretched vesicles: role of leak-out. Physica A278:32–51. 2. Dimova, R., C. Dietrich, A. Hadjiisky, K. Danov, and B. Pouligny, 1999.
Falling ball viscosimetry of giant vesicle membranes: finite-size effects.
Eur. Phys. J. B 12:589–598.
3. Kinosita, K., I. Ashikawa, N. Saita, H. Yoshimura, H. Itoh, K. Na-gayama, and A. Ikegami, 1988. Electroporation of cell-membrane visual-ized under a pulsed-laser fluorescence microscope. Biophys. J. 53:1015– 1019.
4. Needham, D., and R. M. Hochmuth, 1989. Electro-mechanical perme-abilization of lipid vesicles - Role of membrane tension and compress-ibility. Biophys. J.55:1001–1009.
5. Riske, K. A., and R. Dimova, 2005. Electro-deformation and poration of giant vesicles viewed with high temporal resolution.Biophys. J.88:1143– 1155.
6. Olbrich, K., W. Rawicz, D. Needham, and E. Evans, 2000. Water perme-ability and mechanical strength of polyunsaturated lipid bilayers. Bio-phys. J.79:321–327.
7. Pan, J. J., S. Tristram-Nagle, and J. F. Nagle, 2009. Effect of cholesterol on structural and mechanical properties of membranes depends on lipid chain saturation. Phys. Rev. E 80.
8
8. Nagle, J. F., and S. Tristram-Nagle, 2000. Structure of lipid bilayers.
Biochim. Biophys. Acta 1469:159–195.
9. Private communications with S.
Tristram-Nagle. For more reference sources, see also
http://lipid.phys.cmu.edu/papers08/SummaryofAreas.ppt .
10. Gracia, R. S., N. Bezlyepkina, R. L. Knorr, R. Lipowsky, and R. Dimova, 2010. Effect of cholesterol on the rigidity of saturated and unsaturated membranes: fluctuation and electrodeformation analysis of giant vesi-cles. Soft Matter 6:1472–1482.
11. Sternberg, S., 1983. Biomedical image processing.IEEE Comput.16:22– 34.
12. Ridler, T. W., and S. Calvard, 1978. Picture thresholding using an iterative selection method. IEEE Trans. Syst. Man. Cybern.8:630–632. 13. Portet, T., F. Camps, J.-M. Escoffre, C. Favard, M.-P. Rols, and D. S. Dean, 2009. Visualization of membrane loss during the shrinkage of giant vesicles under electropulsation. Biophys. J.96:4109–4121.
Figure 1: Relative change in the radius of all examined vesicles. The solid circles indicate the radii change in percentage during the whole measured time interval, 100×(Rin−R2)/Rin, and the open squares show the relative
radii change during the LPC stage only, 100×(R1−R2)/R1. The shaded
area indicates the deviations associated with the error in vesicle radius mea-surement due to optical resolution. The deviation was evaluated for a vesicle with radius of 20µm, see text for details.