EFFECTS OF ACUTE SUPINE REST AND HYDRATION STATUS ON MID-THIGH MUSCLE SIZE AND QUALITY AS MEASURED BY ULTRASONOGRAPHY
Nicholas William Shea
A thesis proposal submitted to the faculty of the University of North Carolina at Chapel Hill in partial fulfillment of the requirements for the degree of Master of Arts in the department of
Exercise and Sport Science in the College of Arts and Sciences (Exercise Physiology).
Chapel Hill 2017
Approved by:
Abbie E. Smith-Ryan
Brett Pexa
ii
iii ABSTRACT
Nicholas William Shea:Effects of Acute Supine rest and Hydration Status on Mid-Thigh Muscle Size and Quality as Measured by Ultrasonography
(Under the direction of Eric D. Ryan)
Ultrasonography (US) has emerged as a method of assessing muscle size and
quality. These measurements may be confounded by fluid shifts resulting from a change in
position. The purpose of this study was to investigate the time course of fluid shifts and its
influence on muscle size and quality measurements. Thirty-five males were recruited for the
study. Ultrasound images and segmental bioelectrical spectroscopy assessments of the right
thigh occurred after transition to supine and sequentially every five minutes, to 30
minutes. Subcutaneous fat and corrected echo intensity (EI) for the young and older men showed
a significant age × time interaction (P<0.05). Changes in muscle size were noted after 20
minutes, whereas changes in corrected EI were seen after 10 minutes only in the older men. Our
findings suggest that muscle size and quality US measurements should be taken within the first
iv
TABLE OF CONTENTS
LIST OF FIGURES………....………...vii
LIST OF TABLES…..……….……....viii
LIST OF ABBREVIATIONS ………...ix, x CHAPTER I..……….…..1
Purpose………...………....4
Research questions………...………...……...4
Independent variables……….4
Dependent variables………...4
Significance………4
Limitations………..5
Delimitations………..5
CHAPTER II………6
Muscle cross-sectional area….………...6
v
Measurement of muscle size and quality………...7
Time course of fluid shifts…………...………...10
Age related difference in extracellular water and intracellular water………...…...13
Hydration status and influence of fluid shifts………...…...14
CHAPTER III………..………..………...16
Participants………...16
Experimental Design………16
Statistical analysis………... 20
CHAPTER IV ………21
Vastus lateralis cross sectional area………..……….………..21
Subcutaneous fat………...21
Uncorrected echo intensity………...21
Corrected echo intensity………...21
Thigh ICW:TW………22
Thigh ECW:TW………...22
Correlations………..23
CHAPTER 5………..24
vi
FIGURE LEGENDS..……..………30
vii
LIST OF FIGURES
Figure 1-Segmental BIS setup………..….………..………. 39
Figure 2-SFAT and Corrected EI over time………...…….………. 40
Figure 3-Raw EI and CSA over time……….……….…………. 41
Figure 4-ICW:TW and ECW:TW over time………..……….………. 42
Figure 5-Change of Raw EI and SFAT over Change of Corrected EI (10-30 min)….….…..…. 43
viii
LIST OF TABLES
ix
LIST OF ABBREVIATIONS
ATFSM Appendicular adipose tissue-free skeletal muscle
BIA Bioelectrical impedance
BIS Bioelectrical spectroscopy
CSA Cross sectional area
CT Computerized tomography
ECW Extracellular water
EI Echo intensity
IAT Intramusclular adipose tissue
ICC Inter-correlation coefficient
ICW Intracellular water
LDM Low Density Muscle
MRI Magnetic resonance imaging
NDM Normal density muscle
Re Extracellular water resistance
Ri Intracellular water resistance
SFAT Subcutaneous fat tissue
x SEM Standard error of measurement
TBW Total Body Water
TW Total Water
1 CHAPTER I
INTRODUCTION
Assessing muscle size and quality in vivo is commonly used to determine the
effectiveness of various exercise and nutritional interventions1-3 and the influence of various
clinical conditions on muscle function.4,5 For example, previous studies have demonstrated that
resistance training,6,7 aging,8,9 unweighting,10 and disuse,11 result in significant changes in
muscle size. Sarcopenia, the age associated decrease in muscle mass, has been estimated to cost
$18.5 billion annually in healthcare expenses.12 More recently, muscle quality, (i.e. a measure of
lean tissue composition and density), has also been shown to influence muscle function
independent of muscle size.13,14 For example, Goodpaster and colleagues15 found that initially
well-functioning older adults lost three times as much strength than muscle mass over three
years, thus underscoring the importance muscle quality has in maintaining strength. Another
finding from these authors15 showed that the maintenance or even increases in lean mass of older
individuals did not necessarily prevent decreases in strength; therefore, it may be assumed that
muscle quality is a critical variable in determining strength in older adults.
Historically, computerized tomography16 and magnetic resonance imaging (MRI) have
been used to measure muscle size and quality.17,18 The high contrast observed between tissues of
different molecular properties make MRI an attractive method for determining muscle size and
quality19 while CT assessment speed may make it a desirable method for assessing similar
2
measuring human cadavers for appendicular adipose tissue-free skeletal muscle, interstitial
adipose tissue, and subcutaneous fat (SFAT) tissue. These authors20 concluded that both MRI
and CT are reference methods for appendicular and whole body skeletal muscle assessments.20
Although accurate, CT and MRI assessments require expensive equipment, can expose
participants to ionizing radiation,16 and may not be readily available.2,21 Ultrasonography (US)
has recently emerged as a method of assessing muscle size and quality due to its portability,
patient safety, and is low cost.2,21,22 Ultrasound operates by emitting and receiving sound waves
that are reflected from tissues and processes the received waves to digital images.23 Initial US
technology limited researchers to a narrow field of view;19 however, more recent advancements
in panoramic US imaging have enabled a larger field of view.1 Many recent studies have
demonstrated that panoramic US imaging provides reliable measures of both muscle size and
quality, even when measuring highly curved surfaces.21,24 Furthermore, a recent study by
Athtiainen and colleagues1 demonstrated that panoramic US cross sectional area (CSA) values
showed good repeatability with an intraclass correlation coefficient of 0.905 and a standard error
of measurement of 0.87 cm2 in the vastus lateralis (VL) muscle. In the same study, VL changes
were tracked over 21 weeks of resistance training. Ultrasound showed a high degree of validity
when compared with MRI in tracking changes in VL CSA (ICC of 0.929, SEM of 0.94 cm2).1
More recent studies22,25,26 have focused on using US imaging as a method to examine muscle
quality from echo intensity (EI). Echo intensity can be used as an index of muscle quality
obtained through quantitative gray-scale analysis. Increases in intramuscular fat and connective
tissue result in higher echogenicity and subsequently whiter images,27 which are suggested to
represent decreased muscle quality.25 The accuracy of US EI values in assessing muscle quality,
3
colleagues22 which correct for SFAT thickness. Young et al.22 found strong correlations (r =
0.91 for rectus femoris, r = 0.80 for biceps femoris and tibialis anterior) between MRI percent fat
and SFAT corrected EI values. A study by Akima and colleagues26 compared US with MRI in
detecting intramyocellular lipids (IMCL) and extramyocellular lipids (EMCL). The authors
found US EI values were related to EMCL (r = 0.658) but not IMCL (r = 0.341) content in the
biceps femoris; suggesting that increased EI is due to the adipose tissue located outside the
muscle cells.26
Fluid shifts have been shown to occur in thigh muscle CSA and SFAT28 after 15
minutes29 and 20 minutes28 of supine rest. Bioelectrical impedance (BIA) was used to confirm
fluid losses in the thigh and lower leg after one-hour of bed rest with decreases of 2.1% and 9.2%
respectively.28 Muscle quality has also been reported to be affected by changes in position as
Berg and colleagues28 reported an increase in radiological density in the lower leg of 2.9% after
one hour of bed rest; however, there was no change in radiological density after 20 minutes of
supine rest. Cerniglia and colleagues29 reported a 1.6% decrease in thigh specific normal density
muscle (NDM) measured by CT from 5 to 15 minutes of supine rest. In addition, recent
studies30,31 have suggested that aging results in a relative expansion of extracellular water (ECW)
to intracellular water (ICW) ratio using segmental bioelectrical spectroscopy (S-BIS). Thus, it is
possible that the time course in fluid shifts may be different in older adults.
To our knowledge, no previous studies had determined if the fluid shifts that occur from
the standing to supine position influences US-derived muscle size and quality. The purpose of
this study was to determine the posture induced muscle size and quality changes in both young
4 SIGNIFICANCE
The size and quality of quadriceps muscles are important as they are independent
predictors of strength15 and functional performance,32 and decrease with aging.15 The
significance of this study was in the functional properties and measurements of the quadriceps
and more specifically the VL as a muscle pivotal for walking33 and activities of daily living.34-36
As fluid shifts have shown to alter assessments of muscle size and quality after a change in
posture, it was important to establish a time frame to assess these measures using
ultrasonography.
RESEARCH QUESTIONS
1. At what time point do measurements of muscle size and quality decrease due to fluids
shifts occurring after a change from standing to supine position?
2. Does aging influence the time course of changes in muscle size and quality when
compared to the younger population?
INDEPENDENT VARIABLES
1. Time
2. Age
DEPENDENT VARIABLES
1. VL muscle CSA
2. VL muscle EI
3. Thigh ICW
5 LIMITATIONS
1. Participant recruitment took place in the local community and university; therefore,
recruitment was not completely random.
DELIMITATIONS
6 CHAPTER II
REVIEW OF LITERATURE
MUSCLE CROSS-SECTIONAL AREA
Skeletal muscle size is often reported as the anatomical cross-sectional area (CSA) of a
given muscle at a specific landmark (i.e. half the distance of the limb). Muscle CSA is
considered an important measure of function and performance and numerous studies have
examined the influence of various interventions and conditions on CSA.7,9,37 Changes in muscle
size can be influenced by a number of factors, some of which include: training,6 aging,8 and
disuse.11 For example, Hakkinen and colleagues6 reported that leg extensor muscles CSA
increased in both middle-aged and elderly subjects (men age 40 yrs 4.9 ± 2.5% and women age
40 yrs 9.7 ± 2.5%) after the combination of a six-month heavy resistance and explosive exercise
training program. The influence of age on muscle CSA has been well documented as previous
authors9,37 have reported 25-35% reductions in muscle CSA in older men and women when
compared to younger control groups. Prolonged disuse has been shown to play a significant role
in the reduction of muscle CSA by Gibson and colleagues38 who reported a decrease in the
calculated size of thigh muscle of 8.3 ± 3.1% between uninjured and injured/immobilized legs.
Furthermore, LeBlanc and colleagues16 showed that the muscle size of quadriceps and
hamstrings measured by MRI decreased by 16-18% after 17 weeks of bedrest.
MUSCLE QUALITY
Muscle quality has traditionally been examined as the ratio of strength per unit of
7
loss (dynapenia) occurs much faster than the rate of reduction in muscle size (sarcopenia),15
which may suggest that the quality of skeletal muscle is impaired. Older and obese populations
have been proposed to have decreased muscle quality.40-42 The decreases in muscle quality
associated with aging and obese populations may be due to lower physical fitness and the
infiltration of non-contractile tissue (i.e. adipose and connective tissue) into skeletal muscle
tissue.17,43-46 In a study performed by Ryan and colleagues41 the investigators found positive
correlations between age and mid-thigh low density lean tissue (r = 0.58 P < 0.001) and percent
body fat and mid-thigh low density lean tissue (r = 0.53 P < 0.001).
Muscle quality is thought to be a meaningful indicator of overall muscle function,
independent of other variables such as muscle size, especially in older adults.15 Visser and
colleagues46 found that individuals with more skeletal muscle fat and fibrous tissue infiltration
showed decreases in lower extremity performance as measured by walking and standup-sit down
tests. Decreases in strength have also been shown to be related to decreased muscle quality. In a
classic study performed by Goodpaster and colleagues,15 the investigators found that the decline
in muscle strength occurred three times faster than the decline in muscle mass over the course of
three years and that gains in body weight and lean body mass did not necessarily contribute to
increased strength.
MEASURING MUSCLE SIZE AND QUALITY
Historically, CT16 and MRI have been traditionally used to assess muscle size and
quality. An early study performed by Engstrom and colleagues47 found MRI measured muscle
size within 7.5% of cadaver estimates, while CT tended to overestimate muscle size by 10-20%.
The authors of this study concluded that MRI was highly reliable, although subjective
8
supported by Mitsiopoulos and colleagues20 in measuring adipose tissue free skeletal muscle
(ATFSM) in a cadaver study and reported a coefficient of variation of ~2% in both assessment
techniques. Mitsiopoulos and colleagues20 concluded that both MRI and CT are capable of
detecting small differences or changes in soft tissue composition. The reliability of MRI in
detection of muscle CSA has further been supported by Beneke and colleagues48 who found a
test-retest correlation of r = 0.993 while the coefficient of variation ranged from 0.69% - 5.74%.
The authors48 concluded that MRI was appropriate to quantify individual muscles independent of
their size, location and neighboring tissue. Furthermore, Mitsiopoulos and colleagues20 found
both MRI and CT measured ATFSM and cadaver values adipose tissue values to have a
correlation of r = 0.99. Mitsiopoulos and colleagues20 concluded that CT and MRI are valid
methods for estimating appendicular ATFSM, IAT, and SAT in vivo. Sensitivity of MRI in
detecting changes in muscle size has been supported by Hudelmaier and colleagues49 who
observed changes in individual muscle morphology after an endurance training or strength
training intervention. The strength training intervention group experienced an increase in muscle
volume in the extensors (+3.1%), flexors (3.5%), and adductors (3.9%), while the endurance
training group experienced increases in muscle size of the extensors (+3.7%) and the sartorius
(5.1%). Hudelmaier and colleagues49 concluded that MRI can be effectively used to monitor
location-specific effects of exercise intervention on muscle size.
Although accurate and reliable, MRI and CT technology requires expensive equipment,
exposes patients to ionizing radiation and may be limited in accessibility.2,21 Ultrasound (US)
scanning may be an attractive alternative to MRI and CT to assess muscle size and quality due to
its portability, patient safety, and lower financial obligation.2,21,22 Historically US muscle size
9
single scan. However, panoramic US imaging has the ability to overcome this shortfall by
providing a simultaneous assessment of muscle size and quality in a relatively short acquisition
time even among curved surfaces.21
Ultrasonography has been reported to be a reliable instrument in assessing muscle size.
The test-retest reliability of measuring muscle CSA has been demonstrated by Rosenberg and
colleagues21 who reported an ICC value of 0.914 with SEM values of 5.8% on the medial
gastrocnemius. Similar findings were reported by Lima et al.50 who reported an ICC value of
0.877 and a coefficient of variation value of 8.9% when analyzing the rectus femoris muscle.
When compared to gold standard imaging techniques, US has been strongly correlated with MRI
measured CSA. For example, there was a strong relationship (r = 0.90) between US and MRI
measured CSA of the adductor muscles51 A disparity of 10 ± 4% has been reported between US
and MRI and may be attributed to the processing algorithms of panoramic US.52 The stitching of
multiple US images may omit minute sections of individual images, resulting in a smaller final
image53 or from the exclusion of fasciae when analyzing US CSA images;2 whereas in MRI and
CT fasciae is not visible and may be included in determining muscle size. Other shortcomings of
US may lie in the skill of the operator and that US imaging may not be applicable in all body
regions.54
A recent study by Young et al.22 demonstrated that SFAT corrected grayscale values from
US images may provide an index of intramuscular fat. Young and colleagues22 observed
correlations between EI and MRI derived estimates of percent intramuscular fat in the rectus
femoris (r = 0.91) and in the biceps femoris (r = 0.80). Furthermore, when comparing MRI and
US estimates of muscle quality, Akima and colleagues26 found strong correlations between EI
10
0.506, respectively) and biceps femoris (r = 0.648 and r = 0.591, respectively); however,
correlations between EI and MRI derived estimates of intramyocellular lipids of the vastus
lateralis were not significant (r = 0.060). These authors determined that US derived EI values
could be used as an index of intramuscular adipose tissue and that increases in EI are primarily
due to extramyocellular lipids.26 Strong test-retest reliability of US assessment of muscle quality
has been found across multiple studies reporting ICC values of 0.720-0.917; while
simultaneously reporting standard error of measurement values of 3.6%-4.1%21,24 and
coefficient of variation value of 5.2%.55
TIME COURSE FOR FLUID SHIFTS
Fluid content of skeletal muscle and adipose tissue is a significant component to tissue
density and consequently muscle size and quality. Therefore, fluid shifts resulting from changes
in posture have the potential to alter assessments of muscle size and composition.29 Fluid shifts
occurring in various regions of the body are generally dictated by posture due to the action of
gravitational force.28 A biphasic fluid shift has been shown to occur following the transition
from a standing to supine position.28,56 An initial rapid phase occurs as venous blood is being
redistributed towards the heart from the lower limbs.56 The second phase of the shift involves
fluid moving from interstitial and intracellular spaces to venous capillaries due to decreases in
fluid pressure on the venous side of capillary bed.28,57
Fluid shifts have been well documented in the literature. The argument for local
extracellular fluid loss has been reported under conditions including weightlessness,58
head-down tilt,59 unweighting10 and bed rest.60,61 Hargens and colleagues59 found that interstitial fluid
pressure of the lower leg drops significantly during a five-degree head down body tilt procedure
11
intracellular to extracellular fluid compartments. The reasons for fluid shift may be explained in
large part by hydrostatic pressure. Hydrostatic pressure (HP) is an important factor for the
circulatory system's efforts to maintain consistent cardiovascular pressure.29,62 Hydrostatic
pressure changes with postural changes and may also drive daily fluid shifts in the caudal
region63 resulting in the swelling of the foot and ankle. For example, Berg and colleagues28
found a decrease in calf and thigh CSA after two hours of supine bed rest measured via CT.
Simultaneously, limb water, as measured by BIA, was also reported to decrease, occurring twice
as much in the calf vs. the thigh. This difference between calf and thigh may be due to greater
hydrostatic pressures in the lower leg in the erect position.28 Gibson and colleagues studied the
fluid shifts from the transition from supine to standing position and found an ECW expansion
after 30 minutes of standing.64 The findings of this study are in agreement with Zhu and
colleagues where the ECW expansion was attributed to redistribution of fluids held in the torso
during supine towards the ECW of the limbs.65 Nixon and colleagues58 documented a significant
fluid shift from the legs to upper body, using a five-degree head down body tilt for 24 hours. In
a study performed by Hargens and colleagues,59 the authors reported a local dehydration effect,
over the course of eight hours, on the muscle and SFAT tissue of the lower leg measured by
water displacement. Hargens and colleagues59 concluded that tissue dehydration is greater in the
early stages of head-down bed rest. Additionally, fluid shifts have been reported to decrease up
to six percent after 30 minutes of five-degree head down bed rest, and a 10-19% from initial leg
volume after 24 hours using five-degree head down bed rest.58 As a part of the second phase of
fluid shift, transcapillary fluid reabsorption can occur from muscle tissue ICW to the ECW
compartment, and finally to local capillaries due to changes in hydrostatic pressure that result
12
and SFAT tissues of the lower leg, support the transcapillary fluid shifts occurring from ICW to
ECW and eventually to capillaries.59 Hargens and colleagues59 have postulated that drops in
capillary blood pressure in tissue below the heart is most likely the causative factor for
extravascular fluid loss in simulated or actual weightlessness.
Larger fluid movements have been reported to occur nearly twice as much in the lower
leg than the thigh.56 Berg and colleagues28 found a smaller movements of fluid (-1.6%) in the
initial rapid phase of twenty minutes to occur in the thigh. This difference in fluid flux has been
hypothesized to occur from a greater hydrostatic column and intra-capillary pressure in the erect
position.28 A decrease in HP could result in a reduction of capillary pressure, causing ICW to
move out of the muscle cells towards the extracellular space and eventually into plasma inside
the capillaries. Both fat and muscle tissue are subject to variation via fluid shifts. With water
composing 75% of skeletal muscle67 the loss of ICW can cause muscle cells to shrink and
therefore decrease CSA measurements. Fat tissue, with its relatively low water content, has
surprisingly been reported to have an equal or greater fluid flux than muscle. This was
demonstrated by Berg and associates28 who reported a four percent decrease in both thigh and
calf fat CSA after two hours of bed rest; which was similar to the approximate four percent fluid
efflux from muscle tissue. Furthermore, Cerniglia and colleagues29 found a significant decrease
in CSA of normal density muscle (NDM) after 15 minutes of supine rest but no decrease in low
density muscle (LDM) CSA. This may be attributed to the anhydrous nature of LDM and a
longer amount of time needed for fluid to efflux from such tissue.68 Therefore, higher amounts
of intramuscular fat and connective tissue may increase the time needed for fluid to move from
13
This may underlie the importance of collecting an US scan quickly after the transition
from standing to supine in lean populations as they hold more water in ICW and thus have
greater potential for fluid efflux. To the current investigator’s knowledge the time course of
fluid shifts measured by US resulting from changes in posture was previously undetermined.
AGE RELATED DIFFERENCE IN EXTRACELLULAR WATER AND INTRACELLULAR
WATER
Bioelectrial impedance spectroscopy (BIS) has been reported to distinguish the
differences between ICW and ECW.69 Bioelectrical impedance spectroscopy uses a spectrum of
frequencies typically ranging from 5 kHz to 100 kHz. In assessing ECW, it is hypothesized that
the lower impedance frequencies (i.e. 5kHz) are better at detecting ECW, while higher
frequencies (i.e. 100 kHz) are better at detecting TBW.70,71 When the resistance to current data
is modeled in a Cole-Cole plot (resistance vs. reactance over the frequency spectrum), the
resistance of ICW (Ri) and ECW (Re) can be determined, and specific volumes of each can then
be calculated.69 Because BIS operates on the cellular level, where the body is divided into
extracellular fluid, extracellular solids, and body cell mass, it is able to differentiate fluctuations
in ECW and ICW.69 Bioelectrical impedance spectroscopy can also be used to determine total
body water and total water volumes of specific limbs, if the limb is cylindrically shaped.69
Segmental Bioelectrical spectroscopy has been demonstrated to be a valid tool in in monitoring
fluid changes in segmental limbs during position changes having strong correlations with MRI
muscle volumes of the calf (r = 0.93) and arm (r = 0.96);65,69,72 while the thigh measured by the
ImpediMed SFB7 BIS has been supported to be relatively reliable with a relative error
14
Muscle size is comprised of both ECW and ICW compartments.30,74 An age-related
increase in the whole body ECW: ICW ratio has been reported using BIS, chemical dilution,
whole-body counting, or neutron activation analysis.30,75-77 Yamada and colleagues30 observed a
relative expansion of ECW in the lower leg in older adults when compared to the younger
populations, when using S-BIS estimations. These authors concluded expansions of ECW may
confound the measurement of muscle size. However, the retention and increases of ECW may
occur concurrently with muscle atrophy and/or declines in body composition, as higher
ECW:ICW ratios have been reported in the limbs of quadriplegic and obese participants when
compared to healthy individuals.69 This change in ECW:ICW distribution can be attributed to
the composition of skeletal muscle and adipose cells. Adipose tissue has a ECW:ICW ratio of
3.5:1 grams compared to skeletal muscle which has an ECW:ICW ratio of 0.42:1 grams.77-79
Therefore, the infiltration of adipose tissue into skeletal muscle may explain the increase
ECW:ICW ratio of skeletal muscle in older and diseased populations.77,80 Furthermore,
Chamney and colleagues74 found that normal hydrated adipose tissue was reported to have a
much lower water content but higher ECW:ICW ratio compared to normal hydrated lean tissue,
using chemical dilution techniques. When normal hydrated lean tissue dominates body weight,
whole body ICW tends to be in higher proportion than whole body ECW. The opposite has been
shown to hold true; that is when normal hydrated adipose tissue dominates body weight lower
values in whole body ICW:ECW are observed meaning expansions of the ECW may indicated
increased body fatness and/or muscle atrophy.74,81
HYDRATION STATUS AND INFLUENCE OF FLUID SHIFTS
Hypo- and hyperhydration can seldom occur without concurrent changes in ECW, ICW,
15
respectively.83 Changes in electrolyte content can confound BIS measurements for estimating
fluid changes.82 Euhydration is more typically reflected by higher ECW volume; while ICW is
more reflective of body cell mass which may increase due to increases in intracellular dry matter
associated with resistance training84 and decrease due to aging, malnutrition, and tissue wasting
diseases.85,86 Certain hydration states or methods of hydration can manipulate the ECW:ICW
ratio such as, hypertonic hypohydration or hypernatriema which results in increases in plasma
osmolality, sodium, and chloride, urine osmolality, and specific gravity of urine.69 During
hypertonic hypohydration, the relatively greater water loss compared to solute can result in a
redistribution of fluid from ICW to ECW.87 In a study by O'Brien and colleagues,88 estimates of
ICW and ECW decreased due to isotonic hypohydration, where both water and solutes are lost,
were underestimated by BIS when compared to isotope dilution technique. Mixed data has been
reported in studies using BIS to estimate hyperhydration through water or ionic rehydration
beverage ingestion at a euhydrated state. Gomez et al.89 reported initial (3-5 min) decreases in
ICW and ECW estimates after ingestion of three percent body weight in either water, hypotonic
fluid, or isotonic fluid; however, after 90 minutes post fluid consumption only water and
hypotonic fluid groups showed increased estimates of ICW and ECW. These initial decreases in
estimated water values have been attributed to posture induced (standing to supine) redistribution
of body fluids from the limbs to the trunk region; therefore, emphasizing the importance of time
needed for BIA to detect changes in ICW:ECW after ingestion of fluids.90 The studies listed
above suggest that BIA and BIS are better at assessing hydration in a “steady state”91 and that
neither method is sufficiently accurate in estimating TBW in fluctuating conditions.82 Therefore,
it is of critical importance to control for hydration and hydration methods when estimating body
16 CHAPTER III
METHODOLOGY
PARTICIPANTS
Thirty-eight male participants were enrolled in the study while thirty-five participants
participated in the study; including 23 young participants (demographics listed in table 1) and 12
older adults (demographics listed in table 1). This age range was chosen because older adults are
defined as 65 years of age or older92 and the strength and performance relationship is altered at
age 75.35,93 Participants were recruited via the local university and surrounding communities (i.e.
Chapel Hill, Carrboro, etc.). Participants were excluded if they had sustained a neuromuscular or
metabolic disease, if they had a current or recent (previous three months) lower extremity joint or
muscle problem, had gained or lost 20 pounds in previous two months, or exercised over three
hours per week. Interested participants were screened on the phone to ensure potential
participants fit inclusion and exclusion criteria before visiting the lab for testing. Using data from
our lab and data reported by Berg et al.28 to detect between and within group differences in
muscle quality [effect size (ES): 0.366]94,95 and muscle size (ES: 0.22), we needed a sample of
14-32 participants respectively, to provide 80% power at a 5% significance level.96
EXPERIMENTAL DESIGN
At the start of testing session participants were asked to refrain from vigorous exercise
17
Participants were asked to read and sign an informed consent form stating the risks and benefits
of the experimental procedures and completed a health history and exercise status questionnaire.
During the testing sessions participants had their body stature and mass to ensure participants
meet the BMI category, followed by a measurement of specific gravity of urine for hydration
assessment. Seven measurements of thigh TW, ECW, ICW and ultrasound derived CSA and EI
measurements were taken initially after lying down and sequentially every five minutes during a
30-minute supine rest period. Data collection took place during week day mornings, typically
starting between 8-9AM. Therefore, participants had limited standing, walking and physical
activity prior to supine muscle size and quality measurements.
SPECIFIC GRAVITY OF URINE
To account for hydration status, urine specific gravity was measured directly after the
completion of paperwork. Urine specific gravity was measured using a clinical handheld
refractometer (Model 1.33Ade Advanced Optics, Oregon city, OR).66 A few drops of urine were
placed on the stage of the refractometer and held under a light source which passed through urine
for measurement of specific gravity.97
ULTRASONOGRAPHY
The VL CSA and EI were assessed in the supine position with the right knee supported at
50 degrees of flexion. Ultrasound measurements were taken immediately after the transition to
supine position and sequentially every five minutes thereafter, for thirty minutes for a total of
seven measurements. Measures of CSA and EI were assessed using a portable brightness mode
(B-mode) US imaging device (LOGIQ e 6, General Electric Company, Milwaukee, WI, USA)
18
Company, Milwaukee, WI, USA). The musculoskeletal mode with standardized settings for gain
(56 dB), depth (6 cm), and frequency (10 MHz) were used to optimize image quality and the
settings remained consistent across all subjects. All ultrasound measures were assessed with the
panoramic (extended field of view) function.
A single scan of the VL was conducted perpendicular to the longitudinal axis of the thigh
at half the distance between the greater trochanter and the lateral epicondyle of the femur.98
Transmission gel was applied to the skin on the thigh to enhance acoustic coupling.98 A custom
foam pad was applied to the thigh to ensure movement of the probe remained consistent in the
transverse plane.21 Panoramic US scans were performed starting from the lateral aspect of the
thigh moving medially, across the entire VL. Care was taken to ensure steady speed of US probe
and consistent application of mild pressure to the skin without muscle compression.
IMAGE ANALYSIS
Image-J software (version 1.46r, National Institutes of Health, USA) was used to analyze
all VL US images. Images were first scaled from pixels to centimeters using the straight-line
function and then the polygon function was used to assess muscle CSA and quality by outlining
the region of interest that included as much as the muscle as possible without the surrounding
fascia. Muscle quality was determined from the mean EI values using computer aided gray-scale
analysis ranging from 0-255 arbitrary units (A.U.; black = 0, white = 225).21 Echo intensity
values were corrected for SFAT thickness by using the equation: (40.5278 x SFAT average) +
raw EI = corrected EI, outlined by Young and colleagues.22 Subcutaneous fat was measured
using the straight line function and drawing a line from directly beneath skin to superficial
19
the 50% distance point, and the most lateral aspect of the VL. The average of these three
measurements was taken to calculate SFAT as described by Ryanand colleagues.99
REGIONAL FLUID COMPARTMENTS
A multi-frequency BIS (SFB7, ImpediMed, Queensland, Australia) was used to
determine TW per the procedures100 recommended by the manufacturer. The BIS device uses a
four-electrode system where the first pair of electrodes emits a constant current while the second
pair receives voltage fluctuations dependent on body resistance.101 Emitting (red and black)
electrodes were placed 10cm distally to the anterior superior iliac spine and 10cm proximally
from the tibial tuberosity, respectively. Sensing electrodes (yellow and blue) were placed five
cm distal from the red electrode and five cm proximal from black electrode, measured center to
center of electrodes.70 All measurements and electrode placements were performed prior to the
transition from standing to supine position.
Bioelectrical spectroscopy began immediately after transition to supine position and
every five minutes, up to 30 minutes after the transition to supine in order to detect any fluid
shifts that may have occurred with the change in position (Figure 1). Regional measurements of
ECW and ICW were calculated using ImpediMed multi-frequency software to derive
whole-body resistance of intracellular water and whole-whole-body resistance of extracellular water values.
Extracellular resistance, intracellular resistance and thigh length values were imputed into
proprietary ImpediMed equations used for calculating regional ECW and ICW. The ImpediMed
segmental fluid compartment equations that were used: VolumeECW = ρECW2/3/3(4π)1/3 * L *
(C12 + C22 + C1 + C2) * (L/C1 * C2 * RE)2/3 and Volume of ICW was calculated using the
following two equations: ρTW = ρICW – (ρICW – ρECW) * (RI/RE + RI)2/3 and VolumeICW =
20
between the center blue and yellow (lead) electrodes, RE is the resistance to extracellular water,
C1 is the circumference of the thigh at the blue electrode while C2 is the circumference of the
thigh at the yellow electrode, RI is the resistance to intracellular water, ρICW and ρECW are
male and female dependent value constants: ρICW = 191.63 (male), 185.35 (female) and ρECW
= 49.77 (male), 47.91 (female), C1 is the circumference of the blue lead electrode and C2 is the
circumference of yellow lead electrode.65,69,102
STATISTICAL ANALYSIS
All statistical analyses were performed using SPSS version 21.0 (SPSS, In., Chicago, IL,
USA). All descriptive data are presented as mean ± SD. Potential differences in demographic
and hydration status were examined using an independent samples t-test. Multiple 2 x 7 mixed
factorial analysis of variance (ANOVA) was used to analyze the changes in muscle CSA, muscle
EI, ECW and ICW that may have resulted from a change in position across seven time points (0
min, 5 min, 10 min, 15 min, 20 min, 25 min, 30 min) and between the two age groups. An alpha
level was established a priori P<0.05. If significance is found, a Tukey HSD post-hoc test was
implemented as post-hoc analysis between significant data points to determine between data
21 CHAPTER IV
RESULTS
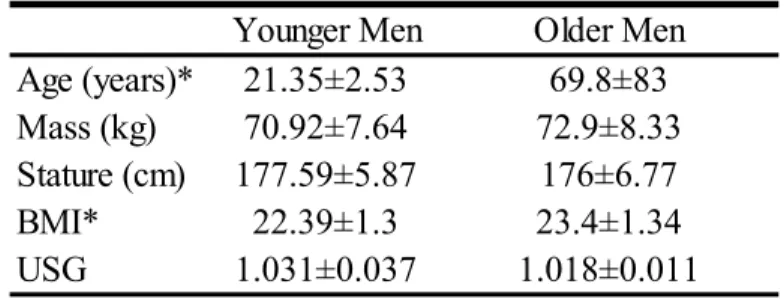
All demographic and USG values are presented in Table 1. There was a significant
difference in age (P<0.001) and BMI (P=0.04). However, no differences were observed for
stature (P=0.540), weight (P=0.490), or USG (P=0.265).
VASTUS LATERALIS CROSS-SECTIONAL AREA
For VL CSA, there was no significant interaction (P=0.130); however, there was a main
effect for time (P=0.006) and young compared to old (P<0.001). Muscle CSA was greater for
the young (25.3±3.6 cm2) vs older men (17.2±3.1cm2). (P<0.001) and CSA was greater at 20
minutes when compared to 30 minutes (P=0.049).
SUBCUTANEOUS FAT
For SFAT, there was a significant interaction (P=0.007). SFAT was significantly greater
in the younger man (0.66±0.29 cm) when compared to the older men at 25 (0.51±0.21 cm)
(P=0.026) and 30 (P=0.046) minutes. In the older men, SFAT was greater at 15 minutes than 30
minutes (P=0.026), however there was no change in SFAT across time (P=0.283) for the young
men.
UNCORRECTED ECHO INTENSITY
For the VL EI, there was no significant interaction (P=0.082). However, there was a main
22
25 and 30 minutes (P=0.004-0.003) and 10 minutes was greater than 15, 20, 25, 30 minutes
(P≤0.045-0.001). The young raw EI values (53.7±4.9 a.u.) were smaller than the older men
(66.5±8.7 a.u.) (P<0.001).
CORRECTED ECHO INTENSITY
For corrected EI there was a significant interaction (P<0.001). Corrected EI was greater
in the older men (90.8±15.1 a.u.) compared to the younger men (80.95±12.4 a.u.) at minute 10
(P<0.046). The younger men did not see a change in corrected EI over time (P=0.743); while
corrected EI was greater at 10 minutes than 25 (P=0.008) and 30 (P<0.001) minutes in the older
men.
THIGH ICW:TW
For the thigh ICW:TW ratio, there was no significant interaction (P=0.604), however,
there was a main effect for age (P<0.001) and time (P<0.001). The thigh ICW:TW ratio was
greater in the young men when compared to the older men (P<0.001). The thigh ICW:TW ratio
at minute 0 was less than 10, 15, 20, 25, and 30 minutes (P<0.001), the 10 minute measurement
was less than 20, 25, and 30 minutes (P<0.001), the 20 minute measurement was less than 25
and 30 minutes (P≤0.046-0.001), and the 25 minute measurement was less than 30 minutes
(P=0.001).
THIGH ECW:TW
For the thigh ECW:TW ratio, there was no significant interaction (P=0.529), however,
there was a main effect for age (P<0.001) and time (P<0.001). The thigh ECW:TW ratio was
less in young men when compared to the older men (P<0.001). The thigh ECW:TW ratio at 0
23
was greater than 20, 25 and 30 minutes (P<0.001), the 20 minute measurement was greater than
30 minutes (P=0.004) and the 25 minute measurement was greater than 30 minutes (P<0.001).
CORRELATIONS AMONG VARIABLES
Given the majority of changes for the aforementioned variables occur between 10 and 30
minutes, follow-up analyses examined the relationship between the changes in each respective
variable using Pearson’s correlation coefficients. The change in CSA was not related to the
change in ICW:TW (r=0.245; P=0.156) or ECW:TW (r=-0.088; P=0.614). The change in raw
EI was not related to the change in ICW:TW (r=0.260; P=0.131) or ECW:TW (r=-0.130;
P=0.457). The change in corrected EI was not related to the change in ECW:TW (r=0.004;
P=0.984), but was related to the change in ICW:TW (r=0.356; P=0.036). Furthermore, the
change in corrected EI was related to the change in raw EI (r=0.544; P<0.001) and the change in
SFAT (r=0.799; P<0.001). Hydration status as measured by USG was not related to the change
in raw EI (r=0.042; P=0.816), the change in corrected EI (r=0.006; P=0.972), the change in
24 CHAPTER V
DISCUSSION
The primary findings of the current study indicated that both young and older men
experienced a similar time dependent decrease in muscle CSA induced by a supine rest (Figure
3). The VL CSA remained stable for the first 20 minutes of rest and then decreased at 30
minutes. The corrected EI values demonstrated an age-specific response with the young men
experiencing no change over the course of 30 minutes, whereas the older group experienced
similar values that peaked at 10 minutes of supine rest and decreased 4.6-5.0% at 25 and 30
minutes (Figure 2). These changes may be influenced by similar responses in changes in SFAT
(Figure 2).
The current study found that muscle CSA in the young men was 31% greater than the
older men (Figure 3). Our data is in agreement with many previous studies14,38,46,102,103
demonstrating sarcopenia of the quadriceps muscles. Our decreases in thigh CSA measurements
were apparent at minute 30, with CSA at 30 minutes being less then CSA at 20 minutes (Figure
3). This data is in contrast with previous data; where decreases in thigh muscle CSA became
apparent at 10, 15, and 20 minutes of supine rest.28,29,95 The discrepancy between studies may
reside in the physical activity differences in subjects between studies (Table 1), where our
subjects were limited to 3 hours of exercise per week and previous studies recruited physically
active subjects.28 More specifically, our subjects engaged in a relatively low amount of physical
25
especially in the young groups, due to less myofibrillar protein content and metabolic
enzymes.105-107 Therefore, expansions of ECW may come from a lower ICW to ECW fluid efflux
capacity.29,68,77 Interestingly, in the current study both young and older groups had similar
responses in muscle CSA to the time course of supine rest; which has been suggested to be
related to decreases in hydrostatic pressure in the capillary bed, resulting in a central venous fluid
redistribution.28,56,108,109 However, it is unlikely that posture induced changes to ECW and ICW
resulted to decreases to CSA (Figure 3 and Figure 4).
The current study reported an increase in corrected EI from the young to the older group,
indicative of a decrease in muscle quality. The difference in corrected EI is similar to many
previous studies that have reported increases in raw EI in older adults.22,110-112 The current study
utilized corrected EI as increasing subcutaneous fat amounts have been shown to reduce raw EI
values due to the attenuation of ultrasound waves.22 Nevertheless, the data is in agreement with
previous literature showing increased corrected EI with age.113 The age-related difference in
corrected EI was ironically found in contrast with SFAT; where the younger men reported a 29%
greater depth of SFAT than the older group (Figure 1) despite a slightly greater BMI (Table 1).22
The discrepancy between BMI and SFAT depth between age groups may be indicative of an age
associated decrease to muscle density and/or an inability to store adipose tissue in the lower
body.112,114-118 More specifically, older adults have shown a decrease in ability to store adipose
tissue as SFAT in the lower body; where SFAT adipocytes may have a reduced ability to uptake
circulating free fatty acids. The result of SFAT dysregulation may manifest itself with increased
visceral fat and decreased muscle quality, while body weight may remain the same or even
26
Corrected EI remained relatively stable over the course of 30 minutes for the younger
group; while the older group experienced changes over the initial 20 minutes with a peak
occurring at 10 minutes of supine rest, which was 9.2-7.5% greater than the 25 and 30-minute
time points, respectfully (Figure 2). Interestingly, the responses for raw EI values were similar
between groups, with raw EI values peaking at 5 and 10 minutes and subsequent decreases of
4.3% to 30 minutes (Figure 3). These improvements in muscle quality measurements may be
clinically significant, as previous studies have reported raw EI SEM values of 3.6%.21 However,
our data showed no change in SFAT across time for the young men, but a significant decrease in
SFAT from 10 minutes to 25 and 30 minutes in the older men. Thus, it is possible that the
significant changes to corrected EI observed in the older men group may be related to the
changes in SFAT (r=0.799; Figure 5). The younger group’s lack of posture induced change to
corrected EI is in contrast to previous literature which demonstrated a 1.4-1.6% improvement in
measurements of muscle quality.28 For example, both Berg et al.29 and Arroyo et al.94 found
improvements in muscle quality after 20 and 10 minutes, respectively. The current study’s
discrepancy in muscle quality measurements between age groups may be related to the changes
to SFAT between age groups (Figure 2 and Figure 5). Furthermore, previous studies did not
account for SFAT, which may have contributed to different time course changes to muscle
quality observed between studies.22,95 With decreased muscle quality, as seen with older adults,
may come an expanded ECW:ICW ratio and therefore faster venous return.46,57,107
The change in raw EI (r=0.042), corrected EI (r=0.006), SFAT (r=0.036) and muscle
CSA (r=-0.103) was unrelated to hydration status. One explanation for the lack of influence is
the relatively tight control of water in muscle homeostasis.68 For example, skeletal muscle holds
27
decreases in hydration.119 Given that most of our subjects were relatively hydrated (Table 1)
with most USG’s < 1.030 and recommendations for hydration remaining below 1.030120
combined with the “steady state” pre testing conditions of our participants; the lack of change
across 30 minutes could be expected.100 More specifically, fluid shifts have been shown to occur
from ICW to ECW when changes to plasma sodium concentrations are induced, which can occur
during exercise and water deprivation;87,121 whereas the current study did not induce a hydration
or dehydration stimulus that could provoke changes to muscle size and/or quality.
In summary, this study is in agreement with previous literature9,15 in that measurements
of muscle size were larger in the young men versus the older men. Muscle size responded
similarly between groups to a change in posture, in that decreases in size were observed after 20
minutes of supine rest. Similar physical activity levels between subject groups may have played
a role in the lack of fluid efflux observable via muscle size measurements. Corrected EI was
higher in the older men (i.e. poorer muscle quality) compared to the young men, in agreement
with previous literature,122 despite having lower SFAT measurements. It is noteworthy that
differences in corrected EI occurring after 10 minutes were seen in the older group but not in the
young group. These changes across time in the older group may be due to the greater amount of
adipose tissue in the muscle, which may contribute to changes in ECW. However, it is also
possible that SFAT directly influenced the responses in corrected EI values across time between
groups. Therefore, the timeframe of data acquisition for muscle quality may be different between
young and older men, in that the older men may be limited to a 5-9 minute timeframe while
measurements in young men are less affected by time. More research is needed to investigate
how an age-related change in adipose tissue storage may influence measurements of muscle size
28
is advised to take measurements of muscle size and quality within 5-9 minutes of supine rest to
avoid changes in muscle CSA, raw EI, corrected EI, and SFAT, regardless of age. Due to time
constraints, ease of assessment, and consistency of assessments, a 5-9 minute window of time for
29 TABLES
Younger Men Older Men
Age (years)* 21.35±2.53 69.8±83
Mass (kg) 70.92±7.64 72.9±8.33
Stature (cm) 177.59±5.87 176±6.77
BMI* 22.39±1.3 23.4±1.34
USG 1.031±0.037 1.018±0.011
* P<0.05, significant difference between the younger and older men
30
FIGURE LEGENDS
Figure 1. An example of thigh specific BIS. Placement of injecting electrodes (red and black) were determined from 10cm distal from ASIS and 10cm proximal from the tibial tuberosity. Sensing electrodes (yellow and blue) were placed 5cm from injecting electrodes measured from center to center of electrode.
Figure 2. Subcutaneous fat (A) and corrected echo intensity (B) for the young and older men across time. # Indicates a significant age × time interaction (P<0.05). * Indicates significant difference between age groups (P<0.001). + Indicates 15 min > 30 min (P < 0.026) in the older group. ++ Indicates 10 min > 25 and 30 min (P =0.008-0.001) in the older group.
Figure 3. Marginal means for raw echo intensity (A) across time. * Indicates main effect for time (5 min > 25 and 30 min; P=0.030 – 0.004). β Indicates main effect for time (10 min > 15, 20, 25, and 30 min; P≤0.045 – 0.001). Marginal means for vastus lateralis cross sectional area across time (B). + indicates main effect for time (20 min > 30 min; P=0.049).
Figure 4. Marginal means for thigh ICW:TW ratios (A) and ECW:TW ratios (B) across time. *Indicates 0 min < 10, 20, 25, 30 minutes; 10 < 20, 25, 30; 20 < 25, 20; 25 < 30 (P<0.046). ** Indicates 0 min > 10, 15, 20, 25, 30; 10 min > 20, 25, 30 min, 20 min > 30 min, 25 min > 30 min; P<0.001).
Figure 5. Changes in young and older groups combined from 10 min to 30 min to corrected EI plotted against raw EI (A) (P<0.001) and SFAT (B) (P<0.001).
31 Figure 1
37
REFERENCES
1. Ahtiainen JP, Hoffren M, Hulmi JJ, et al. Panoramic ultrasonography is a valid method to measure changes in skeletal muscle cross-sectional area. European journal of applied
physiology. 2010;108(2):273-279.
2. Sipila S, Suominen H. Quantitative ultrasonography of muscle: detection of adaptations to training in elderly women. Archives of physical medicine and rehabilitation.
1996;77(11):1173-1178.
3. Haub MD, Wells AM, Tarnopolsky MA, Campbell WW. Effect of protein source on resistive-training-induced changes in body composition and muscle size in older men.
The American journal of clinical nutrition. 2002;76(3):511-517.
4. Moreau NG, Teefey SA, Damiano DL. In vivo muscle architecture and size of the rectus femoris and vastus lateralis in children and adolescents with cerebral palsy.
Developmental medicine and child neurology. 2009;51(10):800-806.
5. Liu GC, Jong YJ, Chiang CH, Jaw TS. Duchenne muscular dystrophy: MR grading system with functional correlation. Radiology. 1993;186(2):475-480.
6. Hakkinen K, Kallinen M, Izquierdo M, et al. Changes in agonist-antagonist EMG, muscle CSA, and force during strength training in middle-aged and older people. Journal of
applied physiology. 1998;84(4):1341-1349.
7. Roth SM, Ivey FM, Martel GF, et al. Muscle size responses to strength training in young and older men and women. Journal of the American Geriatrics Society.
2001;49(11):1428-1433.
8. Vandervoort AA. Effects of ageing on human neuromuscular function: implications for exercise. Canadian journal of sport sciences = Journal canadien des sciences du sport. 1992;17(3):178-184.
9. Young A, Stokes M, Crowe M. The size and strength of the quadriceps muscles of old and young men. Clinical physiology. 1985;5(2):145-154.
10. Hather BM, Adams GR, Tesch PA, Dudley GA. Skeletal muscle responses to lower limb suspension in humans. Journal of applied physiology. 1992;72(4):1493-1498.
11. Booth FW, Gollnick PD. Effects of disuse on the structure and function of skeletal muscle. Medicine and science in sports and exercise. 1983;15(5):415-420.
38
13. Fukumoto Y, Ikezoe T, Yamada Y, et al. Skeletal muscle quality assessed from echo intensity is associated with muscle strength of middle-aged and elderly persons.
European journal of applied physiology. 2012;112(4):1519-1525.
14. Goodpaster BH, Carlson CL, Visser M, et al. Attenuation of skeletal muscle and strength in the elderly: The Health ABC Study. Journal of applied physiology. 2001;90(6):2157-2165.
15. Goodpaster BH, Park SW, Harris TB, et al. The loss of skeletal muscle strength, mass, and quality in older adults: the health, aging and body composition study. J Gerontol A
Biol Sci Med Sci. 2006;61(10):1059-1064.
16. LeBlanc AD, Schneider VS, Evans HJ, Pientok C, Rowe R, Spector E. Regional changes in muscle mass following 17 weeks of bed rest. J Appl Physiol (1985). 1992;73(5):2172-2178.
17. Goodpaster BH, Thaete FL, Simoneau JA, Kelley DE. Subcutaneous abdominal fat and thigh muscle composition predict insulin sensitivity independently of visceral fat.
Diabetes. 1997;46(10):1579-1585.
18. Boesch C, Slotboom J, Hoppeler H, Kreis R. In vivo determination of intra-myocellular lipids in human muscle by means of localized 1H-MR-spectroscopy. Magnetic resonance
in medicine. 1997;37(4):484-493.
19. Reeves ND, Maganaris CN, Narici MV. Ultrasonographic assessment of human skeletal muscle size. European journal of applied physiology. 2004;91(1):116-118.
20. Mitsiopoulos N, Baumgartner RN, Heymsfield SB, Lyons W, Gallagher D, Ross R. Cadaver validation of skeletal muscle measurement by magnetic resonance imaging and computerized tomography. Journal of applied physiology. 1998;85(1):115-122.
21. Rosenberg JG, Ryan ED, Sobolewski EJ, Scharville MJ, Thompson BJ, King GE. Reliability of panoramic ultrasound imaging to simultaneously examine muscle size and quality of the medial gastrocnemius. Muscle Nerve. 2014;49(5):736-740.
22. Young HJ, Jenkins NT, Zhao Q, McCully KK. Measurement of intramuscular fat by muscle echo intensity. Muscle Nerve. 2015;52(6):963-971.
23. Whittaker JL, Teyhen DS, Elliott JM, et al. Rehabilitative ultrasound imaging:
understanding the technology and its applications. The Journal of orthopaedic and sports
physical therapy. 2007;37(8):434-449.
24. Palmer TB, Akehi K, Thiele RM, Smith DB, Thompson BJ. Reliability of panoramic ultrasound imaging in simultaneously examining muscle size and quality of the hamstring muscles in young, healthy males and females. Ultrasound in medicine & biology.
39
25. Pillen S, van Alfen N. Skeletal muscle ultrasound. Neurological research. 2011;33(10):1016-1024.
26. Akima H, Hioki M, Yoshiko A, et al. Intramuscular adipose tissue determined by T1-weighted MRI at 3T primarily reflects extramyocellular lipids. Magnetic resonance
imaging. 2016;34(4):397-403.
27. Reimers CD, Fleckenstein JL, Witt TN, Muller-Felber W, Pongratz DE. Muscular ultrasound in idiopathic inflammatory myopathies of adults. Journal of the neurological
sciences. 1993;116(1):82-92.
28. Berg HE, Tedner B, Tesch PA. Changes in lower limb muscle cross-sectional area and tissue fluid volume after transition from standing to supine. Acta Physiol Scand. 1993;148(4):379-385.
29. Cerniglia LM, Delmonico MJ, Lindle R, Hurley BF, Rogers MA. Effects of acute supine rest on mid-thigh cross-sectional area as measured by computed tomography. Clin
Physiol Funct Imaging. 2007;27(4):249-253.
30. Yamada Y, Schoeller DA, Nakamura E, Morimoto T, Kimura M, Oda S. Extracellular water may mask actual muscle atrophy during aging. The journals of gerontology. Series
A, Biological sciences and medical sciences. 2010;65(5):510-516.
31. Yamada M, Moriguch Y, Mitani T, Aoyama T, Arai H. Age-dependent changes in skeletal muscle mass and visceral fat area in Japanese adults from 40 to 79 years-of-age.
Geriatrics & gerontology international. 2014;14 Suppl 1:8-14.
32. Misic MM, Rosengren KS, Woods JA, Evans EM. Muscle quality, aerobic fitness and fat mass predict lower-extremity physical function in community-dwelling older adults.
Gerontology. 2007;53(5):260-266.
33. Liu MQ, Anderson FC, Pandy MG, Delp SL. Muscles that support the body also modulate forward progression during walking. Journal of biomechanics.
2006;39(14):2623-2630.
34. Hortobagyi T, Mizelle C, Beam S, DeVita P. Old adults perform activities of daily living near their maximal capabilities. J Gerontol A Biol Sci Med Sci. 2003;58(5):M453-460.
35. Brown M, Sinacore DR, Host HH. The relationship of strength to function in the older adult. J Gerontol A Biol Sci Med Sci. 1995;50 Spec No:55-59.
40
37. Young A, Stokes M, Crowe M. Size and strength of the quadriceps muscles of old and young women. European journal of clinical investigation. 1984;14(4):282-287.
38. Gibson J, Smith K, Rennie M. Prevention of disuse muscle atrophy by means of electrical stimulation: maintenance of protein synthesis. The Lancet. 1988;332(8614):767-770.
39. Roubenoff R, Hughes VA. Sarcopenia: current concepts. The journals of gerontology.
Series A, Biological sciences and medical sciences. 2000;55(12):M716-724.
40. Evans WJ. Skeletal muscle loss: cachexia, sarcopenia, and inactivity. The American
journal of clinical nutrition. 2010;91(4):1123S-1127S.
41. Ryan AS, Nicklas BJ. Age-related changes in fat deposition in mid-thigh muscle in women: relationships with metabolic cardiovascular disease risk factors. International journal of obesity and related metabolic disorders : journal of the International
Association for the Study of Obesity. 1999;23(2):126-132.
42. Schwenzer NF, Martirosian P, Machann J, et al. Aging effects on human calf muscle properties assessed by MRI at 3 Tesla. Journal of magnetic resonance imaging : JMRI. 2009;29(6):1346-1354.
43. Borkan GA, Hults DE, Gerzof SG, Robbins AH, Silbert CK. Age changes in body composition revealed by computed tomography. J Gerontol. 1983;38(6):673-677.
44. Forsberg AM, Nilsson E, Werneman J, Bergstrom J, Hultman E. Muscle composition in relation to age and sex. Clinical science. 1991;81(2):249-256.
45. Overend TJ, Cunningham DA, Paterson DH, Lefcoe MS. Thigh composition in young and elderly men determined by computed tomography. Clinical physiology.
1992;12(6):629-640.
46. Visser M, Kritchevsky SB, Goodpaster BH, et al. Leg muscle mass and composition in relation to lower extremity performance in men and women aged 70 to 79: the health, aging and body composition study. Journal of the American Geriatrics Society. 2002;50(5):897-904.
47. Engstrom CM, Loeb GE, Reid JG, Forrest WJ, Avruch L. Morphometry of the human thigh muscles. A comparison between anatomical sections and computer tomographic and magnetic resonance images. Journal of anatomy. 1991;176:139-156.
48. Beneke R, Neuerburg J, Bohndorf K. Muscle cross-section measurement by magnetic resonance imaging. European journal of applied physiology and occupational
physiology. 1991;63(6):424-429.
areas--41
quantitative assessment using MRI. Magnetic resonance in medicine. 2010;64(6):1713-1720.
50. e Lima KM, da Matta TT, de Oliveira LF. Reliability of the rectus femoris muscle cross-sectional area measurements by ultrasonography. Clinical physiology and functional
imaging. 2012;32(3):221-226.
51. Ogawa M, Mitsukawa N, Bemben MG, Abe T. Ultrasound assessment of adductor muscle size using muscle thickness of the thigh. Journal of sport rehabilitation. 2012;21(3):244-248.
52. Scott JM, Martin DS, Ploutz-Snyder R, et al. Reliability and validity of panoramic ultrasound for muscle quantification. Ultrasound Med Biol. 2012;38(9):1656-1661.
53. Kroger K, Massalha K, Dobonici G, Rudofsky G. SieScape: a new sonographic dimension with fictive images. Ultrasound in medicine & biology. 1998;24(8):1125-1129.
54. Van Overhagen H, Lameris JS, Berger MY, et al. Improved assessment of
supraclavicular and abdominal metastases in oesophageal and gastro-oesophageal junction carcinoma with the combination of ultrasound and computed tomography. Br J
Radiol. 1993;66(783):203-208.
55. Chen HL, Nosaka K, Chen TC. Muscle damage protection by low-intensity eccentric contractions remains for 2 weeks but not 3 weeks. European journal of applied
physiology. 2012;112(2):555-565.
56. Sjostrand T. The regulation of the blood distribution in man. Acta physiologica
Scandinavica. 1952;26(4):312-327.
57. Wiederhielm CA. Dynamics of transcapillary fluid exchange. The Journal of general
physiology. 1968;52(1):29-63.
58. Nixon JV, Murray RG, Bryant C, et al. Early cardiovascular adaptation to simulated zero gravity. Journal of applied physiology: respiratory, environmental and exercise
physiology. 1979;46(3):541-548.
59. Hargens AR. Fluid shifts in vascular and extravascular spaces during and after simulated weightlessness. Medicine and science in sports and exercise. 1983;15(5):421-427.
60. Greenleaf JE, Shvartz E, Kravik S, Keil IC. Fluid shifts and endocrine responses during chair rest and water immersion in man. Journal of applied physiology: respiratory,
42
61. Greenleaf JE. Physiological responses to prolonged bed rest and fluid immersion in humans. Journal of applied physiology: respiratory, environmental and exercise
physiology. 1984;57(3):619-633.
62. Jacob G, Ertl AC, Shannon JR, Furlan R, Robertson RM, Robertson D. Effect of standing on neurohumoral responses and plasma volume in healthy subjects. Journal of applied
physiology. 1998;84(3):914-921.
63. Hagan RD, Diaz FJ, Horvath SM. Plasma volume changes with movement to supine and standing positions. Journal of applied physiology: respiratory, environmental and
exercise physiology. 1978;45(3):414-417.
64. Gibson AL, Beam JR, Alencar MK, Zuhl MN, Mermier CM. Time course of supine and standing shifts in total body, intracellular and extracellular water for a sample of healthy adults. Eur J Clin Nutr. 2015;69(1):14-19.
65. Zhu F, Schneditz D, Wang E, Levin NW. Dynamics of segmental extracellular volumes during changes in body position by bioimpedance analysis. J Appl Physiol (1985). 1998;85(2):497-504.
66. Caton JR, Mole PA, Adams WC, Heustis DS. Body composition analysis by bioelectrical impedance: effect of skin temperature. Medicine and science in sports and exercise. 1988;20(5):489-491.
67. Brooks G, Fahey T, White T, Baldwin K. Exercise physiology: human bioenergetics and its applications. 2000.
68. Wang Z, Deurenberg P, Wang W, Pietrobelli A, Baumgartner RN, Heymsfield SB. Hydration of fat-free body mass: new physiological modeling approach. The American
journal of physiology. 1999;276(6 Pt 1):E995-E1003.
69. Bartok C, Schoeller DA. Estimation of segmental muscle volume by bioelectrical impedance spectroscopy. Journal of applied physiology. 2004;96(1):161-166.
70. Segal KR, Gutin B, Presta E, Wang J, Van Itallie TB. Estimation of human body composition by electrical impedance methods: a comparative study. Journal of applied
physiology. 1985;58(5):1565-1571.
71. Hannan WJ, Cowen SJ, Fearon KC, Plester CE, Falconer JS, Richardson RA. Evaluation of multi-frequency bio-impedance analysis for the assessment of extracellular and total body water in surgical patients. Clinical science. 1994;86(4):479-485.