1
Systematic Review: Reducing Dietary Sodium Decreases Stroke but Not All Cause Mortality or Cardiovascular Disease
By
Richard Dane Meredith
A Master’s Paper submitted to the faculty of
the University of North Carolina at Chapel Hill
in partial fulfillment of the requirements for
the degree of Master of Public Health in
the Public Health Leadership Program
Chapel Hill
2012
[Signature]
Advisor
[Printed name]
Date
[Signature]
Second Reader
[Printed name]
3 ABSTRACT
Background: The relationship between dietary sodium and mortality is poorly characterized.
Recent reviews and studies offer contradictory results.
Purpose: To compare the benefits and harms of dietary sodium reduction.
Data Sources: MEDLINE from inception through April 2012, English language restriction.
Study Selection: Prospective cohort studies, randomized controlled trials, and cluster
randomized controlled trials that quantitatively compare a low versus high sodium diet with
follow up greater than 2.5 years. Secondary prevention studies are excluded.
Data Extraction: One reviewer selected studies for inclusion. One reviewer abstracted data
with second checking by another reviewer. Two reviewer independently assessed study quality.
Data Synthesis: Twenty studies, 1 cluster randomized controlled trial (fair quality), 4
randomized controlled trials (2 good quality, 2 fair quality), and 15 prospective cohort studies (all
fair quality) met inclusion criteria. 1 study was excluded for a high risk of bias. Included studies
contributed a total of 248,895 unique individuals for analysis. 10 studies had a follow-up greater
than 10 years. Dietary sodium reduction had a pooled all cause mortality HR [95% CI] of 1.00
[0.92 to 1.07], a pooled cardiovascular mortality HR [95% CI] of 0.95 [0.76 to 1.15], a pooled
cardiovascular RR [95% CI] of 1.00 [0.77 to 1.12] at study end, a pooled stroke mortality HR
[95%] of 0.77 [0.59 to 0.97], and a pooled stroke HR [95% CI] of 0.90 [0.84 to 0.95]. Studies
with a baseline dietary sodium above 4000 mg per day showed a benefit of sodium reduction
with a pooled all cause mortality HR [95% CI] of 0.90 [0.82 to 0.98]. All results have a low
4
Limitations: A majority of studies are fair quality cohort studies prone to confounding. There
are few high quality studies with enough power to drive conclusions. Interstudy variability is
high. These results do not apply to a secondary prevention population.
Conclusions: Reducing dietary sodium did not improve all cause mortality or cardiovascular
disease risk. Sodium reduction does appear to decrease stroke risk. A dose response
relationship between dietary sodium and outcomes is needed to identify an optimal level of
5 INTRODUCTION
Current recommendations for daily dietary sodium consumption
Table 1. Summary of Dietary Sodium Intake Recommendations in the United States
Organization mg/day
United States Department of Agriculture1
< 2300a < 1500b American Heart Association2 < 1500 Joint National Committee on
Prevention,
Detection, Evaluation, and Treatment of High Blood Pressure3
< 2400
Institute of Medicine4
Tolerable upper intake
Adequate intake
2300 1500c 1300d 1200e
a
Healthy adults ages 19-50. bAges 51+, hypertension, African Americans. cAdults ages 19-50. dAdults ages 51-70.
e
Adults ages 71+.
Recommended levels of dietary sodium consumption range from less than 1200 mg/day
to less than 2400 mg/day. The methodology used to derive these recommended values varies.
The United States Department of Agriculture (USDA) bases its recommendations on an Institute
of Medicine’s (IOM) report.1
The IOM semi-systematically reviewed evidence and found that
2300 mg/day of dietary sodium is the tolerable upper intake for adults. The IOM found a
progressive and direct relationship between blood pressure and dietary sodium, and that this
relationship becomes more robust at sodium intakes above 2300 mg/day. Notably however, the
IOM does not make a recommendation for daily dietary sodium consumption. The IOM found
inadequate evidence to recommend an ideal dietary sodium level because morbidity outcomes
at multiple levels of sodium consumption were not available.4 Instead the IOM provides an
“adequate intake”, which represents that amount of daily sodium required to meet the “Intake
level to cover possible daily losses, provide adequate intakes of other nutrients, and maintain
normal function”(pg.12).4
The IOM specifically notes that its adequate intake and tolerable upper
6
The American Heart Association (AHA) bases its recommendation on USDA, IOM, and
Food and Drug Administration (FDA) reports.2 Recently, an FDA report stated that 69.2% of US
adults meet the USDA criteria recommending less than 1500 mg/day dietary sodium.5 Since
such a large portion of the US population meet USDA criteria for less than 1500 mg/day dietary
sodium, the AHA set 1500 mg/day as their standard.
The Joint National Committee on Prevention, Detection, Evaluation, and Treatment of
High Blood Pressure, Seventh Report (JNC-7) dietary sodium guideline is based on a single
narrative review that primarily assesses the relationship between dietary sodium and blood
pressure.3,6 The JNC-7 sodium guideline only considers two prospective cohort studies with
mortality or cardiovascular disease (CVD) as outcomes.
Overall, I did not find strong evidence to support current guidelines for daily dietary
sodium consumption in the United States. No recommendation systematically reviews dietary
sodium in relation to morbidity outcomes. A majority of the recommendations are ultimately
based on a single IOM report. However, the IOM report itself found insufficient evidence to
make a recommendation. Since the IOM could not determine an ideal level of sodium
consumption, they reported a minimum level of sodium consumption (1500 mg/day) that would
not cause undue restriction in achieving an otherwise nutritious diet. The IOM’s tolerable upper
sodium intake (2300 mg/day) relies exclusively on the relationship between dietary sodium and
an intermediate outcome – blood pressure.
Policies and guidelines to reduce dietary sodium consumption are widespread around
the world. Finland currently recommends 5 g of sodium per day.7 Canada recommends between
1.2-2.3 g per day.8 Australia and New Zealand recommend 1.6 g per day.9 The United Kingdom
recommends 2 g per day.10 Numerous international organizations, professional societies, and
7
Dietary sodium levels in the United States and around the world
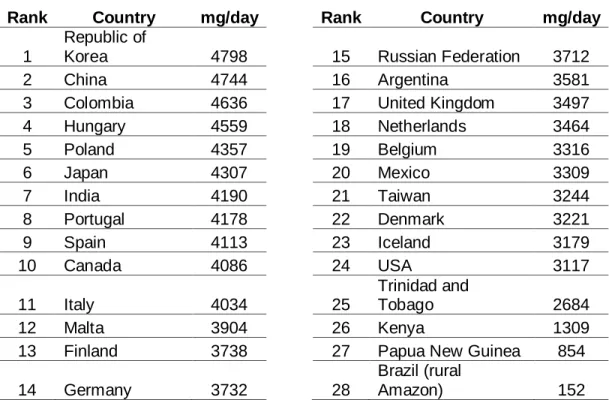
Table 2. 24-Hour Sodium Excretion Around the World
Rank Country mg/day Rank Country mg/day
1
Republic of
Korea 4798 15 Russian Federation 3712
2 China 4744 16 Argentina 3581
3 Colombia 4636 17 United Kingdom 3497
4 Hungary 4559 18 Netherlands 3464
5 Poland 4357 19 Belgium 3316
6 Japan 4307 20 Mexico 3309
7 India 4190 21 Taiwan 3244
8 Portugal 4178 22 Denmark 3221
9 Spain 4113 23 Iceland 3179
10 Canada 4086 24 USA 3117
11 Italy 4034 25
Trinidad and
Tobago 2684
12 Malta 3904 26 Kenya 1309
13 Finland 3738 27 Papua New Guinea 854
14 Germany 3732 28
Brazil (rural
Amazon) 152
To put dietary sodium consumption in the United States in perspective, I adapted data
from the World Health Organization (WHO) INTERSALT study to show mean consumption
around the world (Table 2).17,18 The INTERSALT study, sought to associate urinary sodium
excretion with blood pressure in 52 populations around the world. The INTERSALT study did
not set out to take nationally representative samples of dietary sodium. However, it is a large
and methodologically standardized study of 10,079 people that reports 24-hour urine sodium
excretion in multiple populations around the world. A separate WHO report analyzes 37 studies
that measure sodium consumption in individual countries and finds wide variation within and
between countries depending on survey methodology.17 The IOM estimates the average
American consumes 3400 mg of sodium per day, corroborating the validity of INTERSALT
results.4 Thus, the INTERSALT study represents the best standardized measure of sodium
8 Dietary Sodium and Blood Pressure
Figure 1. Correlation between average daily NaCl intake and incidence of hypertension.
Figure 1 in: Dahl LK. Possible role of salt intake in the development of essential hypertension. 1960. Found in International journal of epidemiology. Oct 2005;34(5):967-972; discussion 972-964, 975-968.
In 1960 L.K. Dahl published a cross-sectional study that showed a direct correlation
between dietary sodium and blood pressure in 5 Japanese and American populations (Figure
1).19,20 Notably, this Dahl graph measures grams of salt as opposed to sodium. To convert
grams of salt to grams of sodium, divide by 2.5. Thus, sodium intake in the Dahl study
approximately ranged from 1200mg in Alaskan Eskimos to 10,800 mg in Northern Japanese - a
very wide range.
Since the Dahl study, numerous studies and subsequent meta-analysis confirm a
positive relationship between dietary sodium and blood pressure.21-29 The largest and most
recent systematic review and meta-analysis of 167 randomized controlled trials (RCTs) found
that a 2800 mg/day reduction in sodium decreases systolic blood pressure by 1.27 to 10.21
9 Dietary Sodium and Morbidity/Mortality
The relationship between dietary sodium and morbidity/mortality is unclear. The
CARDIAC study used a cross-sectional analysis of 2462 male participants in 16 different
countries and found dietary sodium to be positively associated with stroke incidence with an
R-squared of 0.67 (p<0.01).31 Interestingly, the CARDIAC study found an inverse relationship
between dietary sodium and ischemic heart disease with an R-squared of -0.46 (p<0.05).31
Another cross-sectional study used dietary sodium from the INTERSALT study, and mortality
tables from the WHO, to find a similar positive correlation between stroke and dietary sodium.32
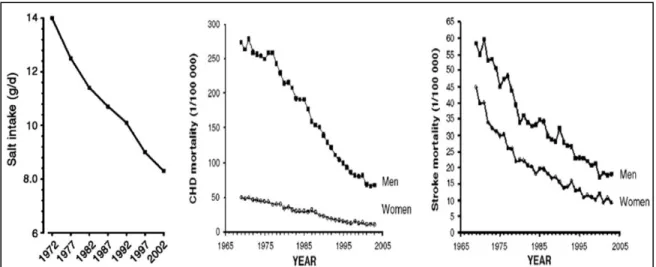
In Finland, a 30 year campaign to reduce sodium intake has been mirrored by similar reductions
in coronary heart disease and stroke mortality (figure 2).33 However, the Finland study fails to
address confounding caused by other healthcare advances during the same time period.
Furthermore, all 3 of these studies show correlation, but none can effectively prove causation.
Figure 2. Cardiovascular Mortality and Salt Intake Trends over 30-years in Finland. As salt
intake decrease, cardiac and stroke mortality decreases to a similar degree. Adapted from:
Karppanen H, Mervaala E. Sodium intake and hypertension. Progress in Cardiovascular
10
Recently, 2 systematic reviews and meta-analysis of prospective dietary sodium
reduction studies have come to different conclusions. The first review, looked at 13 prospective
studies with a total of 177,025 people at a minimum of 3 years follow-up and found that elevated
sodium increased the relative risk of stroke of 1.23 [95% CI 1.06-1.43] and the relative risk of
cardiovascular disease of 1.17 [95% CI 1.02-1.34].34 However, a second recent review of 7
RCTs with a total of 6489 people at a minimum of 6 months follow-up failed to find any
significant association between dietary sodium, and cardiovascular mortality.35 Possible reasons
for this discrepancy include short follow up and low statistical power in the second study, since it
only used RCTs. However, it is also possible that low sodium diets have harmful side effects
that counteract the beneficial effects of lower blood pressure.
Harms of Reducing Dietary Sodium
The harms of reduced sodium diets are poorly described. Historically, dietary sodium
studies have focused on blood pressure as the outcome of interest. At all levels, blood pressure
is associated with a progressively increased risk of vascular death, starting at 115/75 mmHg.36
The harms of low blood pressure depend on the clinical presentation of an individual. Since
nearly all levels of blood pressure are associated with an increased risk of vascular death,
dietary sodium studies with blood pressure as an outcome cannot detect harms associated with
a low sodium diet. Only prospective morbidity and mortality studies can elucidate potential
harms associated with a low sodium diet.
Several recent prospective cohort studies have indicated that low sodium diets may be
associated with increased cardiovascular disease.37,38 Another study provides a theoretical
framework around which low sodium diets may cause harm. This study systematically reviewed
11
aldosterone, norepinephrine, epinephrine, total cholesterol, and triglycerides.30 Increases in
these lipids and hormones could negate the benefit conferred by lower blood pressure.
Measuring Dietary Sodium
The gold standard for estimation of dietary sodium is a 24-hour urine collection.
Frequently, urine creatinine or PABA is used to ensure a complete sample has been collected.
However, 24-hour urine sodium underestimates dietary sodium consumption by approximately
15% due to loses in sweat and feces.39
Many studies, especially large studies over long periods of time, do not gather 24-hour
urine sodium for cost of logistical reasons. These studies often rely on some type of food
frequency questionnaire (FFQ) or 24-hour dietary recall. A recent review indicates FFQs and
24-hour dietary recall typically report 22% to 50% less sodium consumption than a 24-hour
urine sodium.40 To optimally estimate dietary sodium, surveys should be conducted over several
days.41 Furthermore, survey patients should be masked to decrease social desirability biases.42
Purpose of This Systematic Review
The relationship between dietary sodium consumption and morbidity/mortality is poorly
understood. Numerous public health campaigns and recommendations are based on the
relationship between dietary sodium and blood pressure. Given that recent studies and
meta-analysis fail to find benefit in sodium reduction indicates that harms of sodium reduction may
have been overlooked. This review will systematically search, appraise, and meta-analyze
prospective cohort, randomized controlled trials, and cluster randomized controlled trials that
12 METHODS:
Study Selection:
Table 3: Study Eligibility Criteria (PICOTS)
Population (s) Population based sample of adults greater than or equal to 18 years old. Studies focusing exclusively on secondary prevention were excluded. Interventions Dietary sodium should be measured by any quantitative means.
Qualitative forms of sodium estimation were excluded.
Comparators Study should provide categorically different levels of sodium consumption for comparison, or provide sodium consumption as a continuous variable. Outcomes All-cause mortality is the primary outcome. Secondary outcomes include:
cardiovascular disease mortality, cardiovascular disease, stroke mortality, and stroke.
Timing Outcomes should be assessed at least at 2.5 years of follow-up. Settings Included studies are population based without geographic limits Study Designs Relevant study designs for the review are prospective cohort studies,
randomized controlled trials, and cluster randomized trials.
Study inclusion criteria for this review are outlined in table 3. This review aims to focus
on primary prevention. However, no study deals exclusively with an asymptomatic population.
Therefore, this review’s inclusion criteria include any sample of adults greater than or equal to
18 years old. However, this review excludes any studies that focus exclusively on secondary
prevention. For example, an included study population may have a component of people with
congestive heart failure. However, a study exclusively of people with congestive heart failure
would be excluded.
This review considers all forms of dietary sodium estimation that produce a quantitative
value. However, the method of sodium estimation is evaluated in the overall quality rating of the
study. Examples of high quality dietary sodium estimation include: multiple 24-hour urine
sodium samples, a single 24-hour urine sodium, and comprehensive dietary interviews. Passive
FFQs and 24-hour dietary recall are less robust forms of dietary sodium estimation. I excluded
qualitative surrogates for sodium consumption, like frequency of salt shaker use or frequency of
13
This review uses all-cause mortality as the primary outcome. Other outcomes of interest
include: CVD, CVD mortality, stroke, and stroke mortality. All-cause mortality was chosen as the
primary outcome because it does not have classification biases. CVD and stroke outcomes
often have unreliable and variable reporting schemes. Included studies were partially graded on
the validity of outcomes measurements. International Statistical Classification of Disease (ICD)
were considered a less than optimal method of reporting outcomes. The best outcomes
measurements had specific criteria described in applicable methods sections.
This review considers all studies with greater than or equal to 2.5 years of follow-up.
While any health benefit of sodium reduction will likely take more than 2.5 years, such a short
follow-up time allows for the identification of any short term harms of sodium reduction. This
review aims to compare short term follow-up to long term follow-up the see if the harm/benefit
balance of sodium reduction changes over time.
14 Literature Search:
To identify articles, I searched MEDLINE from inception to April 2012 with the strategy
outlined in table 4. The search was limited to human subjects and English language articles.
Furthermore, I manually searched the references of pertinent reviews and studies to find any
relevant articles missed by the electronic search. All citations were imported into EndNote X5
(Thompson Reuters, New York, NY). All titles and abstracts identified through the literature
search were reviewed for eligibility against inclusion criteria. The full text of studies was
reviewed against the inclusion and exclusion criteria if the title or abstract provided insufficient
information. Exclusion criteria, as outlined in figure 3, include: qualitative dietary sodium
measurement, outcomes not under review, lack of a comparison group, retrospective studies,
case-control studies, and outcomes assessments less than 2.5 years.
Table 4: Search Strategy with Resulting Number of Identified Articles
Search Number
Search Term Number of
Articles Yielded
1 “Diet, Sodium-Restricted”[Mesh] 5181
2 “Sodium, Dietary”[Mesh] 7056
3 “Sodium Chloride, Dietary”[Mesh] 3383
4 Sodium[Mesh] 99290
5 Mortality[Mesh] 245618
6 “Myocardial Infarction”[Mesh] 135265
7 “Heart Arrest”[Mesh] 29839
8 “Heart Failure”[Mesh] 76366
9 “Cerebrovascular Disorders”[Mesh] 246291
10 “Peripheral Vascular Diseases”[Mesh] 41751
11 Stroke[Mesh] 68778
12 Search #1 OR #2 OR #3 OR #4 102612
13 Search #5 OR #6 OR #7 OR #8 OR #9 OR #10 OR #11
731870
14 Search #12 AND #13 2843
15
16 Data Abstraction:
For studies that met inclusion and exclusion criteria, data was extracted in evidence
tables that included information on: study population, study design, methodology, study quality,
interventions, and results. A single reviewer abstracted data, with second checking by a second
reviewer. Results were recorded by intention-to-treat when possible. All data was compiled into
tables using Microsoft Excel software.
Quality Assessment:
Good, fair, and poor ratings developed by the United States Preventive Services Task
Force (USPSTF) and the University of York Center for Reviews and Dissemination were used to
assess the internal validity of individual studies included in this systematic review.43,44 A “good”
study has results with minimal risk of bias. A “fair” study has some risks of bias, but the potential
bias is not great enough to invalidate findings. For example, a study that has a medium risk of
bias, but shows a large magnitude of effect would receive a fair rating. A “poor” study has bias
to the point that findings become unreliable. A poor study may have a single “fatal”
methodological flaw or multiple minor flaws that cumulatively increase the risk for bias. Studies
receiving a “poor” rating were excluded from analysis. Table 5 lists criteria used to grade study
quality. “Good” quality studies had ideal responses to each criteria, or all but 1 criteria. All
studies were independently assessed by two reviewers. Any disagreements were resolved
17 Table 5. Study Quality Assessment Criteria
Quality Criteria for Prospective Cohort
Studies Quality Criteria for Randomized Trials
1. Is the study design prospective? 1. Did the authors report the study was randomized?
2. Were groups recruited from the same source
population? 2. Was randomization adequate?
3. Were subjects in both groups recruited over the same time period?
3. Was allocation concealment adequate?
4. Were inclusion and exclusion criteria equally
applied in both groups? 4. Were groups similar at baseline?
5. Was an attempt made to blind the study
participants? 5. Were outcome assessors masked?
6. Was an attempt made to blind the outcome
assessors? 6. Were care providers masked?
7. Was the time of follow-up equal in both
groups? 7. Were patients masked?
8. Were differences between groups taken into
account in the statistical analysis? 8. % completed follow-up 9. Was confounding adequately accounted for
either through study design or statistical analysis?
9. Was overall attrition ≥20%?
10. % lost to follow up 10. Was differential attrition ≥15%?
11. Was overall attrition ≥20%? 11. Did the study use ITT analyses? 12. Was differential attrition ≥15%? 12. Method of handling dropouts 13. Were any participants who started the trial
excluded from the analysis?
13. Was dietary sodium measurement equal, valid, and reliable?
14. Method of handling dropouts 14. Was dietary sodium measured by multiple 24-hour urine samples? 15. Was dietary sodium measurement equal,
valid, and reliable?
15. Were outcome measures equal, valid and reliable?
16. Was dietary sodium measured by multiple 24-hour urine samples?
18 Data Synthesis:
When a sufficient number of studies reported an outcome, meta-analysis was
performed. Evaluation of study heterogeneity was performed in accordance with Agency of
Healthcare Research and Quality (AHRQ) guidelines by qualitatively looking for similarities and
differences among individual studies according to PICOTS criteria.45 When meta-analysis was
not appropriate, data was synthesized through qualitative evaluation.
Meta-analysis utilized random-effects models to estimate pooled hazard ratios or risk
ratios for all-cause mortality, CVD mortality, CVD, stroke mortality, and stroke.46 This review
preferentially used HRs associated with dietary sodium reported as a continuous variable. If
baseline dietary sodium was reported as a categorical variable, a composite hazard ratio was
calculated for the study before inclusion into the meta-analysis. CVD analysis lacked sufficient
HR data, thus RR was used for CVD meta-analysis. Forest plots graphically represent individual
studies of the meta-analysis.47 I used the I-squared statistic to measure heterogeneity between
studies.48,49 An I-squared from 0 to 40 percent may signify minimal heterogeneity, from 30 to 60
percent may signify moderate heterogeneity, from 50 to 90 percent may represent substantial
heterogeneity, and greater than or equal to 75 percent typically signifies considerable
heterogeneity.50 The overall importance of an I-squared value depends on the magnitude and
direction of the effect size and on strength of evidence evaluations. This study explores
heterogeneity through subgroup analysis of study design, population demographics, and
variations intervention. This report uses Stata version 12.0 for all quantitative analysis
19 Grading Strength of Evidence:
I graded the strength of the overall body of evidence according the AHRQ guidelines.51 Strength
of evidence evaluates the overall body of evidence in five domains: risk of bias, consistency,
directness, precision, and confounding. Risk of bias evaluates study type and the aggregate
study internal validity. Consistency is the degree and magnitude of agreement amongst study
effect sizes. Directness scores the degree to which the evidence relates to a health outcomes.
Precision evaluates the degree of certainty surrounding a given outcome. Confounding
assesses the plausibility of confounding to explain observed effects. Risk of bias, consistency,
directness, precision, and confounding are used to generate an overall strength of evidence
grade, as outlined in table 5.
Table 5. Definition of Strength of Evidence Grades51
Grade Definition
High High confidence that the evidence reflects the true effect. Further research is very unlikely to change our confidence in the estimate of effect.
Moderate Moderate confidence that the evidence reflects the true effect. Further research may change our confidence in the estimate of the effect and may change the estimate.
Low Low confidence that the evidence reflects the true effect. Further research is likely to change our confidence in the estimate of the effect and is likely to change the estimate.
Insufficient Evidence either is unavailable or does not permit estimation of an effect.
Applicability Assessment:
I assessed applicability of the evidence following established guidelines.52 The applicability
assessment uses the PICOTS framework to determine the external validity of the systematic
review results. Some factors identified a priori that may limit the applicability of evidence
included the following: age of enrolled populations, sex of enrolled populations, baseline dietary
sodium, baseline dietary potassium, baseline blood pressure, baseline BMI, diabetes status,
20 RESULTS
Search Results:
The literature search identified 1389 articles. I assessed 81 full-text articles against the inclusion
and exclusion criteria. Dual reviewers evaluated 20 articles, all of which received a “good” or
“fair” quality rating. Figure 4 outlines the search results.
21 Characteristics of Included Studies:
Table 6 summarizes the characteristics of the 20 studies that met inclusion criteria. One
cluster randomized controlled trial (fair quality), 4 randomized controlled trials (2 good quality, 2
fair quality), and 15 prospective cohort studies (all fair quality) met inclusion criteria. These
studies include a total of 248,895 unique individuals (two studies report on the same cohort
populations and are thus excluded from the total population calculation53,54). One study was
excluded due to a high risk for bias.55
Two population cohorts have multiple publications. Both Alderman et al.-199856 and He
et al.-199954 report on the National Health and Nutrition Examination Survey I (NHANES I) study
cohort. Alderman et al.-199856 report on the entire NHANES I cohort, while He et al.-199954
dichotomize outcomes based on BMI. He et al.-199954 provide outcomes between overweight
and non-overweight individuals, defining overweight as a body mass index of 27.8 kg/m2 or
higher for men and 27.3 kg/m2 or higher for women.
Cohen et al.-200853 and Yang et al.-201157 both report on the National Health and
Nutrition Examination Survey I (NHANES III) study cohort. The two reports differ because
Cohen et al.-200853 analyses adults over age 30, while Yang et al.-201157 analyses adults over
age 20. Furthermore, the Yang et al.-201157 has a slightly longer follow-up period.
Cook et al.-200758 reports on both the Trial of Hypertension Prevention I (TOHP I) and
Trial of Hypertension Prevention II (TOHP II). TOHP I randomizes individuals to either an
intensive dietary sodium reduction program or usual care. TOHP II presents results such that
the intervention group received a program to reduce both weight and sodium intake, while the
control group perused weight loss only.
About half of the studies were conducted in the United States, with other studies
22
European countries37. Sample sizes ranged from 587 to 77,500 people. Most trials enrolled
representative population samples, however three studies report on high risk populations. Ekinci
et al.-201166 restrict their study to patients with diabetes mellitus type 2 (DM2). Thomas et
al.-201160 only report on patients with diabetes mellitus types 1 (DM1). Larsson et al.-200861 focus
exclusively on male smokers. Follow-up periods ranged from 2.5 to 19 years. Mean baseline
dietary sodium (mg/24 hrs) ranged from 2022 to 5416. Female representation ranged from 29%
to 64% of respective study populations. Mean age ranged widely between studies from 39 to 75
years. Baseline mean systolic blood pressure (mmHg) ranged from 121 to 145.
Studies conducted outside in the United States (excluding Larsson et al.-200861 which
lacks a mean value) had a total of 210,783 participants and mean dietary sodium of 4104
mg/24hrs. Studies conducted inside the United States (excluding He et al.-199954 and Cohen et
al.-200853 due to study population duplication) had a total of 38,112 participants and a mean
dietary sodium of 2954 mg/24 hrs. The 3 studies conducted in Japan had a total of 165,329
participants and a mean dietary sodium of 4109 mg/24 hrs. The 2 Finland studies with a m ean
composite baseline sodium had a total of 5243 participants and a mean dietary sodium of 3854
mg/24 hrs. Thus, baseline dietary sodium consumption for included studies in the United States,
Japan, and Finland roughly agree with INTERSALT world sodium estimates.17,18
Included studies measure dietary sodium in a variety of ways. The following summarizes
ways used to calculate dietary sodium consumption in order of relative methodological strength.
One cluster randomized trial directly controlled sodium intake at residential veterans’ kitchens in
Taiwan.65 Three studies used multiple 24-hour urine collections.58,66 Five studies used a single
24-hour urine sample at baseline.37,59,60,67,68 One study used a single baseline overnight urine
sample corroborated by a passive 24-hour dietary recall.69 Five studies used an active 24-hour
23
dietary recall where the patient was not aided by any study personel.63 Four studies used some
form of food frequency questionnaire (FFQ).61,62,64,71
Fourteen studies report all-cause mortality. All-cause mortality is typically determined
from death certificates or national death registry. Twelve studies report CVD mortality. Five
studies report stroke mortality. Five studies report both fatal and non-fatal CVD. Six studies
report both fatal and non-fatal strokes. All studies identify CVD and stroke through ICD codes,
with the exception of Whelton et al.-199868 who utilized a masked committee to prospectively
evaluate medical records when an event occurred.
Dual reviewers excluded a 1985 prospective cohort study due to a high risk of bias.55
The study measured dietary sodium through passive 24-hour dietary recall, which we consider
to be a weak method for estimation. Furthermore, follow-up time between study groups was
unclear, the amount of data lost to follow-up was not described, and the study did not attempt to
24 Table 6: Characteristics of Included Studies
Study
Study
Type N
Follow up (yrs) Baseline Dietary Sodium (mg/d) Method of Sodium Estimation Mean Age (yrs) % Female SBP (mmHg) Risk of Bias HPT group, 199069
RCT 587 3 3449 Urine sample 39 37 124 Low
Tunstall-Pedoe et al., 199767
P. Cohort
7354 7.8 3874
24 hour urine
Range: 40 to 59
49 - Moderate
Alderman et al., 199856
P. Cohort
11,346 Range: 15 to
20
2022
Active recall
50 61 135 Moderate
Whelton et al., 199868
RCT 975 2.5 3415 24 hour urine 67 48 129 Low
He et al., 199954
P. Cohort
9485 19 2063 Active recall 49 61 134 Moderate
Tuomilehto et al., 200159
P. Cohort
2436 Range: 8 to 13
4322 24 hour urine 46 52 143 Moderate
Nagata et al., 200462
P. Cohort
29,099 7 5416 Questionnaire 55 54 - Moderate
Chang et al., 200665
Cluster RCT
1982 2.6 5200 Controlled
intake
75 - 131 Moderate
Cohen et al., 200670
P. Cohort
7154 13.7 2718 Active recall 48 53 127 Moderate
Cook et al., 200758
RCT 744 15 3577 Multiple 24
hour urine
43 29 125 Moderate,
Low
Cook et al., 200758
RCT 2382 10 4223 Multiple 24
hour urine
44 34 127 Moderate,
Low
Cohen et al., 200853
P. Cohort
8699 8.7 3230 Active recall 48 55 121 Moderate
Larsson et al., 200861
P. Cohort
26,556 13.6 Range: 3822 to 5983
Questionnaire Range: 57 to 58
0 142 Moderate
Umesawa et al., 2008 63
P. Cohort
58,730 12.7 2101 Passive recall 56 61 - Moderate
Takachi et al., 201064
P. Cohort
77,500 7.7 5140 Questionnaire 57 54 - Moderate
Ekinci et al., 201164
P. Cohort
638 Median
: 9.9
4230 Multiple 24 hour urine
64 44 140 Moderate
Stolarz-Skrzypck et al., 201137
P. Cohort
3681 Median : 7.9
4092
24 hour urine
41 53 125 Moderate
Thomas et al., 201160
P. Cohort
2807 Median : 10
3448 24 hour urine 39 49 133 Moderate
Yang et al., 2011
P. Cohort
12,267 Median : 14.8
3594 Active recall Age < 60: 76%
Age ≥ 60: 24%
52 Male:
< 125: 62.6 ≥ 125: 37.4 Female: < 125: 74.6 ≥ 125: 24.4
Moderate
Gardener et al., 201271
P. Cohort
25 All Cause Mortality:
Meta-analysis finds that sodium reduction does not improve all cause mortality risk
(figure 5). Meta-analysis of 10 studies, that included 49,984 people, found a pooled HR [95% CI]
of 1.00 [0.92 to 1.07] for sodium reduction. The meta-analysis had a moderate amount of
variability indicated by I-squared of 64.9%. However, removing any one study does not change
results.
Four studies were not included in the meta-analysis. He et al.-199954 was not included
because it is a subgroup analysis of the same population that Alderman et al, 199856 reports.
Cohen et al.-200853 reports on the same population as Yang et al.-201157. Cohen et al.-200853
was not included because it has more restrictive study inclusion criteria, and has a shorter
follow-up period. The Hypertension Prevention Trial69 and Thomas et. al.-201160 was not
included because they do not provide enough data to make a hazard ratio. Substitution of these
studies into the meta-analysis and qualitative evaluation of these studies does not change
results.
Organizing data according to: method of sodium estimation, age, length of follow up, and
magnitude of sodium reduction does not reveal any trends (supplemental figures 1-4).
Stratifying data by RCTs versus prospective cohort studies does not change results.
Since the harms of high dietary sodium likely cause harm through elevated blood
pressure, adjusting cohort studies for baseline blood pressure could negate the positive benefits
of a low sodium diet. Studies that adjusted baseline blood pressure were compared to studies
that did not adjust for baseline blood pressure (supplemental figure 5). RCTs were considered
to have unadjusted blood pressures because RCT interventions can subsequently change
intervention blood pressures after the trial begins. Results from studies that adjust for baseline
al.-26
199767 study was removed from this analysis, sodium reduction would be beneficial when
baseline sodium is not corrected for.
The benefit of a low sodium diet depends on baseline sodium (figure 6). Studies with a
baseline sodium less than 4000 mg/24 hrs have a pooled HR [95%] of 1.04 [0.95 to 1.13] for
sodium reduction. Studies with a baseline sodium greater than or equal to 4000 mg/24 hrs have
a pooled HR [95% CI] of 0.90 [0.82 to 0.98] favoring sodium reduction. This analysis excluded
the Ekini et al.-201166 study because the study focuses exclusively on a DM2 population and is
27
28
29 Cardiovascular Disease Mortality:
Meta-analysis finds that sodium reduction does not improve CVD mortality risk (figure 7).
Meta-analysis of 10 studies, that included 101,360 people, found a pooled HR [95% CI] of 0.95
[0.76 to 1.15] for sodium reduction. The meta-analysis had a high amount of variability
confirmed by an I-squared of 85.3%. Stratification of data by baseline sodium, age, follow-up,
and study type does not explain the variability. Removing any one study does not change
results.
He et al.-199954 and Cohen et al.-200853 are not included in the meta-analysis for
reasons described in the all cause mortality section. Quanitative and qualitative consideration of
these studies in the analysis does not change results.
Fatal and Nonfatal Cardiovascular Disease:
analysis finds that sodium reduction does not reduce CVD risk (figure 8).
Meta-analysis of 5 studies, that included 85,252 people, found a pooled RR [95% CI] of 1.00 [0.77 to
1.12] for sodium reduction at study endpoint. This meta-analysis differs from all others in this
review because it uses pooled risk ratios since adequate data for hazard ratios are not
available. Four of the 5 studies favor sodium reduction. However, this review cannot find a valid
reason to exclude the one study that finds harm in sodium reduction. This meta-analysis is
heavily influenced by one study, Takachi et al.-201164, because it accounts for 91% of the
aggregate study population.
30
31
32 Stroke Mortality:
Meta-analysis finds that sodium reduction may reduce stroke mortality risk (figure 9).
Meta-analysis of 4 studies, that included 104,468 people, found a pooled HR [95% CI] of 0.77
[0.59 to 0.97] for sodium reduction. The meta-analysis had a high amount of variability
confirmed by an I-squared of 66.5%. One study shows that the risk of stroke mortality is
markedly higher in overweight individuals compared to individuals of normal weight, possibly
helping to explain this variability.54 Mean baseline dietary sodium ranged from 2063 to 5200
mg/24 hrs indicating a similar benefit across a range of sodium consumptions.
Chang et al,-200665 was not included in meta-analysis because the study does not
provide a HR. However, the study does have a RR [95% CI] of 0.51 [0.240 to 1.18] at 2.6 years,
which further supports the meta-analysis trend that sodium reduction reduces stroke mortality
risk.
Fatal and Non Fatal Stroke:
analysis finds that sodium reduction may reduce stroke risk (figure 10).
Meta-analysis of 4 studies, that included 86,274 people, found a pooled HR [95% CI] of 0.90 [0.84 to
0.95]. Two studies were not included in the meta-analysis because they lacked hazard ratios.
The two studies not included in the meta-analysis did not find a significant decrease in stroke
incidence. The first, Whelton et al.-199868 had a RR [95% CI] of 1.10 [0.47 to 2.57] at 2.5 years.
The second, Larsson et al.,-200861 did not find a decrease in cerebral ischemia, intracerebral
33
34
35 Strength of Evidence
Table 7 summarizes strength of evidence for the various outcomes of this review. This
review finds that all cause mortality, CVD mortality, and CVD does not benefit from decreased
dietary sodium with low certainty. Analysis depends heavily on prospective cohort studies,
which are prone to confounding. The influence of baseline dietary sodium and adjustments for
baseline blood pressure could confound results. The few RCTs that report all cause mortality
have too little power and too short follow up to draw independent conclusions. The high level of
inconsistency among studies further weakens certainty. However, these results are
strengthened by the large number of subjects, directness of the outcome on patient health, and
the high precision of the pooled risk estimate.
This review finds that stroke and stroke mortality benefit from dietary sodium reduction
with low certainty. Weak study types, the potential for confounding, inconsistent results weaken
certainty. The large number of subjects and direct outcomes strengthen these results.
Furthermore, it is reassuring that the reduction of risk is observed in both stroke and stroke
mortality. Notably, none of the 5 studies included in the stroke mortality analysis are present in
the total fatal/nonfatal stroke analysis. Thus, 11 unique studies generally agree that sodium
reduction decreases stroke risk.
36 Table 7: Strength of Evidence Table
Domains pertaining to strength of evidence
Magnitude of effect Strength of evidence Number of Studies; Number of Subjects
Risk of Bias; Design/ Quality Consistency (consistent or inconsistent) Directness (Direct or Indirect) Precision (Precise or Imprecise) Confounding (present or absent) Summary Effect Size (95% CI) High, Moderate, Low, Insufficient All Cause Mortality
14; 53378 Moderate; Prospective Cohorts and RCTs/Good and Fair
Inconsistent Direct Precise Present Pooled Hazard Ratio: 1.00 (0.92 to
1.07)
Low
Cardiovascular Disease Mortality
12; 101360 Moderate; Prospective Cohorts and RCTs/Good and Fair
Inconsistent Direct Precise Present Pooled Hazard Ratio: 0.95 [0.76 to
1.15]
Low
Fatal and Nonfatal Cardiovascular Disease
5; 85282 Moderate; Prospective Cohorts and RCTs/Good and Fair
Inconsistent Direct Precise Present Pooled Risk Ratio: 1.00 [0.77 to
1.12]
Low
Stroke Mortality
5; 106450 Moderate; Prospective Cohorts and RCT/ Fair
Inconsistent Direct Precise Present Pooled Hazard Ratio: 0.77 [0.59 to
0.97]
Low
Fatal and Nonfatal Stroke
6; 113805 Moderate; Prospective Cohorts and RCTs/Good and Fair
Inconsistent Direct Precise Present Pooled Hazard Ratio: 0.90 [0.84 to
0.95]
Low
37 Applicability
The results of this systematic review apply broadly to the general population. Diabetics
and overweight individuals are specific subpopulations represented in this report. This review
includes population representative levels of females and non-whites. This review does not apply
to individuals who have specific medical problems. This review excluded records that focused
on secondary prevention populations. These results apply to all age groups and up to 20 years
of follow up. These results apply to a maximum of approximately 2000 mg per day reduction in
dietary sodium. The mean baseline dietary sodium levels in this review ranged between 2000
38 DISCUSSION
The primary conclusion of this review is that that reducing dietary sodium does not
decrease all cause mortality with low certainty. This review secondarily concludes that
reductions in dietary sodium do not, cardiovascular mortality, or cardiovascular risk with low
certainty. Stroke and stroke mortality appear to decrease with low sodium diets with low
certainty. This review believes that all cause mortality is the best outcome because more
studies report all cause mortality than any other outcomes. Furthermore, all cause mortality is
not prone to ICD reporting biases. Studies have shown that ICD codes are moderately
inaccurate.72,73 Furthermore, aggregate outcomes like cardiovascular disease and stroke are
often incapable of distinguishing clinically significant and clinically insignificant disease. This
systematic review additionally abstracted specific CVD events like myocardial infarction (MI)
and congestive heart failure (CHF). However, specific causes of CVD, like MI and CHF, are very
rarely reported in the included studies.
This systematic review includes 248,895 unique individuals. Seventeen out of the 20
included studies have a follow-up greater than 5 years. Half of the included studies have a
follow up over 10 years. Thus, it is unlikely that any future prospective cohort studies will
singularly change these results. However, It is difficult to draw firm conclusions because much
variability exists between studies.
The risk for confounding plays a major role in creating uncertainty. Prospective cohort
studies contribute to 97% of this review’s aggregate study population. As such the risk for
confounding cannot be eliminated. Confounding likely contributes to the high degree of
interstudy variability. As an example, two studies report on the same NHANES III cohort. The
NHANES III cohort was a nationally representative sample of nutritional intake in older,
non-institutionalized Americans.74,75 One study found that a 1000 mg/24 hours increase in dietary
39
cohort.53 The second study found that a 1000 mg/24 hours increase in dietary sodium increased
all cause mortality HR [95% CI] 1.20 [1.03 to 1.41] in the NHANES III cohort.57 Some have
proposed that the difference in these two findings occurs because one study corrects for
baseline potassium and the other does not.76 I believe the more important point is that one
simple statistical adjustment, or one single confounder, is capable of completely changing the
conclusions of a study.
Adjustments for baseline blood pressure may confound results observed in prospective
cohort studies. Adjustment for baseline blood pressure removes the mechanism by which
sodium likely causes harm. Thus, studies that correct for baseline blood pressure are assessing
for an independent association between dietary sodium and outcomes. It wouldn’t be surprising
to find that dietary sodium is not associated with harm independent of blood pressure. However,
prospective cohort studies that do not correct baseline blood pressure open up the potential for
blood pressure confounding. It is impossible to know what degree of blood pressure is
associated with sodium and what percent is due to other causes. Only randomized controlled
trials can control for blood pressure confounding without removing the mechanism by which
sodium causes harm.
The efficacy of lowering dietary sodium likely depends on baseline dietary sodium levels.
This review shows that when population dietary sodium is above 4000 mg/24 hrs, sodium
reduction reduces all cause mortality. However, this review does not suggest that 4000 mg/ 24
hrs is the ideal sodium intake. This review lacks sufficient data to generate a dose-response
relationship between dietary sodium and healthcare risk.
Two studies report a “j-shaped” dose-response relationship between dietary sodium and
risk (figure 11).38,60 These two studies show that both high and low sodium levels are
40
2.2 to 4.0 grams of urinary sodium per day.60 The second report suggests that that composite
risk of cardiovascular death, stroke, myocardial infarction, and hospitalization for congestive
heart failure is lowest between 4.1 to 5.9 grams of urinary sodium per day.38
Figure 11: J-shaped relationship between dietary sodium and hazard ratios.
Graph A represents a DM1 population and shows that risk of all cause mortality is lowest at urine sodium excretion between 2.2 and 4.0 grams per day.60
Graph B represents a population with pre-existing CVD and shows that composite risk of Cardiovascular Death, Stroke, Myocardial Infarction, and Hospitalization for Congestive Heart Failure is lowest at urine sodium excretion between 4.1 to 5.9 grams per day.38
Graph A is adapted from Thomas MC, Moran J, Forsblom C, et al. The association between dietary sodium intake, ESRD, and all-cause mortality in patients with type 1 diabetes. Diabetes care. Apr 2011;34(4):861-866.60
O'Donnell MJ, Yusuf S, Mente A, et al. Urinary sodium and potassium excretion and risk of cardiovascular events. JAMA : the journal of the American Medical Association. 2011;306(20):2229-2238.38
This review does not support current recommendations to reduce dietary sodium as
outlined in table 1. All cause mortality analysis did not identify any benefit of dietary sodium
below 4000 mg/day. Two studies identified in figure 11 corroborate this view, suggesting ideal
sodium levels well above recommended values. Furthermore, both studies in figure 11 are high
risk populations in whom aggressive sodium reduction is often recommended. Though only 2
imperfect studies, figure 11 raises the potential for harm should populations actually achieve
41
of sodium that should not be exceeded. However, recommendations should also try to identify a
minimum level of sodium that populations should remain above.
At a policy level this review does not support systematic programs to decrease
population wide sodium consumption for three reasons. First, this review found that sodium
reduction does not benefit all cause mortality. While this review does conclude that sodium
reduction reduces stroke risk, this review cannot determine if the stroke benefit improves quality
of life in the setting of unchanged all cause mortality. Second, many studies in this review
indicate that low sodium may increase mortality. In a setting where the benefits of sodium
reduction are uncertain, and the potential for harm are legitimate, more research should be
conducted before policy is undertaken. Third, only one study included in the synthesis portion of
this review provides a dose response relationship between dietary sodium and outcomes.60 A
dose response relationship is necessary to identify an ideal level of sodium intake. Without a
clear dose response relationship, sodium reduction policy will not have any clear goals.
This review does conclude that sodium reduction would likely decrease stroke risk.
However, the practical application of this conclusion is uncertain. The only study that
prospectively evaluated cases for stroke did not find a benefit to sodium reduction RR [95% CI]
of 1.10 [0.47 to 2.57] at 2.5 years.68 All other studies diagnose stroke through ICD codes, which
do not distinguish different types or severities of stroke. However, a majority of studies do
suggest that sodium reduction decreases stroke, as borne out in the meta-analysis.
Furthermore, these prospective stroke outcomes are corroborated by cross-sectional studies
that show a positive relationship between stroke and dietary sodium.31 At a population level, I
find it difficult to evaluate the relative quality of life benefit in reducing ICD diagnosed stroke
42
This systematic review identifies the need for a large, long term trial to assess the
efficacy of dietary sodium reduction. The high interstudy variability and risk for confounding
make the relationship between dietary sodium and patient-centric outcomes uncertain. Such a
trial should contain sufficient power to determine a dose-response relationship between dietary
sodium and mortality, CVD, and stroke. Patient outcomes should be prospectively identified in a
masked way so as to only gather clinically significant outcomes. Furthermore, such a trial
should include quality of life measures to assess the relative value of morbidity reductions in the
setting of unchanged all cause mortality.
As a corollary, this systematic review sought to determine why 2 previous systematic
reviews had opposing conclusion about the efficacy of sodium reduction. One review included
all prospective studies and concluded that increased dietary sodium increased the risk of
cardiovascular disease and stroke.34 A second review of only RCTs concluded that there was
insufficient evidence to conclude that dietary sodium is associated with all cause or CVD
mortality.35 The two studies differ because the second review has a much smaller aggregate
study population since it only includes RCTs. However, the two studies also are reporting on
two slightly different outcomes. The first review aggregates fatal and non-fatal cardiovascular
events, while the second study only considers cardiovascular mortality. This further decreases
43
The results of this review differ from the previous systematic reviews. Since the last
systematic reviews were published, 6 prospective cohort studies of dietary sodium have been
published. These 6 new studies make 100,550 new people available for analysis, effectively
doubling the power of this current systematic review. Two of these new studies show statistically
significant harm associated with sodium reduction. Furthermore, a previous systematic review
included poor quality cohort studies in their data synthesis. For example, one included study
qualitatively estimated high sodium intake by asking if individuals ate “salty food”, and found a
positive association between salty food consumption and stroke with a RR [95% CI] of 1.79
[1.18-2.71].77 These poor quality data were subsequently included in other meta-analyses.34
ACKNOWLDEGEMENTS
A special thanks to Quang Pham who served as the second reviewer for this systematic review.
44 SUPPLEMENTAL FIGURES:
45
46
47
48
49 Works Cited.
1. U.S. Department of agriculture and U.S. Department of Health and Human Services: Dietary Guidelines for Americans 2010. 7th ed. Washington, DC: U.S. Government Printing Office; 2010. 2. Lloyd-Jones DM, Hong Y, Labarthe D, et al. Defining and setting national goals for cardiovascular
health promotion and disease reduction: the American Heart Association's strategic Impact Goal through 2020 and beyond. Circulation. Feb 2 2010;121(4):586-613.
3. Chobanian AV, Bakris GL, Black HR, et al. Seventh report of the Joint National Committee on Prevention, Detection, Evaluation, and Treatment of High Blood Pressure. Hypertension. Dec 2003;42(6):1206-1252.
4. Dietary Reference Intakes for Water, Potassium, Sodium, Chloride, and Sulfate. Washington D.C.: The National Academies Press; 2004.
5. Application of lower sodium intake recommendations to adults--United States, 1999-2006.
MMWR. Morbidity and mortality weekly report. Mar 27 2009;58(11):281-283.
6. Chobanian AV, Hill M. National Heart, Lung, and Blood Institute Workshop on Sodium and Blood Pressure : a critical review of current scientific evidence. Hypertension. Apr 2000;35(4):858-863. 7. Pietinen P, Mannisto S, Valsta LM, Sarlio-Lahteenkorva S. Nutrition policy in Finland. Public
health nutrition. Jun 2010;13(6A):901-906.
8. Campbell NR, Kaczorowski J, Lewanczuk RZ, et al. 2010 Canadian Hypertension Education Program (CHEP) recommendations: the scientific summary - an update of the 2010 theme and the science behind new CHEP recommendations. The Canadian journal of cardiology. May 2010;26(5):236-240.
9. Nutrient Reference Values for Australia and New Zealand. Canberra, Australia: National Health and Medical Research Council; 2005.
10. Prevention of Cardiovascular Disease at the Population Level: Nice Public Health Guidance 25. London, United Kingdom: National Institute for Health and Clinical Excellence; 2010.
11. Reducing Salt Intake in Populations: Report of a WHO Forum and Technical Meeding. Paris, France: World Health Organization; 2006.
12. Proceedings of the Sixth International Workshop on Structure and Function of the Vascular System. February 1-3, 2007. Paris, France. Hypertension. Jul 2007;50(1):152-267.
13. Evaluation of certain food additives. Seventy-first report of the Joint FAO/WHO Expert
Committee on Food Additives. World Health Organization technical report series. 2010(956):1-80, back cover.
14. Healthy People 2020. Washington, DC: Department of Health and Human Services; 2020. 15. Appel LJ, Frohlich ED, Hall JE, et al. The importance of population-wide sodium reduction as a
means to prevent cardiovascular disease and stroke: a call to action from the American Heart Association. Circulation. Mar 15 2011;123(10):1138-1143.
16. Frieden TR, Berwick DM. The "Million Hearts" initiative--preventing heart attacks and strokes. N Engl J Med. Sep 29 2011;365(13):e27.
17. Elliot P, Brown I. Sodium Intakes Around the World. Geneva, Switzerland: World Health Organization Press; 2007.
18. Intersalt: an international study of electrolyte excretion and blood pressure. Results for 24 hour urinary sodium and potassium excretion. Intersalt Cooperative Research Group. Bmj. Jul 30 1988;297(6644):319-328.
19. Dahl LK. Possible role of salt intake in the development of essential hypertension. 1960.
50
20. Dahl LK. Possible role of salt intake in the development of essential hypertension. In: Cottier P, Bock K, eds. Essential Hypertension, and International Symposium. Berlin: Springer-Verlag; 1960:53.
21. Alam S, Johnson AG. A meta-analysis of randomised controlled trials (RCT) among healthy normotensive and essential hypertensive elderly patients to determine the effect of high salt (NaCl) diet of blood pressure. Journal of human hypertension. Jun 1999;13(6):367-374. 22. Cutler JA, Follmann D, Allender PS. Randomized trials of sodium reduction: an overview. Am J
Clin Nutr. Feb 1997;65(2 Suppl):643S-651S.
23. Dickinson HO, Mason JM, Nicolson DJ, et al. Lifestyle interventions to reduce raised blood pressure: a systematic review of randomized controlled trials. Journal of hypertension. Feb 2006;24(2):215-233.
24. Dumler F. Dietary sodium intake and arterial blood pressure. Journal of renal nutrition : the official journal of the Council on Renal Nutrition of the National Kidney Foundation. Jan 2009;19(1):57-60.
25. He FJ, MacGregor GA. Effect of longer-term modest salt reduction on blood pressure. Cochrane Database Syst Rev. 2004(3):CD004937.
26. He FJ, MacGregor GA. Effect of modest salt reduction on blood pressure: a meta-analysis of randomized trials. Implications for public health. Journal of human hypertension. Nov 2002;16(11):761-770.
27. Hooper L, Bartlett C, Davey Smith G, Ebrahim S. Systematic review of long term effects of advice to reduce dietary salt in adults. Bmj. Sep 21 2002;325(7365):628.
28. Law MR, Frost CD, Wald NJ. By how much does dietary salt reduction lower blood pressure? III--Analysis of data from trials of salt reduction. Bmj. Apr 6 1991;302(6780):819-824.
29. Midgley JP, Matthew AG, Greenwood CM, Logan AG. Effect of reduced dietary sodium on blood pressure: a meta-analysis of randomized controlled trials. JAMA : the journal of the American Medical Association. May 22-29 1996;275(20):1590-1597.
30. Graudal NA, Hubeck-Graudal T, Jurgens G. Effects of low-sodium diet vs. high-sodium diet on blood pressure, renin, aldosterone, catecholamines, cholesterol, and triglyceride (Cochrane Review). Am J Hypertens. Jan 2012;25(1):1-15.
31. Yamori Y, Liu L, Mizushima S, Ikeda K, Nara Y. Male cardiovascular mortality and dietary markers in 25 population samples of 16 countries. Journal of hypertension. Aug 2006;24(8):1499-1505. 32. Perry IJ, Beevers DG. Salt intake and stroke: a possible direct effect. Journal of human
hypertension. Feb 1992;6(1):23-25.
33. Karppanen H, Mervaala E. Sodium intake and hypertension. Progress in cardiovascular diseases.
Sep-Oct 2006;49(2):59-75.
34. Strazzullo P, D'Elia L, Kandala NB, Cappuccio FP. Salt intake, stroke, and cardiovascular disease: meta-analysis of prospective studies. Bmj. 2009;339:b4567.
35. Taylor RS, Ashton KE, Moxham T, Hooper L, Ebrahim S. Reduced dietary salt for the prevention of cardiovascular disease. Cochrane Database Syst Rev. 2011;6(7).
36. Lewington S, Clarke R, Qizilbash N, Peto R, Collins R. Age-specific relevance of usual blood pressure to vascular mortality: a meta-analysis of individual data for one million adults in 61 prospective studies. Lancet. Dec 14 2002;360(9349):1903-1913.
37. Stolarz-Skrzypek K, Kuznetsova T, Thijs L, et al. Fatal and nonfatal outcomes, incidence of hypertension, and blood pressure changes in relation to urinary sodium excretion. JAMA : the journal of the American Medical Association. 2011;305(17):1777-1785.
38. O'Donnell MJ, Yusuf S, Mente A, et al. Urinary sodium and potassium excretion and risk of cardiovascular events. JAMA : the journal of the American Medical Association.
51
39. Holbrook JT, Patterson KY, Bodner JE, et al. Sodium and potassium intake and balance in adults consuming self-selected diets. Am J Clin Nutr. Oct 1984;40(4):786-793.
40. Bentley B. A review of methods to measure dietary sodium intake. The Journal of cardiovascular nursing. Jan-Feb 2006;21(1):63-67.
41. Bingham SA, Cassidy A, Cole TJ, et al. Validation of weighed records and other methods of dietary assessment using the 24 h urine nitrogen technique and other biological markers. The British journal of nutrition. Apr 1995;73(4):531-550.
42. Hebert JR, Ma Y, Clemow L, et al. Gender differences in social desirability and social approval bias in dietary self-report. American journal of epidemiology. Dec 15 1997;146(12):1046-1055. 43. Harris RP, Helfand M, Woolf SH, et al. Current methods of the US Preventive Services Task Force:
a review of the process. American journal of preventive medicine. Apr 2001;20(3 Suppl):21-35. 44. Systematic Reviews: CRD's Guidance for Undertaking Reviews in Healthcare. York, UK: Centers
for Reviews and Disseminations; 2009.
45. West SL, Gartlehner G, Mansfield AJ, et al. Comparative Effectiveness Review Methods: Clinical Heterogeneity. Rockville MD2010.
46. Sutton AJ, Abrams KR, R. JD, Sheldon TA, Song F. Methods for Meta-Analysis in Medical Research
London, UK: John Wiley & Sons Ltd; 2000.
47. Lewis S, Clarke M. Forest plots: trying to see the wood and the trees. Bmj. Jun 16 2001;322(7300):1479-1480.
48. Higgins JP, Thompson SG. Quantifying heterogeneity in a meta-analysis. Statistics in medicine.
Jun 15 2002;21(11):1539-1558.
49. Higgins JP, Thompson SG, Deeks JJ, Altman DG. Measuring inconsistency in meta-analyses. Bmj.
Sep 6 2003;327(7414):557-560.
50. Cochrane Handbook for Systematic Reviews of Interventions: The Cochrane Collaboration; 2011. 51. Owens DK, Lohr KN, Atkins D, et al. AHRQ series paper 5: grading the strength of a body of
evidence when comparing medical interventions--agency for healthcare research and quality and the effective health-care program. Journal of clinical epidemiology. May 2010;63(5):513-523.
52. Atkins D, Chang S, Gartlehner G, et al. Assessing the Applicability of Studies When Comparing Medical InterventionsMethods Guide for Effectiveness and Comparative Effectiveness Reviews. Rockville MD2008.
53. Cohen HW, Hailpern SM, Alderman MH. Sodium intake and mortality follow-up in the Third National Health and Nutrition Examination Survey (NHANES III). Journal of general internal medicine. Sep 2008;23(9):1297-1302.
54. He J, Ogden LG, Vupputuri S, Bazzano LA, Loria C, Whelton PK. Dietary sodium intake and subsequent risk of cardiovascular disease in overweight adults. JAMA : the journal of the American Medical Association. 1999;282(21):2027-2034.
55. Kagan A, Popper JS, Rhoads GG, Yano K. Dietary and other risk factors for stroke in Hawaiian Japanese men. Stroke; a journal of cerebral circulation. May-Jun 1985;16(3):390-396.
56. Alderman MH, Cohen H, Madhavan S. Dietary sodium intake and mortality: the National Health and Nutrition Examination Survey (NHANES I). Lancet. 1998;351(9105):781-785.
57. Yang Q, Liu T, Kuklina EV, et al. Sodium and potassium intake and mortality among US adults: prospective data from the Third National Health and Nutrition Examination Survey. Archives of internal medicine. 2011;171(13):1183-1191.


![Figure 5: Relationship between dietary sodium reduction and all cause mortality. Results have a pooled HR [95% CI of 1.00 [0.92 to 1.07], indicating no benefit in sodium reduction](https://thumb-us.123doks.com/thumbv2/123dok_us/8344753.2217397/27.918.110.810.116.725/figure-relationship-dietary-reduction-mortality-results-indicating-reduction.webp)
![Figure 6: All cause mortality when dietary sodium is dichotomized at 4000 mg/24 hrs. Five studies with a baseline sodium below 4000 mg/24 hours show no benefit with sodium reduction with a pooled HR [95% CI] of 1.04 [0.95 to 1.13]](https://thumb-us.123doks.com/thumbv2/123dok_us/8344753.2217397/28.918.110.815.108.854/figure-mortality-dietary-dichotomized-studies-baseline-benefit-reduction.webp)
![Figure 7: Relationship between dietary sodium reduction and cardiovascular mortality. CVD mortality does not benefit from sodium reduction with a pooled HR [95% CI] of 0.95 [0.76 to 1.15]](https://thumb-us.123doks.com/thumbv2/123dok_us/8344753.2217397/30.918.106.814.144.720/figure-relationship-dietary-reduction-cardiovascular-mortality-mortality-reduction.webp)
