Structured Application of Biological Ontologies to Annotate
High-Throughput Screening Assays and their Targets of Activity
Jimmy Phuong
A technical report submitted to the faculty of the University of North Carolina at Chapel Hill in partial fulfillment of the requirements for the degree of Masters of Science in Public Health in
the Department of Environmental Sciences and Engineering.
Chapel Hill
2014
Approved by:
Ivan Rusyn, M.D., Ph.D.
Rebecca Fry, Ph.D.
iii
Abstract
Jimmy Phuong
Structured Application of Biological Ontologies to Annotate High-Throughput Screening Assays and their Targets of Activity
(Under the direction of Matthew Martin)
High-throughput screening (HTS) assays have changed the pace of chemical data collection,
enabling assessments at various levels of biological relevance. EPA’s ToxCast Program has 328
assays (experiments) generating 541 assay components (readouts), which produces 795 assay
component endpoints (analyses), with intentions to increase the number of assays and the
number of substances tested. As new assays are developed, it becomes a challenge to
communicate what kind of data and features are associated with each assay. This report uses the
BioAssay Ontology and other publicly available ontologies to produce the ToxCast Assay
Annotation, a structured resource for descriptive information that uses controlled vocabulary to
aid in the communication and use of ToxCast HTS assay data. Organized by 34 annotations
including ‘assay design type’ and ‘detection technology type’, this structure allows for a concise
reference to the pertinent attributes of an assay. Additionally, the perspective differences
between the technological and intended target are separately captured. This structured annotation
also allows for the identification of comparable ToxCast assay endpoints, and offers the potential
iv
Acknowledgements and Dedication
I would like to give thanks to my mentor, Dr. Matt Martin, for his advice and insight which has allowed me to develop as a scientist. Thank you sincerely for giving me the opportunity and creative freedom to explore an area of science that is under-developed and challenging. I’d also like to thank Drs. Ivan Rusyn and Rebecca Fry for their support while planning and executing my Masters work-plan.
A special thank you goes out to all the past and present project team members at US EPA ORD-National Center for Computational Toxicology that I had the pleasure of interacting with. Without their diverse expertise, time, and patience, this highly integrative work could not have been completed.
v
Table of Contents
Abstract ... iii
Acknowledgements and Dedication ... iv
List of Figures ... vi
List of Tables ... vii
List of Abbreviations ... viii
Chapter 1: Literature review ...1
Chapter 2: Introduction ...8
Chapter 3: Methods ...11
Chapter 4: Results ...21
Chapter 5: Discussion, Conclusions, Limitations, and Future Directions ...40
Chapter 6: Indoor environmental health sampling, Science talk panels, and mammary gland tumor bioinformatics investigation: the Practicum experience with Silent Spring Institute ...48
Appendix ...53
vi List of Figures
Figure 1: The annotation workflow ...13
Figure 2: PCA workflow of the chemical screening data ...19
Figure 3: The annotation structure ...22
Figure 4: Intended target family annotation terms ...34
vii List of Tables
Table 1: The 37 annotations used and the short description of the concepts they capture ...15
Table 2: Assay information and content readout types ...24
Table 3: Assay design types annotated to ToxCast Assay Components Endpoints ...25
Table 4: Detection technology types annotated to ToxCast Assay Components Endpoints ...27
Table 5: A comparison of the assay design subtypes by the detection technology subtypes ...27
Table 6: Reagent and components information for the APR_HepG2_1hr assay ...29
Table 7: Organism/tissue types and cell format types ...30
viii
List of Abbreviations
AC50 ...50% of the maximal activity concentration
ACEA ...Acea Biosciences
ACToR ...Aggregate Computational Toxicology Resource Database
APR ...Apredica
AR ...Androgen receptor
ATG ...Attagene
BAO ...BioAssay Ontology
BAO-GPCR ...G-Protein coupled Receptor Ontology
BARD ...BioAssay Research Database
BSK ...Bioseek
CL ...Cell Ontoloy
CLO...Cell Line Ontology
CTD...Comparative Toxicogenomics Database
DSSTox ...Distributed Structure-Searchable Toxicity Database
ELISA ...Enzyme-linked immunosorbent assay
EPA ...United States Environmental Protection Agency
ER ...Estrogen receptor
ESR1 ...Estrogen Receptor Alpha
ExpoCastDB ...ExpoCast Database
GPCR ...G-Protein coupled Receptor
GSEA ...Gene Set Enrichment Analysis
HCS ...High Content Screening
HTS ...High-Throughput Screening
IRB ...Institutional review board
ix
MeSH ...Medical Subject Headings
MLP ...Molecular Libraries Program
MLSCN ...Molecular Libraries Screening Center Network
NAS...National Academy of Sciences
NCATS ...National Center for Advancing Translational Science
NCBI Taxon ...NCBI Organismal Classifications
NCCT ...National Center for Computational Toxicology
NCIT ...National Cancer Institute Thesaurus
NGO ...non-government organization
NIH ...National Institute for Health
NVS...NovaScreen
NRC ...National Research Council
OT ...Odyssey Thera
OWL ...web ontology language
PC ...Principle component
PCA ...Principle Components Analysis
PPARA ...human peroxisome proliferator-activated receptor alpha
PPARD ...human peroxisome proliferator-activated receptor delta
PPARG ...human peroxisome proliferator-activated receptor gamma
PPRE ...Peroxisome Proliferator-activated Response Element
RTU...reporter transcription unit
SOP ...Standard operating procedures
SSI ...Silent Spring Institute
Tox21 ...Toxicity Testing in the 21st century
ToxCastDB ...ToxCast Database
ToxRefDB ...ToxRef Database
1 Chapter 1
Literature Review
Chemical Testing Demand and High-Throughput Screening Assays
The foremost concern about the chemicals in the environment is that most are
insufficiently evaluated for their bioactivity and potential hazards. Since 1976, the Toxic
Substances Control Act (TSCA) inventory has registered over 66,000 chemicals manufactured in
or imported into the United States (Congress 1976). TSCA mandates the United States
Environmental Protection Agency (EPA) to protect the public from adverse human health or
environmental outcomes downstream of these chemicals. For the past 40 years, these risk
assessments used any bioactivity and adverse effect information available, which largely relied
on expensive, time-consuming animal model experiments. Due to this slow pace and unevenness
of chemical testing, a small fraction of chemicals becomes data-rich while the vast majority
remains with little or no available data.
The National Academy of Sciences’ (NAS) National Research Council (NRC) has
addressed the current chemical testing paradigm with the desire to move in a direction that
reduces the number of animals used, reduces the cost and testing time, and increases the
mechanistic understanding of the chemical effects (NRC 2007). While encouraging the recycled
use of existing in vivo data, these desires have turned the scientific and regulatory communities
towards in vitro assays, particularly high-throughput screening (HTS) and high content screening
(HCS) assays. Compared with in vivo studies, HTS and HCS assays require smaller amounts of
2
toxicogenomics, bioinformatics and computational toxicology, the data collected through HTS
and HCS assays can more easily enable mechanistic assessments. The assays may probe human
genes, cells, or tissues to reflect on how chemicals may elicit perturbations at the molecular level
or cumulatively as pathway responses (Dix et al. 2007; Morisseau et al. 2009; Judson et al. 2010;
Kavlock et al. 2012).
At its foundation, an assay is a manufactured test to detect perturbations away from the
normal biological activity. The activity tested will be dependent on how the assay is conducted
and what it measures. HTS assays are assays that have been optimized to allow simultaneous
testing while reducing the cost and time expenditures. Consider a HTS assay conducted in a 384
well-plate as the optimized form of the same assay that was previously conducted in single test
tubes—the data yield is in orders of magnitude faster. HTS methodologies are predominantly
drug discovery approaches; however, reapplying these same approaches towards environmental
chemicals can help address the number of data gaps existing for the large portion of
environmental chemicals (Dix et al. 2007; Judson et al. 2009).
In response to the NRC report (2007), EPA has chosen approximately 10,000 chemicals
to be considered for the ToxCast screening and prioritization program (Dix et al. 2007; Judson et
al. 2009). Out of the TSCA inventory, these chemicals were selected due to medium- and
high-production volumes (exceeding 10,000 lb/year), known industrial functions as pesticides actives,
presence in the environment as drinking-water contaminants, or known inert chemicals (Judson
et al. 2009). Some of these chemicals are data-rich, enabling a way to compare the assay results
with precedent knowledge of the chemicals’ activities (Martin et al. 2011). In ToxCast, testing
3
be tested through a large, diverse number of HTS and HCS assays. In addition to ToxCast, EPA
is an active participant in Toxicity Testing in the 21st Century consortium (Tox21), an
Inter-Agency collaboration that takes a different strategy towards executing chemical tests. Using the
latest in automated HTS technologies, Tox21 tests all 10,000 chemicals through small groups of
assays; each Tox21 phase is a different set of assays (Huang et al. 2011). From these two
programs, at each phase, ToxCast would provide a broad view of chemical activity across
diverse biological endpoints while Tox21 would provide a means to rank the 10,000 chemicals
using assays that target endpoints of high concern.
Data Storage
With the large number of chemicals to be tested and even larger nest of HTS data
expected, data storage becomes a big factor. To list them explicitly, there would be the chemical
or substance identifiers, the structural features for each chemical or substance, the plate maps for
each tested chemical plate, the assay identifiers, the readout data and the analyzed data. To cover
these different needs, separate databases were devoted to capture the information. Judson et al.
(2012) mentions that ToxCast plans to disseminate the data storage to a number of different
databases of specific function. The EPA Distributed Structure-Searchable Toxicity (DSSTox)
program is dedicated to the chemical structure and linkage between chemical structures to
external data sources (Williams-DeVane et al. 2009; Judson et al. 2012). The EPA ToxCast
Database (ToxCastDB) would serve as the data repository for both the ToxCast assay data as
well as descriptive information about each assay. As a key component for biological modeling,
the EPA ToxRef Database (ToxRefDB), a database devoted to systematic curation of in vivo
4
historic toxicity endpoint information that may be available for them (Martin et al. 2009).
Similarly, the EPA ExpoCast Database (ExpoCastDB) stores data pertinent for exposure and
environmental presence modeling. Separately, the EPA Aggregate Computational Toxicology
Resource (ACToR) database combines the information from each of these EPA databases and to
other publicly available data sources. In general, these databases can communicate or be queried
via chemical structure and identity. This is a chemical-centric, test substance oriented point of
view, which is not developed for assay-centric or target-centric options.
Assay Terminology
With the push for advancing chemical testing, more questions and challenges about HTS
and HCS assays arise. The language for different aspects of in vitro assays was not formally
established to enable assay-centric search options. Perhaps more pertinent to ACToR and
ToxCastDB, this area of assay terminologies gets revisited when trying to communicate
similarities and differences between assays. For instance, protein assays were previously
synonymous with binding assays. Now, with new assay technologies developed to probe
different facets of protein function, a protein assay seems vague. Within ToxCast, a protein assay
could now mean enzyme-substrate reactions, receptor-ligand binding, protein expressions by
enzyme-linked immunosorbent assays (ELISA), changes in protein-protein interaction, or even a
marker protein for cytotoxicity or a pathway response (Kavlock et al. 2012). This area could
continue to propagate as new, abstract ways to consider a protein’s biological processes and
systems biological impact are developed.
Beyond the assay technology, the content readout has shifted towards more multiplexed
5
of targets (Romanov et al. 2008; Houck et al. 2009; Giuliano et al. 2010; Martin et al. 2010;
Rotroff et al. 2010). This is the real challenge: communicating to the general public what the
readouts of increasingly complex assays are with respect to the data already available from the
previous generation of single readout assays. This inherently demands a definition for the
minimum amount of information for an assay, for which there currently is not an agreed upon
standard across different technologies (Visser et al. 2011).
Moreover, different HTS campaigns have their own approaches towards describing and
categorizing their in vitro assay libraries. The ToxCast program purchases testing data for the
ToxCast chemical sets from various contract vendors, who have the technology and expertise to
perform patented assay protocols. Some of the past ToxCast publications emphasized the
biomedical innovation from assays purchased from different contract vendors while focusing on
utility of the data for modeling chemical and biological endpoints (Judson et al. 2010; Martin et
al. 2011; Sipes et al. 2011; Kleinstreuer et al. 2013). Hence, the mechanics, biological
innovations, and utility behind each HTS assay were separately explained with variations in the
terminology. A similar scenario can be seen of the Molecular Libraries Program (MLP), an NIH
funded HTS campaign that began in 2003. MLP uses different testing centers within the
Molecular Libraries Screening Center Network (MLSCN) to focus on different assay protocols
then deposits the chemical testing data into PubChem repositories (Wang et al. 2009; Chen and
Wild 2010). As such, the use of varying vocabulary has preset difficulties in understanding the
assays and in applying cross-analysis methods (Schürer et al. 2011).
The ToxCast HTS assays were previously annotated in a number of ways using
6
for chemical-to-pathway modeling and for anchoring in vitro to in vivo outcomes for predictive
models (Judson et al. 2010; Knudsen and Kleinstreuer 2011; Kleinstreuer et al. 2013). However,
with exception to the gene target annotations, the use of unstructured text without quality
controls gave way to mistakes in representation that were later remedied. Visser et al. (2011) has
described the utility of maintaining quality control checkpoints, a workflow step to inspect for
annotation mistakes in previous annotations and for annotating new assays moving forward.
Visser et al. also promotes the use of controlled, ontology vocabulary to help unify synonymous
concepts, where applicable. In doing so, the use of better annotation terms gets highlighted or, in
the lack thereof, the usage highlights the need for new concepts and terms.
Aside from publishing the articles with the HTS and HCS assay data, there are
communication challenges that sit between access to the data and knowledgeable use of the data.
There is currently no recognized, uniform guidance for the minimum amount of information (e.g.
metadata) needed to be supplied with the assay data across technologies (Vempati et al. 2012).
Alternatively, ontologies provide controlled vocabulary that may address relationships between
different assay concepts. There are a large number of database schemas and biological ontologies
currently available within BioPortal (bioportal.bioontology.org) that could provide controlled
vocabulary for annotation purposes. Among them, the BioAssay Ontology (BAO), an ontology
created from the University of Miami, has proposed a guidance framework that incorporates
vocabulary from different ontologies for objectively annotating HTS assay. This includes
provisions for the assay design, assay formats, detection technologies, perturbagen (further
referred as the tested chemical), and endpoints (Vempati and Schürer 2004; Visser et al. 2011;
Vempati et al. 2012). Within each of these annotations, subclasses may branch further, where
7
While ontologies may change, the ontology’s framework can be reused to guide
annotations. BAO version 1.6 has been used to annotate the assays deposited into PubChem for
relevant assay descriptive data (Schürer et al. 2011; Vempati et al. 2012). Schürer et al. (2011)
has applied these PubChem annotations as the basis for assay promiscuity evaluations, a
calculation method similar to a principle components analysis (PCA) to determine what
annotations of the assay are major contributors to the amount of noise and non-specific chemical
hits.
Because of this precedence, the use of BAO version 1.6 to annotate assays moving
forward may enable a uniformed language through which assay comparisons may be made.
However, several limitations in BAO were noted; the amount of terms incorporated into BAO
from other ontologies is not representative of each of those full ontologies. This suggests that
BAO keeps only the fraction of those ontology terms that have been encountered with each
update; therefore, newer and diverse assays may have concepts and terms outside of BAO’s
capacities. BAO is currently at version 2.0. Between versions, BAO has incorporated more terms
from Gene Ontology (GO) biological processes and Cell Line Ontology (CLO) into their
respective branches. The same creators of BAO have also created the G-Protein Coupled
Receptor Ontology (BAO-GPCR), enabling BAO annotation terms to link with BAO-GPCR
8 Chapter 2
Introduction
Seen as versatile, cost-effective, and a way to gain mechanistic insight, testing chemicals
in concentration-response using HTS and HCS assays with diverse biological endpoints
overcomes a number of disadvantages in whole animal toxicity testing (Judson et al. 2009;
Morisseau et al. 2009). The main advantage in using HTS assays is that novel biological targets
can be investigate through a wide range of in vitro assay technologies (e.g., receptor binding,
transcriptional activation, protein fragment complementation). The multiplexed and
multiparametric approaches make it possible to use a single assay for interrogating a battery of
targets, allowing for more pathway-based analyses and mechanistic learning all while reducing
testing cost and time (Romanov et al. 2008; Houck et al. 2009; Giuliano et al. 2010; Martin et al.
2010; Rotroff et al. 2010). With increased throughput, in vitro assay technologies are key
strategic tools to generate data on chemical-biological activity and step away from the heavy
reliance upon preliminary in vivo whole animal testing.
As HTS technologies continue to improve, questions are raised about how to capture the
increasing complexity while retaining the ability to relate between assays. Often described
non-uniformly, some HTS assays may have higher minimum information standards than what is
required for other technologies. Without adopting a consensus structure, the approaches to
describe assays may vary between different HTS initiatives. These inconsistencies in uses of
9
In the early stages of Tox21, the National Institute for Health (NIH) National Center for
Advancing Translational Sciences (NCATS) came up with a list of reporting parameters for HTS
and HCS assays (Inglese et al. 2007). This was a short list meant to minimally capture the
necessary components for the HTS screening and post-analysis. While the concepts were clear,
how to address the parameters required more clarity and instruction. Annotations would still
have used unstructured free-text.
Since then, BAO has proposed a guidance framework based on the screening information
produced from MLP. This framework nominates concepts that need to be annotated and
annotation terms for each annotation to use. What’s more, it captures more than the NCATS
reporting parameters while clarifying certain parameters that are better separated. Featuring clear
semantics and hierarchical relationships, BAO makes use of several ontologies of biomedical
and pharmacological focus and has applied their framework to annotate assays in the public
domain from PubChem and other data repositories (Vempati and Schürer 2004; Visser et al.
2011; Vempati et al. 2012). This highlights the BAO framework as a broad and integrative
foundation for capturing similarities and differences between assays within the realm of toxicity
testing.
The ToxCast Assay Annotation was developed to describe features represented in
ToxCast assay endpoints. Led by the EPA National Center for Computational Toxicology
(NCCT), ToxCast is tasked to test chemicals in the environment with the purpose of increasing
the biological-toxicological knowledge and informing chemical-testing decision-making.
Contracting with various laboratories and platform vendors, the ToxCast Phase I and II chemical
10
2004; MacDonald et al. 2006; Hartig et al. 2008; Romanov et al. 2008; Giuliano et al. 2010;
Huang et al. 2011; Sakamuru et al. 2012; Sipes et al. 2013). Assays vary from simple interactions
(e.g., biochemical binding or enzyme inhibition/activation) to complex biological reporters (e.g.
multiple targets, inferred targets, or cellular processes). The discussion on minimum information
standards has become increasingly technology-oriented (Goetz et al. 2011; Patlewicz et al.
2013). Adhering to minimum information standards makes a global assay annotation framework
difficult. Therefore, in annotating the ToxCast assays which have more technological and
biological diversity than in any screening program before it, it requires a uniform list of
annotations. Since BAO is the most comprehensive assay-oriented ontology currently available
among the 370 ontologies in BioPortal (http://bioportal.bioontology.org/), it was applied in a
structured approach that would allow for expansions to the annotations and annotation terms.
The primary objective of this study is to demonstrate the role of the ToxCast Assay
Annotation in understanding and analyzing HTS data. First, we describe the structured approach
used in the global annotation. Next, we show how these annotations can provide resolution to
understand the assay identification, design, target, or analysis information. Finally, we report on
an initial cross-analysis of the chemical-biological activity using the annotation terms. Example
scenarios are provided to illustrate how design and target annotations can be used to represent
11 Chapter 3
Methods
Data Sources
The inventory list of ToxCast assays was obtained from ToxCastDB (Judson et al. 2012).
The assays used to build the first version of ToxCast Assay Annotation was limited to only those
that have completed testing and analysis with ToxCast Phase I and II chemical sets. Assays that
met this criteria were found to belong to the following assay sources: 1) ACEA biosciences
(ACEA, www.aceabio.com) (Rotroff et al. 2013), 2) Apredica (APR, www.cyprotex.com) (Shah
et al., in-progress), 3) Attagene (ATG, www.attagene.com) (Romanov et al. 2008; Martin et al.
2010), 4) Bioseek (BSK, www.bioseekinc.com) (Kunkel et al. 2004; Houck et al. 2009), 5)
Novascreen (NVS, www.perkinelmer.com) (Knudsen et al. 2011; Sipes et al. 2013), 6) Odyssey
Thera (OT, www.odysseythera.com) (Yu et al. 2003; MacDonald et al. 2006), and 7) Tox21
(Huang et al. 2011; Sakamuru et al. 2012). EPA purchases the assay data generated from the
Assay Sources, while Tox21 provides assay data as part of an interagency collaboration. The
methodology for each assay was obtained from their respective ToxCast platform manuscripts,
vendor/program publications, or standard operating procedures (SOPs). For data analysis with
chemical testing data, the High-Throughput Chemical Screening Data from ToxCast & Tox21 as
part of the December 2013 ToxCast Phase II Data Release was used (ToxCast 2013).
Annotation Framework
The BAO version 1.6 (www.bioassayontology.org) was developed around six concepts of
12
(1) perturbagen (perturbing agents that are screened), (2) assay design (the underlying
methodology and strategy used for detecting a perturbation), (3) assay format (the chemical- and
biological-features common to the test condition), (4) detection technology (the physical method
used to detect and record perturbation signals), (5) meta-target (the molecular entity, biological
process, or event interrogated by the assay), and (6) endpoint (the analyzed measurements,
parameters and values). For the ease of maintaining the chemical inventory, the ToxCast
chemical library, representing the perturbagen component, is stored and routinely updated within
the DSSTox database (Williams-DeVane et al. 2009; Judson et al. 2012); hence, the ToxCast
Assay Annotation is meant to describe the other five concepts of biological screening.
The annotations can be separated into four sets of information. These four sets include
assay identification information (identifiers for each level, the assay source, and peripheral
catalog information), design information (format, design, and technology aspects that
decompress the assay’s innovations), target information (various perspectives about the assay’s
target), and analysis information (how the data were processed and analyzed). Each set of
information can be further separated into smaller concepts—the individual annotations. Each
annotation is rationally assigned to one of three levels, which represent the stage of the assay as
they undergo processing. Each annotation is annotated with an annotation term (the controlled
vocabulary) with respect to its level. These levels includes: the assay level–the experiment or test
event, the assay component level—the individual raw readouts within the experiments, and the
assay component endpoint level—the analyzed readouts which have been data fitted, such as to a
four-parameter Hill curve. In this way, the assignment puts an annotation as a feature of a certain
13 Figure 1: The annotation workflow
Data Input
The initial, data entry steps follow the left-and-middle portions of the workflow shown in
Figure 1. Initially, from the table of ToxCast assay component endpoints, each assay was
manually annotated to an Excel spreadsheet, following the BAO version 1.6 annotation template
as a model (Vempati and Schürer 2004). In this format, each column was an assay component
endpoint obtained from ToxCastDB and each row was an annotation. Thereafter, annotation
terms were selected in reference to the SOPs or the assay manuscripts.
After the initial steps the annotations were transitioned to a MySQL relational database
for better data structure and ease of quality control. The spreadsheet format permitted rigid
one-to-one assignments. This poses problems for the annotations that have one-to-many
relationships, such as reagents, which were kept semicolon delimited within each cell of the
14
each annotation to Assay, Assay Component, or assay component endpoints to be defined and
represented together as a table.
The ToxCast Assay Annotation MySQL database is mainly comprised of seven tables.
The AssaySource table provides some description for the contract vendor that performed the
assays. The Assay, AssayComponent, and assay component endpoint tables are analogous to
their levels, and contain the annotations assigned to the respective level. Reagents, technological
targets, and intended targets contain one-to-many relationships so they were separated as their
own tables. Respectively, Assay Reagents, Assay Component Target, and assay component
endpoint Target were mapped as dependents of the Assay, Assay Component, and assay
component endpoint tables.
Quality Control
Quality control checkpoints to inspect the manual curations occurred at two steps: (1)
transitioning the spreadsheet to the MySQL database and (2) for refining the annotations kept in
the MySQL database. At the first quality control checkpoint, the spreadsheet was transitioned
into a MySQL database and inspected for mismatched, mistyped, or erroneous entries. At the
second quality control checkpoint, the annotation terms are extensive reviewed for appropriate
coverage and representation. We also reviewed the annotations to inspect for appropriate
transmission of information. Wherever necessary, additional ontologies were incorporated to
supplement the annotation terms from BAO. Table 1 displays the 37 annotations selected for
15
Table 1: The 37 annotations used and the short description of the concepts they capture
Annotation name Short description of the annotation
assay source name a short name for the entity that conducted the assay assay source long name the long name for the entity that conducted the assay
assay name a short name for the assay
assay component name a short name containing the assay and its component readout
assay component endpoint name a short name containing the assay, the component readout, and the analysis applied timepoint hr the duration length to conduct the test portion of the assay
organism id the NCBI taxonomy id for the organism or cellular derivative used for the assay organism* the organism related to the target of the assay
tissue the organ-level, anatomical entity of the protein or cell used in the assay cell format the cellular or subcellular format of the assay
cell free component source the cellular or sample tissue source of the assayed gene protein cell short name the name of the cell line or primary cell used
cell growth mode* the growth mode of a cell line
assay footprint the physical format, such as plate density, in which an assay is performed assay format type* ¥ the conceptual biological and/or chemical features of the assay system content readout type* the throughput and information content generated
assay design type* ¥ the method that a biological or physical process is translated into a detectable signal detection technology type ¥ the type of detection signal
detection technology the name of the detection technology method key positive control the designated positive control
dilution solvent the solvent used as the negative control and to make the test chemical soluble dilution solvent percent max the maximal amount of the dilution solvent that could be present during an assay key assay reagent type the type of key determinant substance of the assay
key assay reagent the name of the key determinant substance of the assay
assay function type the purpose of the analyzed readout in relation to others from the same assay biological process target the biological process or processes investigated by the assay
normalized data type the fold induction or percent activity scale in which the assay data is displayed signal direction type the expected direction of the detected signal in relation to the negative control analysis direction the analyzed positive (upward) or negative (downward) direction
signal direction the direction observed of the detected signal in relation to what was expected of it technological target type ¥ the measured chemical, molecular, cellular, or anatomical entity
technological target gene id the Entrez gene ID for the molecular target measured by the assay technological target gene symbol the Entrez gene symbol for the molecular target measured by the assay intended target type ¥ the objective chemical, molecular, cellular, pathway or anatomical entity intended target gene id the Entrez gene ID for the molecular target that is the objective of the assay intended target gene symbol the Entrez gene symbol for the molecular target that is the objective of the assay intended target family ¥ the target family of the objective target for the assay
Culture or Assay the culture or assay condition for reagent annotations Reagent Name Value type the type of substance or function served by the reagent Reagent Name Value the name of the reagent
* The descriptions are borrowed in part from the BAO definitions; ¥ Has an annotation to describe a subset
Standardized Vocabulary for Annotation
BAO is the principle source of annotation terms. Additional ontologies were used to
16
NCBI Organismal Classifications (NCBI Taxon), an ontology for species taxonomy, was used
for the organism and organism id annotations. To standardize the cell short name annotation
terms, the Cell Line Ontology (CLO), an ontology for cell line information, was used for ‘cell
line’ cell format (e.g. ‘CHO-K1’ is the more commonly used derivative of Chinese Hamster
Ovaries) (Sarntivijai et al. 2011), while Cell Ontology (CL), an ontology for in vivo cell types,
was used for ‘primary cell’ or ‘primary cell co-culture’ cell format (e.g. ‘umbilical vein
endothelium’ is the annotation term for what is more commonly referred to HUVEC cells)
(Meehan et al. 2011). In this way, we can identify higher level anatomical entities that the
annotation terms may belong to (e.g. ‘brain’ tissue includes ‘Rat forebrain’, ‘Rat cortical
membranes’, ‘KAN-TS cells’ and ‘Bovine hippocampal membranes’).
While this is not an ontology, the NCBI Entrez Gene annotation files for human, rat,
mouse, and bovine were used to annotate gene symbols and gene ids for the
technological_target_gene_id, technological_target_gene_symbol, intended_target_gene_id, and
intended_target_gene_symbol annotations (Maglott et al. 2011).
The organism and organism id annotations are generally annotated according to the cell
short name. In an assay performed in a cell-based format, the general understanding is that the
host cell will have cellular machinery that influences the gene and outcome of the assay. The
exception is given to assays performed in a cell-free format, where genes are transfected into
expression vehicles, extracted, and used in assays without additional cellular component. In that
17 Modifications to annotations and annotation terms
From the BAO framework, the assay format concept was reorganized and separated into
two annotations, assay format type and cell format. Assay format type identifies the overall
chemical-feature or biological-response being investigated as ‘biochemical’, ‘physicochemical’,
‘cell-based’, or ‘whole organism’ (Vempati and Schürer 2004). The cell format type adds
resolution to the assay format type by represents the cells as immortalized cell lines or primary
cells, and whether they are treated as homogenous cultures, heterogeneous co-cultures, or
cell-free extracts during the course of the assay.
Two reporter types were added to the assay design type annotation terms. The
‘background reporter’ was introduced as a reporter type for baseline noise, while the ‘growth
reporter’ characterizes assays that measure cellular development without intracellular or
extracellular morphological endpoints.
To make the assay protocol information transparent, a few annotations are devoted to
capturing these details for reporting purposes. At present, due to the lack of formal annotation
terms for reagent materials, the reagent name value uses unstructured text. However, the reagent
name value type contains 32 possible annotation terms to annotate the base medium, serum
variety, culture or assay duration, additional reagent types (e.g. antibody, extractor, fixing agent,
or stain), environmental factors (e.g. pH level and temperature), and the expected number of cells
in the well by the beginning of the assay. Since the assay is influenced by the preparatory
protocols during cell culturing and conditioning, the annotation separates the reagents used for
the preparatory, cell ‘culturing’ conditions from the experimental, ‘assay’ conditions. If it is
18
Within the BAO version 1.6 framework, the ‘molecular targets’ was a branch of the meta
targets concept. Here, the annotation terms in the ‘molecular targets’ was used as the basis for
the target type annotations—technological target type and intended target type—and their
subtype annotations. The difference between these two annotations is displayed in Table 1.
‘Chemical’, ‘cellular’, and ‘pathway’ annotation terms were added to the target type
annotation. Specifically, the ‘chemical’-type targets were given the subtypes ‘physical feature’,
‘ATP’, or a hormone chemical name (e.g. ‘Cortisol’, ‘Corticosterone’, or ‘Estrone’).
“Cellular”-type targets can be given to scenarios where the focus is a morphology or function, so the
subtypes may include the “cellular” or a subcellular object (e.g. mitochondria, nucleus, or
lysosome). For ‘protein’-type targets, the subtypes ‘protein-specified’ was included for targets
where the gene protein is known but not pursued for a certain function (e.g. not functioning for
‘enzyme’-substrate or ‘receptor’-ligand reactions). Furthermore, ‘protein-unspecified’ was
included for targets that non-specifically tagged proteins. Similarly, ‘pathway’-type targets and
the ‘pathway-specified’ subtype was introduced as an annotation term for assays that probed
known gene-mediated biological pathway, such as assays screening for estrogen receptor-alpha
agonists.
Visualization Software and Data Analysis
NCBO BioPortal is a website used as the main source for viewing different ontologies
and how they map to other ontologies, and to download archived ontology files. In addition,
Protégé, an open-source software, was used to view web ontology language (owl) format files
and for conducting SPARQL queries. Cytoscape, an open-source software platform for
19
software was used to read-in and rearrange data files, and to perform the principle components
analysis using the prcomp function from the R Statistical library.
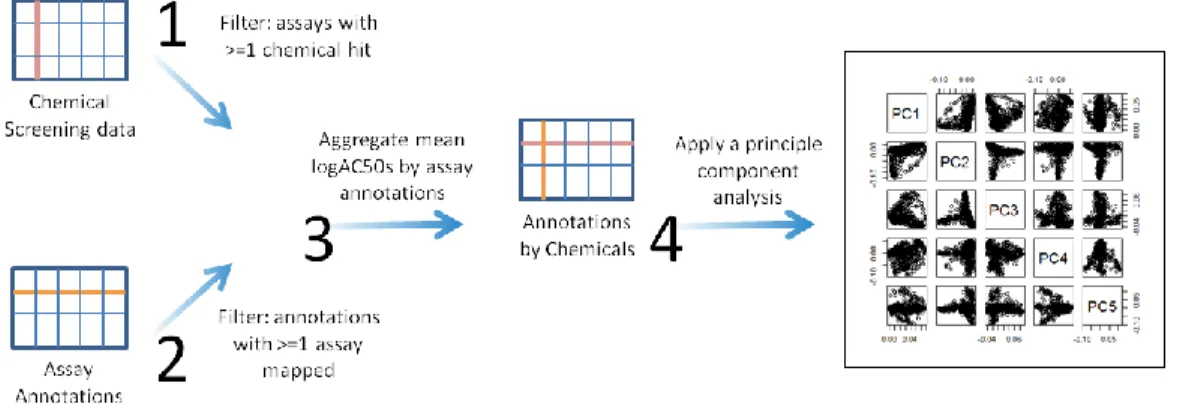
Figure 2: PCA workflow of the chemical screening data
A principle components analysis (PCA) was conducted to investigate the variances
observed in the High-Throughput Chemical Screening Data from ToxCast & Tox21 (December
2013) with regards to the ToxCast Assay Annotations, shown in Figure 2. 50% of Maximal
Activity Concentration (AC50) values were obtained for each chemical and assay component
endpoint pair. Using R statistical software, these values were filtered for assays with at least one
chemical hit (i.e. values not equal to ‘100000’ or ‘NA’), then they were divided by 100000 and
negative log transformed. Moreover, we removed the APR_1hr assays (n=20 assay component
endpoints), which were discontinued after Phase I testing, and the BSK_SM3C assay (n=28
assay component endpoints), which had undergone a name change to BSK_CASM3C prefix
between phases. Next, an assay annotation binary table was generated to show mapping between
assay component endpoints and annotation terms. Reagent information and assay identification
annotations aside from the assay component endpoint were excluded. The log-AC50 values then
were merged with this Assay Annotation binary table, and filtered to retain only the annotation
20
annotation term is at least 1). The log-AC50 values were then aggregated by each annotation
term, and NA or NaN data on each row (annotation term) were normalized to the mean of the
numeric values. The data were then processed using the prcomp function and the loadings were
visualized using the heatmap.2 function from the gplot library. The R script is displayed as
21 Chapter 4
Results
Assay Annotation Structure
The ToxCast Assay Annotation structured the 37 annotations adopted from the BAO
framework and used them to capture annotations for 795 ToxCast assay component endpoints.
The annotation structure follows the four sets of information and progresses from the ‘assay’
level to the ‘assay component endpoint’ level (Figure 1). Used to describe HTS assays, the
primary goal of this thesis is to establish a structured annotation scheme that uses ontology-based
annotation terms as controlled vocabulary, where applicable. In addition, these annotations can
be used to understand general trends observable among the annotated HTS assays as well as
explain variances observed among the screening data.
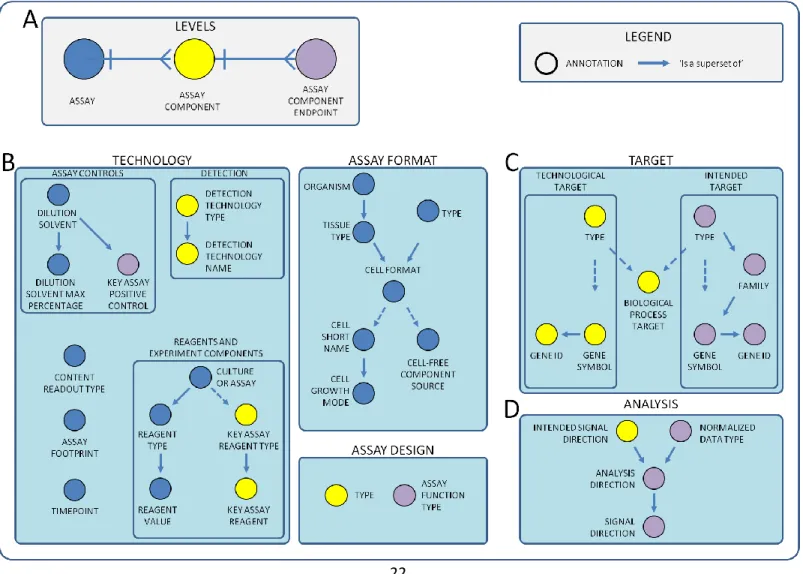
The annotation structure displays dependencies between annotations that follow the same
concepts. Solid arrows are depicted for relationships between annotations where one annotation
term influences the next. As seen between the intended target type and intended target family,
‘protein’ or ‘pathway’ intended target types would merit the intended target family to be
annotated with a gene family; when the intended target type is ‘cellular’, the intended target
family may be a ‘cell cycle’ or ‘cell morphology’ annotation term to follow suit. Alternatively,
annotations linked by dashed arrows suggest a conditional relationship. If given certain
22
Figure 3: The annotation structure. The annotations can be grouped into A) assay identification information, B) design information, C) target information, and D) analysis information. Relationships between annotations are either one-to-many (solid arrow) or
23
assay that uses ‘primary cell co-culture’ cell format, it is unnecessary to annotate the cell-free
component source.In that situation, the cell-free component source get default values equal to
NA or 0, if the annotation is numeric. In another example, for a ‘cellular’ intended target type, it
may be unnecessary to annotate target gene symbol or gene id, so both are defaulted. The use of
dashed arrows is a reflection that different assay technologies may have minimum information
standards that may be seen as inapplicable with each other.
Assay Identification Annotation
Kavlock et al. (2012) reports the general study designs, technologies applied, and unique
features from each Assay Source. Here, after controlling vocabulary used across Assay Sources,
Table 2 reflects that total unique features per Assay source with reference to each level. Using
the 795 ToxCast assay component endpoints library found to have complete ToxCast Phase I and
II chemical screening data, the analyzed data were linked back to 541 unique assay components,
which were generated from 328 assays (Table 2). Over 23,000 annotation terms have been
annotated across the 26 design and analysis information annotations for these 795 assay
component endpoints. For their respective assays, there are roughly 2,800 records for reagents
and testing protocol information (approximately 8,400 annotation terms as both structured and
unstructured text), and about 1,400 records for target information (approximately 7,000
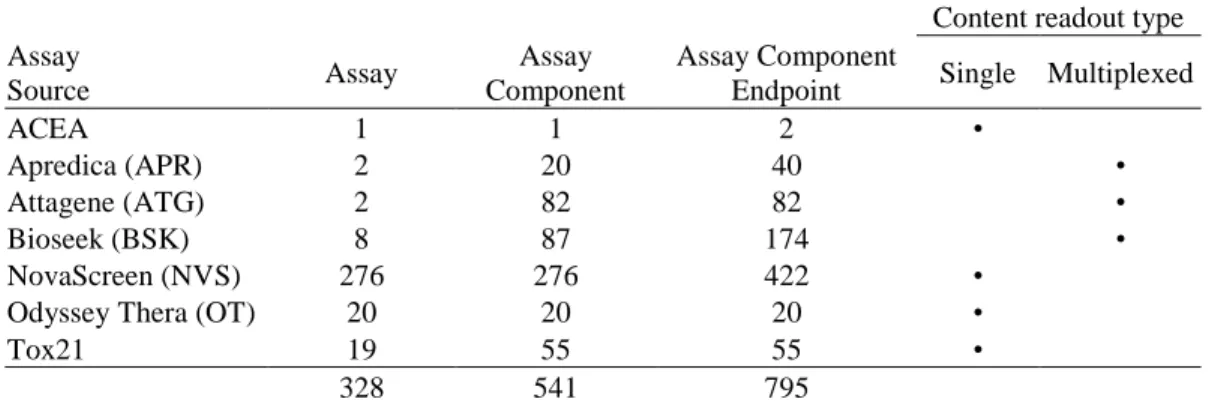
24 Table 2: Assay information and content readout types
Content readout type Assay
Source Assay
Assay Component
Assay Component
Endpoint Single Multiplexed
ACEA 1 1 2 •
Apredica (APR) 2 20 40 •
Attagene (ATG) 2 82 82 •
Bioseek (BSK) 8 87 174 •
NovaScreen (NVS) 276 276 422 •
Odyssey Thera (OT) 20 20 20 •
Tox21 19 55 55 •
328 541 795
The assay component is meant to normalize single versus multiplexed/multiparametric
assays according to individual readouts. Depending on the content readout type, the number of
targets that a single experiment can probe is analogous to the number of assay components
deriving from the same assay. At present, the ToxCast assays seem to trend as single or
multiplexed. Shown in Table 2, NVS and OT assays are found to be characteristic single-readout
assays displaying equal assay to assay component counts. In contrast, ATG, APR, and BSK are
multiplexed-readout assays that measure a battery of individual targets including some that serve
as background detection or as a measure of viability. NVS accounts for the highest number of
assays, assay components, and assay component endpoints, while ATG assays account for the
highest number of assay component endpoints per assay conducted.
Some assays do not follow strictly to the conventions of content readout type but provide
interesting variants of the single-readout type. The ACEA assay only generates a single readout;
however, the upward and downward curve-fit analysis can yield findings for two different
intended targets. The cell line used by the ACEA_T47D assay is sensitive to estrogen-receptor
25
in the ‘gain’ of signaldirection, while serving a cell viability purpose in the ‘loss’ of signal
direction. Similarly, Tox21 assays are meant to generate a ratio to represent the pattern of
activity. This is seen first as background and raw readout (i.e. Channel 1 and 2 wavelength
measurements), and a viability readouts. The ratio can be calculated as a ratio of Channel
2/Channel 1 readouts, and the viability readouts could then be used to inspect for possible
artifacts or excessive cytotoxicity affecting the quality of the readouts.
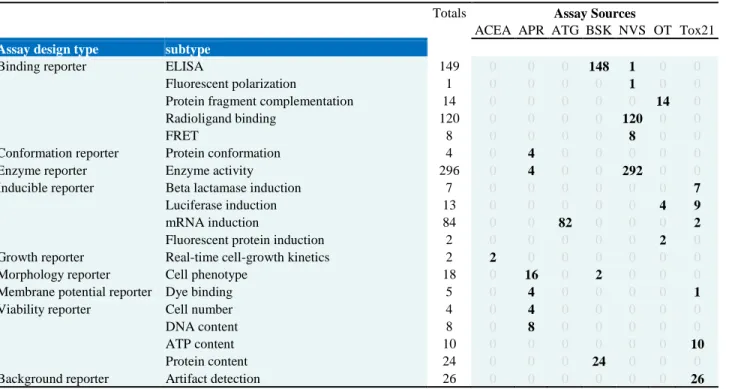
Assay Design Annotation
The assay design type and detection technology type annotates the objective of the
measurement and the method of collecting quantified data. A majority of ToxCast assays were
found to be ‘binding reporter’, ‘enzyme reporter’ or ‘inducible reporter’ assay design types
(Table 3). These reporter types assess different facets of how chemicals may affect genes of
concern.
Table 3: Assay design types annotated to ToxCast Assay Components Endpoints
Totals Assay Sources
ACEA APR ATG BSK NVS OT Tox21 Assay design type subtype
Binding reporter ELISA 149 0 0 0 148 1 0 0
Fluorescent polarization 1 0 0 0 0 1 0 0
Protein fragment complementation 14 0 0 0 0 0 14 0
Radioligand binding 120 0 0 0 0 120 0 0
FRET 8 0 0 0 0 8 0 0
Conformation reporter Protein conformation 4 0 4 0 0 0 0 0
Enzyme reporter Enzyme activity 296 0 4 0 0 292 0 0
Inducible reporter Beta lactamase induction 7 0 0 0 0 0 0 7
Luciferase induction 13 0 0 0 0 0 4 9
mRNA induction 84 0 0 82 0 0 0 2
Fluorescent protein induction 2 0 0 0 0 0 2 0
Growth reporter Real-time cell-growth kinetics 2 2 0 0 0 0 0 0
Morphology reporter Cell phenotype 18 0 16 0 2 0 0 0
Membrane potential reporter Dye binding 5 0 4 0 0 0 0 1
Viability reporter Cell number 4 0 4 0 0 0 0 0
DNA content 8 0 8 0 0 0 0 0
ATP content 10 0 0 0 0 0 0 10
Protein content 24 0 0 0 24 0 0 0
26
Some assay component endpoints such as BSK_3C_IL8_down are binding reporters by
way of ELISA immunoassay systems, which assess target protein expression levels (i.e.
decreases in IL8). In contrast, NVS_ADME_hCYP1A1_Activator considers how the gene
protein’s normal enzyme-substrate functions get affected by chemical competitive or inhibitory
action; in this case, it assesses the level by which the enzyme-substrate functions increases.
While inducible reporters may vary, some like OT_AR_ARE_LUC_Agonist_1440 use
transfected firefly luciferase to probe the level of transcriptional induction.
In addition, APR and Tox21 assays were found to have made use of ‘conformation
reporters’, ‘enzyme reporters’, ‘morphology reporters’, ‘membrane potential reporters’, ‘viability
reporters‘, and ‘background reporters’. This identifies that certain assay design type may be
specific to certain assay technologies or methodologies.
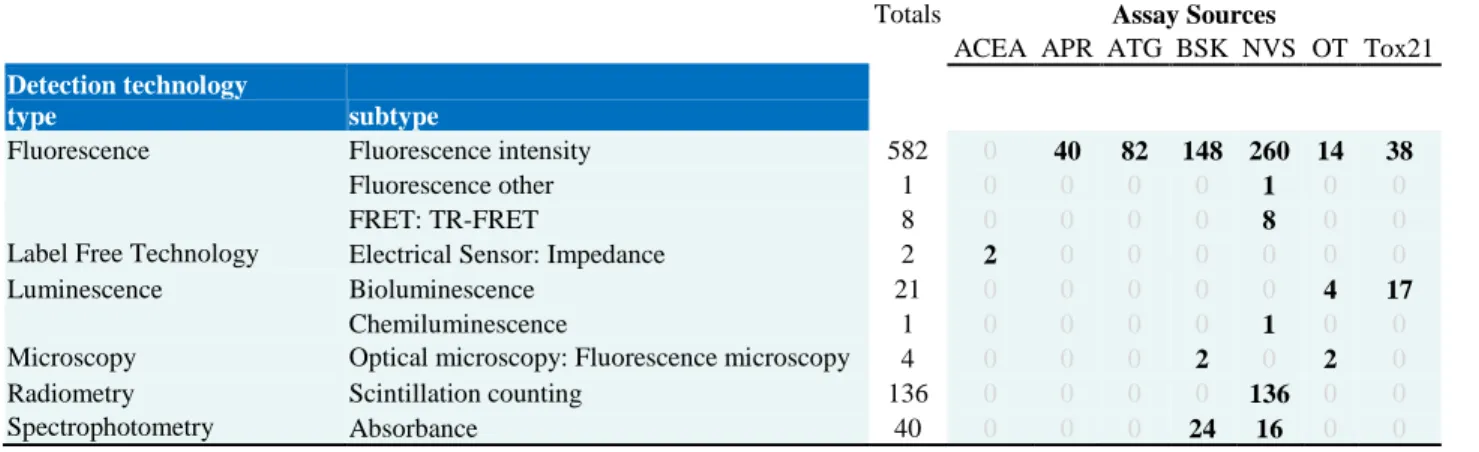
Most ToxCast assays use ‘fluorescence’ or ‘radiometry’ detection technology types
(Table 4). ‘Fluorescence intensity’ is often the method of quantification for ‘fluorescence’-type
assays, which are observed in assays from all assay sources except ACEA. For assay component
endpoints associable to ‘radiometry’-type detection technology, ‘scintillation counting’ is often
the method of choice for radioligand binding assays, found here to be specific to NVS assays.
Though in low presence, ‘label-free technologies’, ‘luminescence’, ‘microscopy’, and
‘spectrophotometry’ detection technology type annotation terms were annotated for at least one
27
Table 4: Detection technology types annotated to ToxCast Assay Components Endpoints
Totals Assay Sources
ACEA APR ATG BSK NVS OT Tox21 Detection technology
type subtype
Fluorescence Fluorescence intensity 582 0 40 82 148 260 14 38
Fluorescence other 1 0 0 0 0 1 0 0
FRET: TR-FRET 8 0 0 0 0 8 0 0
Label Free Technology Electrical Sensor: Impedance 2 2 0 0 0 0 0 0
Luminescence Bioluminescence 21 0 0 0 0 0 4 17
Chemiluminescence 1 0 0 0 0 1 0 0
Microscopy Optical microscopy: Fluorescence microscopy 4 0 0 0 2 0 2 0
Radiometry Scintillation counting 136 0 0 0 0 136 0 0
Spectrophotometry Absorbance 40 0 0 0 24 16 0 0
Table 5: A comparison of the assay design subtypes by the detection technology subtypes
Detection technology subtypes
F lu o re sc en ce in te n sity S cin ti ll ati o n c o u n ti n g Ab so rb an ce Bio lu m in esc en ce F RET : TR -F R ET F lu o re sc en ce m icro sc o p y El ec tri ca l S en so r: Im p ed an ce F lu o re sc en ce p o lariz ati o n Ch em il u m in esc en ce
Assay design subtypes No of assay component endpoints 594 136 40 21 8 4 2 1 1
enzyme activity 296 264 16 16 0 0 0 0 0 0
immunoassay: elisa 149 148 0 0 0 0 0 0 0 1
radioligand binding 120 0 120 0 0 0 0 0 0 0
mRNA induction 84 84 0 0 0 0 0 0 0 0
cell phenotype 26 24 0 0 0 0 2 0 0 0
protein content 24 0 0 24 0 0 0 0 0 0
artifact detection 20 20 0 0 0 0 0 0 0 0
protein fragment complementation assay 14 14 0 0 0 0 0 0 0 0
luciferase induction 13 0 0 0 13 0 0 0 0 0
DNA content 12 12 0 0 0 0 0 0 0 0
ATP content 10 2 0 0 8 0 0 0 0 0
FRET 8 0 0 0 0 8 0 0 0 0
beta lactamase induction 7 7 0 0 0 0 0 0 0 0
dye binding 7 7 0 0 0 0 0 0 0 0
cell number 6 6 0 0 0 0 0 0 0 0
protein 6 6 0 0 0 0 0 0 0 0
fluorescent protein induction 2 0 0 0 0 0 2 0 0 0
real-time cell-growth kinetics 2 0 0 0 0 0 0 2 0 0
28
A comparison between the two annotations suggests that the same detection technology
type may assess different assay design types; conversely, the same assay design type may be
assessed by different detection technology types (Table 5). It is noteworthy to mention
‘fluorescence’ detection technology type, which have beenapplied to all assay design types
except ‘growth reporters‘, reflects that fluorescent protein and probe technologies have
developed in greater extents for HTS targeted measurements compared with other technologies.
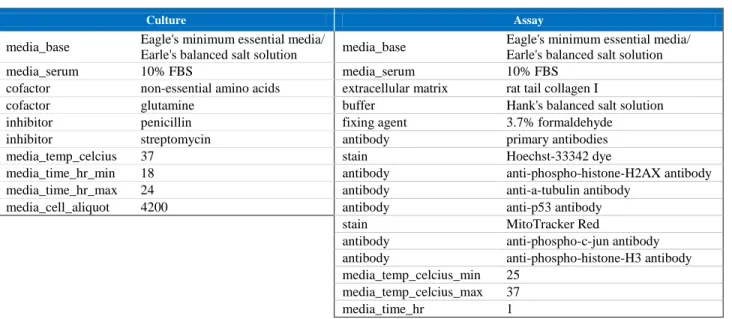
Related to the detection technology, it was found that the reagent and experimental
components annotations come secondary to the format annotations. We attempted to capture the
conditions of the test environment, but in doing so found that separate protocols are used for
preparations prior to the assay (the culture conditions) compared to the actual assay. Shown in
Table 6 is an example of the reagent information for the APR_HepG2_1hr assay. Under the
Culture and Assay conditions, we display the types of reagent of condition used (left) and the
name or value to that reagent or condition (right). Table 6 is somewhat representative of the
cell-based high-content screening assays, as opposed to cell-free biochemical assays which are only
29
Table 6: Reagent and components information for the APR_HepG2_1hr assay
In addition, depending on the assay, if a reagent is the key factor(s) towards quantifying
signal changes, then the reagent(s) would also be annotated as the key assay reagent, an
annotation of the assay component level. Generally, this means that the reagent is captured as a
factor of the ‘assay’ conditions. Taking the APR_HepG2_1hr reagents, the MitoTracker Red
(stain) is necessary for identifying the mitochondria within each cell, and so it is highlighted as
the key assay reagent forAPR_MitoMembPot_1hr and APR_MitoMass_1hr assay components.
However, like for ATG CIS and TRANS assays, specific reporter transcription unit (RTU) used
during the cell-culturing preparatory protocols are central towards the reporting of the respective
readouts. Moreover, it is worthy to mention that label-free technologies, such as the cell
electrical sensing used for the ACEA_T47D assay, would not have a key assay reagent.
While the connections could not be displayed in Figure 3, the assay format type and the
cell format, and in some instances the cell short name, have a predominant influence upon the
reagent use. Certain reagents are necessary for the culture of cell-based versus biochemical assay
Culture Assay
media_base Eagle's minimum essential media/
Earle's balanced salt solution media_base
Eagle's minimum essential media/ Earle's balanced salt solution
media_serum 10% FBS media_serum 10% FBS
cofactor non-essential amino acids extracellular matrix rat tail collagen I
cofactor glutamine buffer Hank's balanced salt solution
inhibitor penicillin fixing agent 3.7% formaldehyde
inhibitor streptomycin antibody primary antibodies
media_temp_celcius 37 stain Hoechst-33342 dye
media_time_hr_min 18 antibody anti-phospho-histone-H2AX antibody
media_time_hr_max 24 antibody anti-a-tubulin antibody
media_cell_aliquot 4200 antibody anti-p53 antibody
stain MitoTracker Red
antibody anti-phospho-c-jun antibody
antibody anti-phospho-histone-H3 antibody
media_temp_celcius_min 25
media_temp_celcius_max 37
30
format types. The same is observed for assays that use ‘primary cells’ or ‘primary cell
co-cultures’ versus ‘cell lines’. Certain cell lines will have more specific media and serum
specifications than others. Table 7 provides a short summary of the three most commonly used
organism and tissue types by each assay source, and how many unique cell short names or cell
free component source used by each assay source were annotated to one of five possible cell
format types.
Table 7: Organism/tissue types and cell format types
ACEA APR ATG BSK NVS OT Tox21
Unique Organism & Tissue-types 1 1 1 3 30 5 6
Most frequently used human
(breast) human (liver) human (liver) human (vascular) human (recombinant) ¥ human (kidney) human (kidney)
2nd most frequent human
(skin) rat (brain) Chinese hamster (ovary) human (breast)
3rd most frequent human
(lung) rat (recombinant) ¥ human (cervix) human (liver)
Cell format types
cell line 1 3 2 0 0 20 19
primary cell 0 0 0 4 0 0 0
primary cell co-culture 0 0 0 4 0 0 0
cell-free 0 0 0 0 188 0 0
tissue-based cell-free 0 0 0 0 88 0 0
¥ Target gene proteins were extracted from expression vehicles (e.g. insect cells, bacterial, or cell lines)
Target information
The names of the ToxCast assay component endpoints may not immediately focus on the
intended target. In fact, with just the assay component endpoints alone, it will be a challenge to
determine what the targets are at all. The intended target is the objective probe of the chemical
bioassay, and it can often be said to be the center of communication in regards to the chemical’s
31
measured either directly or through an interpretation that uses the technological target. The
current annotation uses technological target type, intended target type, biological process target,
intended target family type and gene annotations to distinguish these different motifs.
Across the 795 ToxCast assay component endpoints, by gene ID and target type
combinations, there are 383 unique technological targets and 387 unique intended targets. The
technological target types range from ‘DNA’, ‘RNA’, ‘protein’, ‘cellular’ and ‘chemical’ types,
while the intended targets include ‘protein’, ‘cellular’, ‘pathway’, and ‘chemical’ types. Though
it may be simplest to annotate one target per assay, this approach overlooks the value in
multiplexed assay readouts. The technological and intended target annotations were created to
dissociate assays that use different means to measure the same intended target.
A comparison of the technological and intended targets shows that some assays make
direct measurements, while others use the technological target as a quantifiable surrogate for the
intended target. Table 8 summarizes the occurrence of these measurement relationships with
regards to the target types from each assay source. Assays that make direct measurements have
the same annotations for technological and intended target types and gene ids. Alternatively,
assays may make use of technological targets as quantifiable surrogates or close substitutes to
approximate the intended target, shown boxed in Table 8.
Table 8: Comparison of technological and intended target types
ACEA APR BSK Tox21 ATG BSK NVS Tox21 ACEA APR OT Tox21
Intended cellular protein pathway chemical
Technological
cellular (25) 1 8 12 3 0 0 0 0 1 0 0 0
protein (662) 0 4 8 0 0 154 422 24 0 16 34 0
RNA (138) 0 0 0 0 138 0 0 0 0 0 0 0
DNA (12) 0 8 0 0 0 0 0 0 0 4 0 0
32
Most of the ToxCast HTS assays are straight-forward technologies that make direct
measurements. Displayed in Table 8 as the unboxed values, there are 24 ‘cellular’, 600 ‘protein’,
and 12 ‘chemical’ targets directly measured by an assay component endpoint from each assay
source. For example, the BSK ELISA-based assays (e.g. BSK_3C_MIG_dn) use protein-specific
antibodies to bind to specific target genes. The change in fluorescence would be directly relative
to the protein expression level at each concentration tested. In a similar way, the Tox21
autofluorescence assays (e.g. Tox21_Autofluor_HEPG2_Cell_green) aim to detect inherent
fluorescent properties from the test substance. These assays probe different color wavelengths to
observe baseline changes that could be concentration-dependent artifact fluorescence from the
chemical.
Alternatively, assays may target an abstract component of the intended target’s biology as
a function of the technological target. Shown in Table 8 as boxed values, there are 30 ‘cellular’,
138 ‘protein’, and 55 ‘pathway’ targets assessed by various methods and technological target
types. For instance, OT_PPARg_PPARgSRC1_0480 measures the fluorescence generated from
the complementary binding of human peroxisome proliferator-activated receptor gamma (gene
symbol: PPARG, gene ID: 5468) with the v-src kinase (gene symbol: SRC, gene ID: 6714).
Changes in the measured level of fluorescence and relative localization within the cell are
indicative of changes along the PPARG signaling pathway. For assays where the concept
becomes too complex to represent by target type and gene annotations alone, the biological
process target would be annotated. Take ATG_PPRE_CIS for example. human Peroxisome
Proliferator-Activated Receptor Alpha, Delta and Gamma—PPARA (gene ID: 5465), PPARD
33
measured together as a unit as downstream products of transcription factors binding to the
Peroxisome Proliferator-activated Response Element (PPRE). Changes to the mRNA levels of
these target genes reflect chemical effect to the upstream transcriptional events, so the biological
process target is the‘regulation of the transcription factor activity’.
Furthermore, to represent a complex signaling or regulatory pathway as the assay target,
the biological process target is used in conjunction with reference gene focal to that pathway.
For instance, the ACEA assay monitors cellular growth kinetics as an indication of cytotoxicity
or estrogen receptor alpha (ESR1) signaling for cell proliferation. Respectively, the cytotoxicity
intention has a ‘cellular’ intended target type and ‘cell cycle’- ‘cytotoxicity’ intended target
family. The cell proliferation intention has ‘pathway’ intended target type, ESR1 as the intended
target gene symbol, ‘nuclear receptor’ and ‘steroidal’ as the intended target family, and
‘regulation of cell proliferation’ as the biological process target.
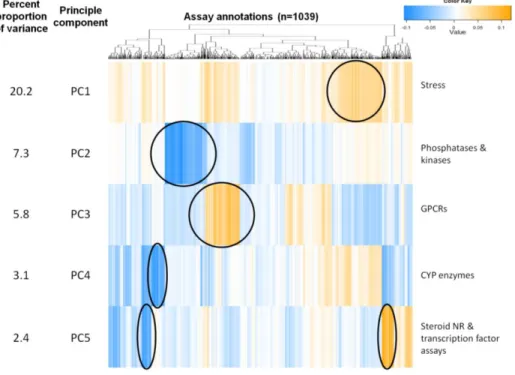
To group the 387 unique intended targets, we developed 24 intended target families (84
subfamilies). Figure 4 is a simple connection map displaying the intended target families to their
intended target subfamilies, sized by the number of times an intended target gene is mapped to
those annotation terms. Three main categories currently exist in the intended target families: 2
cellular aspects (i.e. ‘cell cycle’ or ‘cell morphology’), 21 gene families (e.g. ‘GPCR,’ ‘kinase,’
or ‘protease’), and one for quality control aspects (i.e. background measurements), shown in
Appendix 1. The intended target families have one-to-many relationships with the intended
target genes, providing a means to filter down to the targets of interest or to query for assay
35
The structure to the intended target families is a work-in-progress that attempts to pull in
groupings from various ontology sources. First, we realize that gene protein vocabulary bear
intricate connections in terms of the active/inactive sequence domains, functions, and
relationships between superfamily, family, subfamily and many more categories. These
categories are often unevenly distributed between categories making it difficult to communicate
as some are more developed than others. For the majority of gene proteins, groupings are formed
based on function and similarity in protein sequence. Some groupings are under debate as more
gene proteins are characterized and the functions annotated. The intended target families and
intended target subfamilies areover-simplifications; they are an attempt to cross-sectionally
group the target genes within reason by their first and second order associations. Often, this
means the gene-oriented intended target families are the class of proteins, and the intended target
subfamilies are actually the regarded superfamilies under that class.
From same creators as BAO, the G-Protein Coupled Receptors Ontology (BAO-GPCR)
was used to define the high-leveled subfamilies within the domain of G-protein coupled
receptors (GPCRs) (Przydzial et al. 2013). Unfortunately, for most of the other gene-oriented
intended target families, there is not a single well established and publicly ontology to represent
each topic area. This can be seen with the kinase family, which continues to have new gene
proteins discovered and new subfamilies introduced; thereby, older classifications are antiquated
and new introductions are not well-characterized (Manning et al. 2002). The five intended target
subfamilies for kinases displayed are a product between the schemes used in the KinaseDB, the
WikiKinome, National Cancer Institute Thesaurus (NCIT) and Medical Subject Headings
(MeSH). The same can be said for the ‘Protease’, ‘Phosphatase’, and many other gene-oriented
36
When mapped out, we found that 62 intended target gene symbols have homologs genes
investigated within ToxCast. These gene symbols were mapped back to 145 assay component
endpoints thatcould be used for comparison of orthogonal assays (see Appendix 2), excluding
those genes that were mapped to only one assay component. These genes belong to the ‘nuclear
receptor’, ‘dna binding’, ‘growth factor’, ‘protease’, ‘cyp’, ‘esterase’, ‘gpcr’, ‘ion channel’, and
transporter intended target families. Furthermore, among these identified assay component
endpoints, 24 non-human genes investigated by NVS cell-free protein-binding assays have a
human homolog investigated among the rest of the identified 145 assay component endpoints.
These assay component endpoints open the possibilities to compare orthogonal assays for
understanding different chemical interaction patterns and for comparisons across different
species.
Assay Analysis Information
Assay component endpoints distinguish the data processing decisions applied unto the
raw assay component data, represented in Figure 4 by four annotations. Differences in the
concepts covered in these annotations are represented in Table 1. The normalized data type
prominently observed in ToxCast assay component endpoints is ‘percent change’. Subsets of
ATG (n=80) and BSK (n=174) assay component endpoints are annotated as ‘fold induction’
type. ‘Fold induction’ normalization uses the performance of the negative control as the baseline
reference, while ‘percent change’ uses the performance of negative control as the baseline and
positive control for normalizing the maximal activity. The analysis direction details whether the