A Polyphase DSP-based electricity measurement system
a with network analyzer
Rok Marolt, Andrej ˇ
Zemva
Iskraemeco, Savska Loka 4, 4000 Kranj, Slovenia
Abstract. This paper represents a three-phase precision measurement system for the electronic electricity meter based on a digital signal processor (DSP) in combination with a multichannel analog-to-digital converter. The measurement system capabilities include all the usual assessments of the energy, power, voltage and current, but functionality of this precision measurement system is extended into the domain of power network quality analyzers. Here the measuring part of a complex device is being discussed which embeds a highly accurate electricity meter and network analyzer in the same unit. Analyzer functions are implemented in compliance with the European EN5160 Standard, and they include detection of short- and long-term voltage sags, swells and outages, harmonic analysis of current and voltage signals with calculation of total harmonic distortion (THD) as well as assessment of voltage flicker severity.
Key words: industrial electricity meter, three-phase measurement system, power network analyzer, power quality
Trifazni DSP-merilni sistem za merjenje elektriˇcne energije z
analizatorjem omreˇzja
Povzetek. Clanek se ukvarja s trifaznim precizijskim meril-ˇ nim sistemom elektronskega ˇstevca elektriˇcne energije, razvitim na podlagi signalnega procesorja v povezavi z veˇckanalnim pretvornikom AD. Merilni sistem omogoˇca vse ustaljene ˇstirikvadrantne meritve energij, moˇci, napetosti in tokov, po-leg tega pa opravlja tudi funkcije analizatorja kakovosti dobave elektriˇcne energije. Gre torej za merilni del kombinirane naprave, ki v enem ohiˇsju zdruˇzuje visoko zmogljiv preciz-ijski ˇstevec elektriˇcne energije in analizator omreˇzja. Analiza-torske funkcije so implementirane tako, da ustrezajo merjenju kakovosti dobave elektriˇcne energije po evropskem standardu EN 5160, vkljuˇcujejo pa detekcijo dolgotrajnih in kratkotra-jnih izpadov, upadov in porastov elektriˇcne napetosti, harmon-sko analizo signala ter izraˇcun faktorja harmonskega popaˇcenja (THD) in intenziteto flickerja.
Kljuˇcne besede: industrijski ˇstevec elektriˇcne energije, trifazni merilni sistem, analizator omreˇzja, kakovost dobave elektriˇcne energije
1
Introduction
Induction electricity meters have become completely ob-solete in the area of industrial electrical power measure-ment. Beside the standard features expected to be present in a digital industrial meter, incorporating measurement of the active, reactive and apparent power/energy, high accuracy class (0.2 or better), custom energy registration, programmable tariff switching device and a number of
Received 13 October 2008 Accepted 17 December 2008
communication protocols and media, it has become nec-essary for such a device to perform also power network quality analysis, thus integrating a full power network an-alyzer. Therefore, a highly specialized digital measure-ment system has had to be developed, ensuring the highest possible accuracy rate due to power losses caused by mea-surement inaccuracy on power transmission line which are far from being negligible. Such a system demands in-corporation of the state-of-the-art analog and digital com-ponents as well as reliable and extensible firmware for data processing. As it can be clearly seen, raw data com-ing out of the analog-to-digital converter do not reveal anything about the energy and/or power network quality; thus the key component of such measuring device is im-plemented in software running on a floating-point DSP processor. Network analysis features implemented in this system incorporate evaluations required by the European EN50160 standard, thus including detection of long- and short-term voltage sags, swells and outages, spectral anal-ysis, voltage unbalance factor and flicker severity.
The first chapter deals with the basic measurements. The second, third and fourth chapter address assessment methods for period, true RMS values of the voltage and current, harmonic analysis and flicker severity, respec-tively. The last chapter describes software implementa-tion.
tegral of reactive power, which is essentially the power loss on reactive components connected to the electrical network. When the voltage and current are completely out of phase (phase angle 90◦), there is no active energy
flow into or out of the load; energy is lost within reactive loads. The reactive energy can be expressed as the active one with the voltage and current with a phase shift of 90
◦generated between them; it results in
Er(t) = t Z t−T q(t)dt= t Z t−T ˆ u(t)ˆi(t)dt. (2)
The problem that is to be copped with is harmonic distortion of the voltage and current signals. IEC stan-dards define the reactive energy as such at the fundamen-tal component only; therefore a low-pass filter will have to be introduced at at least one of the values above, since harmonic components are orthogonal to each other which results in a zero scalar product; the power produced by multiplying and averaging two of the harmonics with dif-ferent indices produces the zero power:
Qperiod(t) = 1 τ t Z t−τ um(t)in(t)dt= 0 (3) wherem6=n.
The phase shift between the voltage and current is achieved by a pair of digital filters applied to the voltage and current signals. As it can be clearly seen, a digital integrator with transfer function given as
HDi(z) =A
1 +z−1
1−z−1 (4)
generates a phase shift of exactly 90◦which is precisely
what we want in this situation. But the digital integrat-ing filter also amplifies the DC-component of the signal which would make the filter saturate soon. To eliminate this problem, we have to use a digital filter with a simi-lar phase characteristic but with a limited feedback gain. This is analogue to the 1st order lowpass RC-filter in the continuous-time domain:
HAi(s) =
1
1 +RCs. (5)
which results in the z-domain as
HDd= C(1−z−1) 1−Dz−1 (8) whereC = 2τd 2τd+T,D = 2τd−T
2τd+T. The integrator and
dif-ferentiatior are applied to the voltage and current signals, respectively, in order to produce apparent power with the right sign. If we, for that matter, state
HAd(jω) =jHAi(jω), (9)
this equation yields constants for filters
τi=τd=
1
w. (10)
Filters with this coefficients generate phase offset of pre-cisely 90◦, which is exactly what we are looking for; also,
the integrator acts as a low-pass filter and cuts off har-monic values of the fundamental signal. The magnitude of the resulting signals is also frequency-dependent, thus requiring magnitude compensation; coefficients for mag-nitude compensation are listed in a lookup table with a step of 0.5 Hz; gain constants in between are interpolated using linear interpolation. Information about the signal fundamental, of course, needs to be updated every period.
3
Period and frequency measurement
The fundamental period time is assessed by measuring the time between two adjacent zero-crossings; this is done, in the discrete time domain, by counting samples between the two. This, however, gives a maximum accuracy of
1
T = 0.1ms@10kHz, which is inadequate; the actual
zero-crossing position has to be interpolated. Linear inter-polation is time-efficient and also accurate enough since the first derivative of the harmonic signal is approximately 1 around the first zero-crossing:
sin(ωt)∼ωt, t∼0. (11)
The measuring time between two adjacent zero-crossings looks simple at the first glance; but what if there are harmonics present inside the signal? This could easily lead to situation illustrated on Figure 2.
Figure 1. Period measurement error with use of linear interpo-lation
Figure 2. Signal including false zero-crossings due to harmonic distortion
The image displays a signal containing harmonic val-ues with a magnitude large enough to cause two extra zero-crossings the around zero crossing of a half-period. Two methods are implemented to eliminate this problem:
• setting frequency/period limits - potential zero-crossing is discarded if not within margins, and
• filtering out harmonic values.
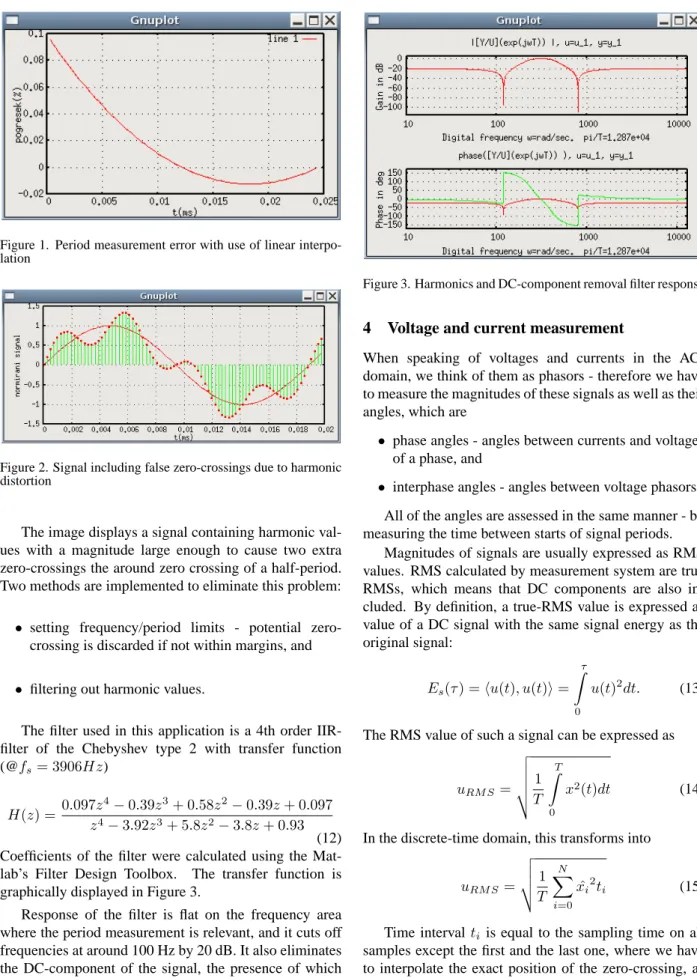
The filter used in this application is a 4th order IIR-filter of the Chebyshev type 2 with transfer function (@fs= 3906Hz) H(z) = 0.097z 4−0 .39z3+ 0 .58z2−0 .39z+ 0.097 z4−3.92z3+ 5.8z2−3.8z+ 0.93 (12) Coefficients of the filter were calculated using the Mat-lab’s Filter Design Toolbox. The transfer function is graphically displayed in Figure 3.
Response of the filter is flat on the frequency area where the period measurement is relevant, and it cuts off frequencies at around 100 Hz by 20 dB. It also eliminates the DC-component of the signal, the presence of which can also cause inaccurate frequency measurement due to the unequal lengths of two half-periods.
Figure 3. Harmonics and DC-component removal filter response
4
Voltage and current measurement
When speaking of voltages and currents in the AC-domain, we think of them as phasors - therefore we have to measure the magnitudes of these signals as well as their angles, which are
• phase angles - angles between currents and voltages of a phase, and
• interphase angles - angles between voltage phasors. All of the angles are assessed in the same manner - by measuring the time between starts of signal periods.
Magnitudes of signals are usually expressed as RMS values. RMS calculated by measurement system are true RMSs, which means that DC components are also in-cluded. By definition, a true-RMS value is expressed as value of a DC signal with the same signal energy as the original signal: Es(τ) =hu(t), u(t)i= τ Z 0 u(t)2 dt. (13)
The RMS value of such a signal can be expressed as
uRM S= v u u u t 1 T T Z 0 x2(t)dt (14)
In the discrete-time domain, this transforms into
uRM S= v u u t1 T N X i=0 ˆ xi2ti (15)
Time intervalti is equal to the sampling time on all
samples except the first and the last one, where we have to interpolate the exact position of the zero-crossing, as already mentioned in the previous subsection. This yields a true RMS value of a signal, which may be refreshed
Harmonic analysis of the voltage signal is also one of those demanded by the EN50160 [1]. The spectral im-age of the signal is revealed using very a conventional method - the discrete Fourier transform, calculated using a FFT algorithm with decimation in time [5]. The basic discrete Fourier transform of a signal is
X[k] = N−1 X n=0 x[n]e−2Nπjkn, n= 0, ..., N−1 (16) Twiddle factors Wkn = e 2πj
N kn are pre-calculated and
stored in flash memory. Furthermore, if we make use of the periodic nature of the DFT:
X[k+N] = N−1 X n=0 x[n]e−2πj(kN+N)n (17) = N−1 X n=0 x[n]e−2πjknN e−2πjn (18) = N−1 X n=0 x[n]e−2πjknN (19) = X[k], (20)
we can capture exactly one period of data, and, accord-ing to the equation above, resample the period to exactly match the number of FFT bins. Figure 4 displays the cap-tured and re-sampled signal.
Figure 4. Original and re-sampled signal before FFT
U[n] =ℜ(X[n+ 1]) +ℜ(X[N−n−1]) + (21)
j(ℑ(X[n+ 1])− ℑ(X[N−n−1])) (22) and
I[n] =ℑ(X[n+ 1]) +ℑ(X[N−n−1]) + (23)
j(ℜ(X[n+ 1])− ℜ(X[N−n−1])) (24)
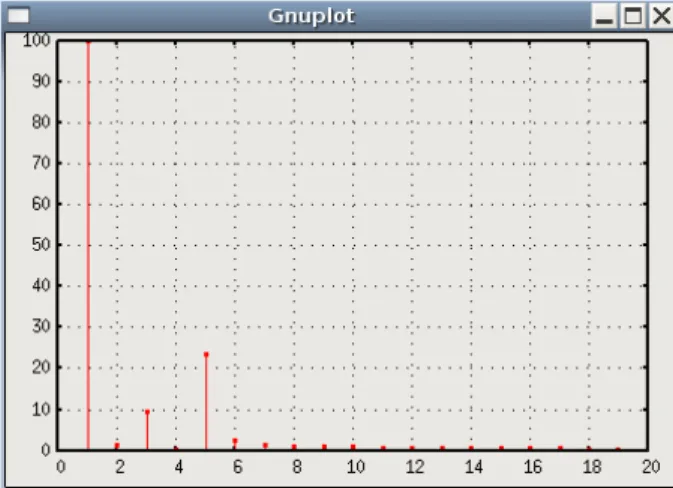
to produce the voltage and current spectrum, respec-tively. Figure 5 displays the spectral image of the signal on figure 4.
Figure 5. Resulting harmonic histogram
6
Flicker severity
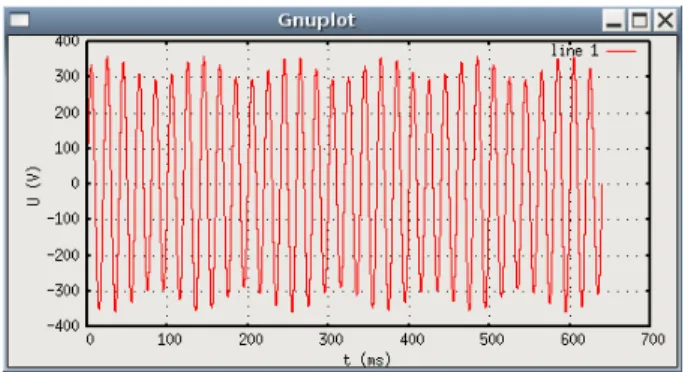
The quantity that requires the special algorithm to be per-formed directly on a stream of samples is flicker sever-ity assessment. Flicker is voltage amplitude fluctuation caused by pulsating loads such as electric welders; it is an issue of psychological effect caused by pulsating lamps and torque fluctuation on electric motors; it is caused by envelope with the frequency from 0.5 Hz to 35 Hz modu-lated on the fundamental network AC signal.Figure 6 dis-plays a fluctuating voltage signal.
The IEC 61000-4-15 [2] standard defines a model for simulation of the lamp-eye-brain chain, used to assess flicker severity coefficient to be passed for further statis-tical analysis [9].
Figure 6. Voltage signal with flicker present
First stage is the squaring demodulator and envelope detector. It separates the flicker signal from its carrier. Second stage incorporates a pair of filters:
• A bandpass filter which stops frequencies below 0.05Hz and above 35 Hz with 3 dB attenuation at both of the stop frequencies; the 6th order Butter-worth IIR filter is used, as suggested in the IEC 61000-4-15 standard and [3].
• A weighting filter which simulates human percep-tion; its characteristic was obtained by tests on a pop-ulation; its transfer function is displayed on figure 7 and it presents a lower margin of perception at 50 % of the population tested.
Third stage is the Rashbass simulation model of brain re-action; it consists of a squaring multiplier and a low-pass filter with a stop frequency at 0.53 Hz.
Figure 7. Weighting filter transfer function
7
Software implementation
All of the algorithms described in the previous chapters are implemented entirely in software. The DSP proces-sor platform chosen for the task consists of the Texas Instruments TMS320C6726 floating-point DSP processor in combination with the Cirrus Logic CS5451A 6-channel AD converter.
All the algorithms are written in floating-point arith-metic and are designed as hardware-independent as pos-sible. The sample rate currently used in this system is 3906 Hz [8], but a higher sampling frequency will be in-troduced with a new AD converter in order to achieve the sample rate of 10 kHz.
The TMS320C6726 processor also includes a built-in ROM library of math routines and lots of DSP algorithms. It also contains hand-optimized implementation of FFT which is widely used in this application [7].
DSP and AD converter communicate using a version of the SPI bus; SPI communication is used to communi-cate with the tariff device as well. A simple protocol is used to receive requests from the tariff device and send back results. All of the results measured are transferred in a decimal fixed-point format in the network byte order, thus enabling embedding the same system into more than one electricity metering device.
Calibration of the system is based on the RMS values of the voltage and current. They are measured in one (or even more) points and passed to the system by SPI; cal-ibration algorithm then calculates coefficients for trans-forming raw input data into floating-point samples.
The current sensors are compensated current trans-formers; but the potential danger of the DC component presence still remains on voltage signals, thus forcing a software offset compensation. This is done by a lossy 1st order integrating filter which averages the signal; the re-sulting signal is then subtracted from the original one.
8
Conclusion
This paper presents a theoretical background of the surements performed by a DSP-based electricity mea-surement system as well as basic concepts of the imple-mentation which is done entirely in software. The system collects samples and returns the measured data which can be registered in a tariff device of a precision electricity meter. All of the algorithms are written as separate soft-ware modules which can be easily replaced, modified or used in another application. Hardware configuration as such can achieve the accuracy class 0.2 for the active en-ergy. Further work will be focused on improving the accu-racy class for the active and reactive energy into 0.1/0.2, which will require a new AD-converter with 24 bits and higher a sample rate; however, the existing algorithms will mostly remain unchanged, but some new algorithmic modules will be added as well, e. g. for assessment of the tone-frequency line communication signals magnitude.
9
References
[1] EN Standard 50150, “Voltage characteristics of electricity supplied by public distribution systems”, European Stan-dard, 1994
[8] Cirrus Logic CS5451A Datasheet, 2008
[9] Emmanuel De Jaeger, “Measurement and Evaluation of the Flicker Emission Level From A Particular Fluctuating Load”, Laborelec, 2000
Rok Marolt received his B.Sc. and M.Sc. degrees in electrical engineering from the University of Ljubljana in 2005 and 2008, respectively. He is currently employed with the Iskraemeco’s Research and Development Dept., Kranj.
Andrej ˇZemva received his B.Sc., M.Sc. and Ph.D. degrees in electrical engineering from the University of Ljubljana in 1989, 1993 and 1996, respectively. He is Associate Professor at the Faculty of Electrical Engineering. His current research inter-ests include logic synthesis and optimization, test generation and hardware-software codesign.