by Mei Lin Chen
A thesis
presented to the University of Waterloo in fulfillment of the
thesis requirement for the degree of Master of Applied Science
in
Systems Design Engineering
Waterloo, Ontario, Canada, 2018 © Mei Lin Chen 2018
Author’s Declaration
This thesis consists of material all of which I authored or co-authored: see Statement of Contributions included in the thesis. This is a true copy of the thesis, including any required final revisions, as accepted by my examiners.
Statement of Contributions
Publication and presentation that resulted from the work presented in this thesis:
1. Mei Lin Chen, Dannie Fu, Jennifer Boger, and Ning Jiang, “Age-related Changes in Vibro-tactile EEG Response and its Implications in BCI Applications: A Comparison Between Older and Younger Populations”, submitted to IEEE Transactions on Biomedical Engineering, Feb. 2018.
2. Mei Lin Chen, Dannie Fu, Jennifer Boger, and Ning Jiang, “Aging Effects on the Performance of a Brain-computer Interface”, submitted to the 2018 ACCES23-CMBEC41 Joint Conference, Charlottetown PEI, May 2018.
Contributions for the above publications: ML carried out the experiments, analyzed the data, and wrote/edited the manuscripts. DF assisted in the experiment data collection. JB and NJ edited the manuscripts and provided directional guidance for this research.
Abstract
There is a rapid increase in the number of older adults around the world. This directly translates to an increase in the number of people living with health complications that are more prevalent in the elderly population, such as post-stroke conditions. Current rehabilitation techniques for stroke and other disorders are limited in effectiveness, which calls for the development of new approaches such as brain-computer interface (BCI) applications in neurorehabilitation.
The majority of BCI applications are based on electroencephalogram (EEG) and other physiological signals to detect user intention and provide feedback. However, many of the signal processing algorithms currently used have been developed on data from a much younger population. There is a need to investigate how age-related changes directly affect EEG signals and extend to BCI control, specifically for older adults.
In this thesis research, EEG response to vibro-tactile stimulation from 11 younger adults (21.7±2.76 years old) and 11 older adults (72.0±8.07 years old) were investigated. The results showed that, firstly, the spatial pattern of the cortical activation in older subjects was significantly different from that in younger adults (older adults had a reduced lateralization in activation); and secondly, there is a general overall power reduction in the EEG from older adults compared to younger adults. This suggests that the approach for designing BCI applications for older adults must be fundamentally differently than that for younger adults. This need is further shown in the average BCI performance accuracy classifying left vs. right was 64.5±7.75% for the older adults, which was more than 20% lower and statistically different (t(20)= -4.3, p <0.001) than that in the younger subjects,
which was 85.3±14.1%. Compared to current works in the field, this research is unique in its examination of age-related differences in EEG signals and is the only work we are aware of that examines the age-related differences in EEG response to vibro-tactile stimulation. This finding should be further investigated with other BCI paradigms such as motor imagery in order to confirm the impact of age on BCI control. Further, provided that this age-related difference persists across different modalities, it is then necessary to fine-tune the algorithmic approaches to fit the intended application to the target population.
Acknowledgments
I would like to thank my supervisors Professor Ning Jiang and Professor Jennifer Boger for their guidance and support throughout this research. I would also like to thank my thesis readers Professor John Zelek and Professor James Tung for their valuable input. Special thanks to the participants for dedicating their time towards this research experiment
.
Research presented in the following thesis is supported by the University of Waterloo’s Starter Grant (No. 203859).Dedication
This thesis is dedicated to all those who supported me through the process of completing my Master’s degree.
Table of Contents
Author’s Declaration ... ii
Statement of Contributions ... iii
Abstract ... iv
Acknowledgments... vi
Dedication... vii
List of Figures ... xi
List of Acronyms ... xii
Chapter 1. Introduction ... 1
1.1 Global aging population and stroke ... 1
1.1.1 What is stroke? ... 1
1.1.2 Rehabilitation ... 2
1.2 Brain-computer Interface ... 2
1.3 Physiology of Aging ... 4
1.4 Aging and BCI ... 4
1.5 Scope ... 5
1.6 Outline ... 6
Chapter 2. Literature Review... 7
2.1 What is a Brain-computer Interface? ... 7
2.2 What does a BCI consist of? ... 8
2.2.2 Component 2: Feature extraction/ signal processing ... 12
2.2.3 Component 3: Signal translation ... 14
2.2.4 Component 4: Device output/ feedback ... 15
2.3 BCI uses and users ... 16
Chapter 3. Age-related Differences in Somatosensory EEG response to Vibro-tactile stimulation ... 19
3.1 Methods ... 19
3.1.1 Participants ... 19
3.1.2 EEG recording & mechanical somatosensory stimulation 19 3.1.3 Experiment setup & paradigm ... 21
3.1.4 Data preprocessing & signal decomposition ... 24
3.1.5 Event-related spectral perturbations (ERSP) ... 25
3.1.6 Event-related desynchronization/ synchronization ... 26
3.1.7 BCI Offline Classification ... 27
3.1.8 Statistics ... 28
3.2 Results ... 28
3.2.1 Participants ... 28
3.2.1 Event-related Spectral Perturbation ... 29
3.2.2 Event-related desynchronization/ synchronization ... 31
3.2.3 BCI Classification Accuracy ... 33
Chapter 4. Discussion... 35
4.1 Confounding factors and limitations ... 39
References ... 43
Appendix ... 49
Appendix A: Telephone Recruitment Script... 49
Appendix B: 32-channel setup ext. 10-20 system ... 51
Appendix C: Device Standard Operating Procedures ... 52
List of Figures
Figure 1. g.Nautilus 32-channel EEG cap ... 20
Figure 2. Wrist bands with vibration stimulation device built ... 21
Figure 3. Experiment setup... 22
Figure 4. Experimental protocol for a single run. ... 23
Figure 5. The participant interface during the experiment ... 24
Figure 6. Average ERSP for all younger and older adults before and during vibro-tactile stimulation, for channels C3 and C4. ... 30
Figure 7. Bilateral vibrotactile stimulation ERD/ERS topoplot averaged over 0.4 to -0.1s in response to the 200ms bilateral stimulation at -1s. ... 31
Figure 8. Comparison of average ERD/ERS of younger and older participants ... 32
List of Acronyms
ALS Amyotrophic Lateral Sclerosis. BCI Brain-computer Interface. BMI Brain-machine Interface. CSP Common Spatial Pattern. ECoG Electrocorticography. EEG Electroencephalogram.
ERD Event Related Desynchronization. ERP Event Related Potential
ERS Event Related Synchronization. ERSP Event-related Spectral Perturbation fNIR Functional Near-Infrared Spectroscopy. LDA Linear Discriminant Analysis.
MEG Magnetoencephalography. MRI Magnetic Resonance Imaging. PET Positron Emission Tomography. SCP Slow Cortical Potential.
SMR Sensory Motor Rhythm.
SSVEP Steady-State Visual Evoked Potential. SVM Support Vector Machine
Chapter 1.
Introduction
1.1 Global aging population and stroke
In 2017, the global population of individuals aged 60 years and older totaled 962 million – this number was more than twice as that in 1980, when it was 382 million [1]. The World Health Organization estimates this number to reach nearly 2.1 billion by 2050 – more than double that today [1], [2]. With increasing age comes an increase in the burdens of chronic and noncommunicable disease. Ischemic heart disease and stroke are the two leading causes of mortality and disease burden in those aged 60 and older [3]. This imposes a significant impending burden on global health and is one of the leading causes of mortality and serious long-term disability [4], [5]. In the United States, stroke costs the national healthcare system 23.2 billion dollars annually [6]. Globally in 2013, there were 6.5 million deaths from stroke, making it the second-leading cause of death behind ischemic heart disease [4].
1.1.1 What is stroke?
Our brains require a constant blood flow to deliver oxygen and nutrients as well as remove cellular metabolic waste [6]. Stroke occurs when there is a severe or complete lack of blood flow to the brain as a result of any cerebrovascular disease or neurological injury.
deprived of oxygen, hence causing a cascade of mechanisms that lead to brain tissue ischemia and ultimately infarction [6], [7]. There are two main types of strokes, ischemic stroke and hemorrhagic stroke. Ischemic stroke accounts for the majority (87%) of strokes, and is caused by the obstruction or clogging of major arteries in the cerebral circulation, limiting the oxygen-rich blood from flowing to certain brain areas. Hemorrhagic stroke, accounting for the rest of strokes, occurs as a result of rupture of vascular lesions within the cerebrovasculature [6] – this can occur in the intracerebral or subarachnoid space [7].
1.1.2 Rehabilitation
The problem with current rehabilitation strategies is that the majority (80%) of stroke survivors are left with residual deficits in fine motor upper limb control [8]. In addition, after the first 3 months post-stroke, further recovery is often slow or non-existent [9]. Current physical training techniques, such as constraint-induced movement therapy (CIMT) or bilateral arm training, have been shown to be useful in helping to improve motor functioning in chronic stroke patients [9]. However, the challenge is that these options are not applicable for patients with severe limb weakness because residual movements are required for therapeutic feedback [10], [11]. New approaches are needed to provide more effective and targeted post-stroke rehabilitation, and this is an area where brain-computer interfaces can be useful.
1.2 Brain-computer Interface
Over the past twenty years, neural engineering has emerged as a new field in neuroscience and engineering to link brain activity with external devices [12]. This technology is called brain-computer interface (BCI), and can provide a new output channel
of communication for users, without the reliance on neuromuscular pathways [13]. It records brain waves and sends them to the computational system to complete the intended task. This builds a bridge of bi-directional communication between the human brain and the external world.
BCI demonstrate promising potential as a novel approach for neurorehabilitation, as it works by either substituting for the loss of normal neuromuscular output or inducing activity-dependent brain-plasticity to restore normal brain function, both of which have been shown to support recovery [9], [14]–[17]. BCIs can be used regardless of the severity of the post-stroke paresis as it is dependent upon brain activity alone [18]. Much of the research in the field of non-invasive BCI stroke rehabilitation training leverage the brain’s EEG changes in Sensory-Motor Rhythms (SMR) [15], [19]. SMR refers to the oscillatory activity observed in the somatosensory and motor areas of the brain when activated. Upon stimulation, specific body parts causes a decrease in SMR activity in the respective sensorimotor cortex brain area, called the event-related desynchronization (ERD) [20]. SMR has been deemed a good fit for stroke rehabilitation because of its close relation to motor activity, it is easily accessible by EEG, and that it has a higher signal-to-noise ratio [15], [21]. However, research to date has shown limited effectiveness when BCI-based rehabilitation systems are put into practice [15]. Potential reasons for this lack in effectiveness of BCI-based rehabilitation may include changes in the brain induced by stroke, or other neurological conditions, altering and functions. Additionally, normal aging and the impacts that it has on the brain may also play a significant role in contributing to this challenge. Hence, if we are to create more effective BCI applications for older adults,
such as BCI-based stroke rehabilitation systems, it is critical that we grasp an understanding of how aging impacts neuroelectrophysiology.
1.3 Physiology of Aging
Healthy aging is often accompanied by changes in the brain that include declines in processing speed, working memory, long-term memory, inhibitory functions, brain structural size, and white matter integrity [22]. The impacts of aging include a complex interaction of genetics, biology, and environmental factors [23]. PET and fMRI studies report that compared to younger adults, older adults show a recruitment of brain regions with reduced lateralization [24], displaying a relative overactivation of additional brain regions that are not activated by younger adults when performing the same tasks [25]. Often, this additional activated region is the same site that is activated in younger adults but in the opposite hemisphere [26]. This pattern of increased symmetry of activation in older adults has been referred to as Hemispheric Asymmetry Reduction in Older Adults (HAROLD) [26]. More generally, this age-related overactivation is thought of as a compensatory mechanism, and has been termed the compensation-related utilization of neural circuits hypothesis (CRUNCH) [25]. These terms and its implications will be further explained in Chapter 2.
1.4 Aging and BCI
The average age of the stroke population in BCI stroke rehabilitation clinical studies is over 55 years of age [15]. Meanwhile, the fundamental algorithms on which BCI
stroke rehabilitation methodologies are based on, that leverage SMR, have been developed on younger adults and have not been validated on an older population [12], [21], [27]. Theoretically, in order to create an optimal product the target end-users, it is critical to develop, test, and validate the solutions with representatives from the population of interest; in this case, developing BCI classifiers with older adults. Hence, the fact that the algorithm design was created with populations of a distinctly different age group compared to the target user population raises a fundamental concern that should be addressed.
As aforementioned, there exists a change in the location of brain activation to be more bilateral throughout the aging process. As SMR and popular signal processing/enhancing methods are based on spatial information (i.e. the use of common spatial pattern and Laplacian filtering) [28], it raises the concern of whether this difference can challenge one of the prominent algorithms that stroke rehabilitation methodologies are based on.
As haptic vibro-tactile stimulation on the wrist provides a consistent activation of the somatosensory motor cortex and is also used in rehabilitation, we chose to use this method for investigating the age-related differences in brain response. Other more popular BCI paradigms such as motor imagery [29] which are more dependent on subjective interpretation are the next step of investigation for this research. This thesis focuses on investigating the impact of aging on SMR, specifically in the brain’s response to vibro-tactile stimulation on the left and right wrist, and the potential larger impacts of this on BCI classification and neurorehabilitation.
This research aims to answer the following research questions:
1) What are the effects of aging on somatosensory-response in EEG signals with respect to the C3 and C4 channels?
2) How does the above effects translate to a difference in BCI control in terms of BCI classification accuracy?
By specifically analyzing the effects of aging on somatosensory-response in EEG and how this translates to a difference in BCI control, we can obtain a greater understanding on how aging may impact the use of a BCI system. The findings of this study holds critical implications for future designs of BCI applications specifically for an older population.
1.6 Outline
This thesis begins with Chapter 2, which surveys the peer-reviewed literature explaining the fundaments of BCI, its common applications, and relation to rehabilitation and age-related EEG changes. This will set the context of this thesis research comparing age-related differences in somatosensory response to vibro-tactile stimulation. Chapter 3 outlines the methods used for thesis-related experimentation while Chapter 4 presents the results. Chapter 5 discusses the research findings and future insights. Chapter 6 contains the key take-away messages and their relevance to the field.
Chapter 2.
Literature Review
2.1 What is a Brain-computer Interface?
Brain-computer Interfaces (BCIs), also called Brain-Machine Interfaces (BMIs), are systems that are able to detect, analyze and decode recorded brain signal activities to control an external device to carry out desired actions [18], [30], [31]. BCIs offer an alternative to natural communication and control by bypassing the body’s normal physical efferent output channels. The system translates signals directly from the brain and not the peripheral system, hence requiring the cooperation and adaptation of the user to the BCI system, and the system to be trained with the user’s signals [11], [30]. With each decoded output, the user can receive feedback on this output, which in turn affects their subsequent brain signal outputs [14]. This bi-directional relationship between the user and the system is used to individually tailor the control system and provides the basis for neurorehabilitation.
The BCI system is often misconceived to be a “mind-reading system”, however, simply passively reading brain signals with an electroencephalography EEG does not constitute a BCI; the user must generate brain signals that encode intentions, the system must then be trained on this signal and to be able to classify subsequent signals for the desired output [18].
2.2 What does a BCI consist of?
A typical BCI system consists of four sequential components: 1) signal acquisition, 2) feature extraction, 3) feature translation, and 4) device output/ feedback [18].
2.2.1 Component 1: Signal acquisition
There are a number of ways to measure electrophysiological brain activity: electroencephalography (EEG), electrocorticography (ECoG), magnetoencephalography (MEG), and electrical signal acquisition in single neurons [32] are just some examples. Other physiological measures include retrieving the hemodynamic response of activated neurons’ response to glucose, using means such as functional magnetic resonance (fMRI), positron emission tomography (PET), and functional near-infrared spectroscopy (fNIR) [32]. Currently, fMRIs and PETs are impractical for mass adoption due to their size and cost – EEGs are much more commonly used for its accessibility and ease of use.
The most common signal used by BCIs is the electrical signals produced mainly by neuronal postsynaptic membrane polarity changes due to the activation of voltage gated-or ion-gated channels [18]. There are a variety of ways in which this signal can be acquired, and they can be categorized as non-invasive or invasive. Non-invasively, the electrodes are placed on the scalp (i.e. EEG); invasively, intracranial electrodes are inserted at the cortical surface subdural or epidural (i.e. ECoG), or within the brain (via single unit spikes and local intracortical field potentials) [14].
Comparing invasive and non-invasive signal acquisition methods
Each method, invasive or non-invasive, holds unique advantages and disadvantages, and is useful for different applications and/or different users. Non-invasive
technology accessible to a larger population [33]. This method has also been highly researched for applications in neuroscience, engineering, and signal processing due to the advancement of this type of BCI systems’ usability, information transfer, and robustness of modern machine learning and signal processing techniques [34]. However, non-invasive EEG recordings are limited by a reduced topographical spatial resolution and frequency range. In addition, since it is recorded on the scalp, they are extremely susceptible to artifact contamination from electro-oculographic (eye movements) or electromyographic (muscle contractions), as well as other noise contaminants [14], [33]. Invasive methods such as ECoG and intracortical methods have better topographical resolutions and wider frequency ranges, but the surgical implantation of electrode arrays on the cortical surface or within the brain is required [14].
The main differences between invasive and non-invasive signals are: 1) the number and type of neurons that the signal is obtained from, 2) the frequency of signals acquired, and 3) the spatial distortion. Firstly, the number of neurons that non-invasive methods read signals from will be much larger than invasive methods such as ECoG. This means that for non-invasive methods, the signals are not as spatially targeted, and may be subjected to contamination from near-by neurons. Secondly, the human body tissue acts as a low-pass filter, attenuating high-frequency signals. This means non-invasive measure can only analyze low-frequency neuronal activities (lower than ~90Hz, and even lower for dry EEG electrodes) [35]. On the other hand, invasive signals can preserve signal frequency up to several kHz. Third, the spatial distortion of the extracellular space is composed of media of different electrophysiological properties which influence how the fields spread before being detected. The field further spreads in the cerebrospinal fluid, skull, and scalp, causing
spatial distortion before being detected by EEG electrodes. The frequency-dependent phase shifts might be stronger when signals spread across larger distances (such as in EEG) and might disintegrate temporal consistency across signal components [35]. In this thesis work, we chose to use non-invasive EEG recording for its cost, practicality, and its higher likelihood of adoption for masses in real-world scenarios.
EEG-based BCIs
An EEG-based BCI system typically consists of electrodes, amplifiers, A/D converter, and a recording device [32]. The electrodes detect the signal from the scalp, the amplifier processes the analog signal, enlarging the amplitudes of the EEG signals, and the A/D converter digitizes the signals. Subsequently, the recording device stores, processes, and displays the data according to the BCI system’s intended purposes [32].
EEG signals are measured as potential differences over time between the signals detected by the active electrodes and the reference electrode; the ground electrode measures the differential voltage between the active and reference points. These EEG electrodes are typically made of silver chloride (AgCl) disks that are 1 to 3 mm in diameter [36]. Their placements are placed according to the 10-20 international system, based on external cranial landmarks, assuming the underlying cranial structures correlate with the outer scalp locations [37]. The digitized signals are subjected to one or more of a variety of feature extraction procedures, such as spatial filtering, voltage amplitude measurements, spectral analyses, or single-neuron separation [30]. BCIs can use signal features that are in the time domain (e.g. evoked potential amplitudes or neuronal firing rates) or the frequency domain (e.g. mu or beta-rhythm amplitudes) [30].
In order to record accurate signals, the electrode-scalp contact impedance should typically be between 1kΩ and 10 kΩ. This impedance can depend on several factors including the interface layer, electrode surface area, and temperature [32]. The user of EEG gel can reduce the impedance between the scalp and electrodes, but it is also extremely cumbersome for the user as it requires extensive clean up. One of the challenges of using BCI is the effect of non-CNS artifacts. It is possible for a BCI to ensure that the features chosen are not contaminated by EMG, electrooculography (EOG), or other non-CNS artifacts [30]. Muscle activation and eye movement and contribute to the electrical activity recorded from the scalp, due to the dipoles they generate [32]. The following subsection will address the methods that can be used to overcome some of these challenges.
There are also multiple types of signals that can be used to control a BCI. In current BCI systems, signals used include: visual evoked potentials (VEPs), P300 evoked potential, slow cortical potential (SCP), and sensorimotor rhythms (SMR) [32], [38], and selective sensation (SS) [39]. VEPs are brain activity modulations that occur in the visual cortex after receiving a visual stimulus, it increases as the stimulus is moved closer to the central visual field [32]. P300 evoked potentials are positive peaks due to infrequent auditory, visual, or somatosensory stimuli. The P300 response is elicited around 300ms after an oddball stimulus, among frequent stimuli. The less probably the stimulus, the larger the amplitude of the response peak [30], [32]. The P300 response is not drastically affected by whether or not the subject is gazing at the target, whereas the VEP is strongly dependent on gaze direction. SCPs are slow voltage shifts in the EEG that lasts a second to several seconds; negative SCPs are correlated with increase neuronal activity while positive SCPs coincide with decreased activity [32]. Lastly, SMR is comprised of mu/ Rolandic band (7–
13 Hz) and beta (13–30 Hz) rhythms. The amplitude of SMR varies with the actual or imagined movement, which people can learn to generate and modulate at will to control a BCI [32]. The SMR is the signal that we chose to further investigate in this experiment, as it is closely related to the goal to recover physical functional movements in stroke rehabilitation and other neurological disorders. Within SMR, there are two kinds of amplitudes: event-related desynchronization (ERD) and event-related synchronization (ERS). ERD indicates a power decrease, which occurs when the respective brain region is activated by real or imagination of movement, and ERS shows power increase, occurring when not activated [40]. Both are slow to onset and also requires a refractory period to return to baseline [41]. This was a key consideration for the design of this experiment protocol; a rest period was allocated to allow for the SMR to return to baseline after each stimulation task to ensure that each trial is independent and unaffected by the refractory period of the trial immediately prior.
2.2.2 Component 2: Feature extraction/ signal processing
The user’s intentions are encoded as signals and later decoded to determine the intended output. Between the input and output process is the extraction of features and measuring of the signals’ characteristics to determine the output results. There are a variety of features that have been used to control a BCI. These include EEG amplitude (of evoked potentials (e.g., P300) or particular rhythms (e.g. sensorimotor rhythms) [14]), band power, power spectral density values, autoregressive and adaptive autoregressive parameters, time-frequency features, and inverse model-based features [42]. Multichannel EEG recordings provide a blurry image of brain activity, hence spatial filters are extremely useful in single-trial analysis to improve the signal-to-noise ratio. [34]
One of the more popular feature extraction algorithms for BCI is Common Spatial Patterns (CSP) [34]. CSP works by decomposing and extracting raw spatial pattern features from EEG signals from two population, or classes, of single trials. It learns the spatial filters to maximize the discriminability of two classes, followed by using a classifier to identify the user’s intention from these features [43]. These patterns help to maximize the difference between the classes, and it was used in EEG to detect abnormalities, and later used to discriminate movement-related patterns [44]. This method has been proven to be very effective in BCI competitions [45], but despite its known efficacy and widespread popularity, CSP is known to be very sensitive to noise and is prone to overfitting [43]. As well, the intrinsic limitation of the CSP method is that it is only possible to discriminate between two classes [46]. In this study, the two classes are right and left wrist vibro-tactile stimulation. We used CSP to help enhance the spatial activation features in the EEG response, however as we will later discuss, this may not be the most optimal method especially for older adults.
Event-related desynchronization/ synchronization (ERD/ERS)
One of the basic features of SMR’s ERD/ERS measurement is the EEG power within identified frequency bands, displayed relative (as a percentage) to the power of the same EEG derivation recorded during the reference (or baseline) period a few seconds before the event occurs [21], [41]. SMR decreases its amplitude (SMR desynchronization) during processing of motor information (ERD) and increases in amplitude when inactivated (ERS) [41].
The standard method to compute the time course of ERD includes the following [41]:
1. Bandpass filtering all event-related trials;
2. Squaring of the amplitude samples to obtain power samples; 3. Averaging of power samples across all trials;
4. Average overtime samples to smooth the data and reduce variability.
2.2.3 Component 3: Signal translation
The translation of detected signal features into device commands are typically achieved using an algorithm that automatically estimate the class of data as represented by a feature vector [42]. This is a pattern recognition system that typically involves two phases: the calibration and the feedback phase. During the calibration phase, EEG data is collected to train a classifier, while during the feedback phase, the user inputs neural signals from their brain into the system to control applications [34]. There are multiple categories of classification algorithms, including: linear classifiers, neural networks, nonlinear Bayesian classifiers, nearest neighbour classifiers and a combination of multiple classifiers [14], [42]. The most popular algorithm for BCI applications are linear classifiers, due to the limited sample size which accompanies most BCI experiments – this is also the method used to classify the two classes in this study. We used the Linear Discriminant Analysis (LDA) to classify left hand stimulation versus right hand stimulation. This method was chosen due to the limited amount of data to train on. LDA is a very commonly used in BCI applications; it assumes normal distribution of the data, with equal covariance matrix for both classes [42]. LDA has been successfully used in a large number of BCI systems such as motor imagery based BCI, P300 speller, multiclass, and asynchronous BCI [42]. The main limitation of LDA is its linearity that it will have poor performance on complex, nonlinear EEG data.
2.2.4 Component 4: Device output/ feedback
Finally, the BCI system will output the user’s selections through commands to operate an external device, providing functions such as letter selection, cursor control, robotic arm operation, and more [18]. The device provides feedback to the user, closing the control loop, and leveraging the brain’s natural ability to change itself (neural plasticity) to achieve better control of the system and to attain the desired neurorehabilitation outcomes [14].
Neural plasticity is the ability of our nervous system to reorganize its structure, function, and connection in response to training [11]. Plasticity in neurons and synapses of the CNS provides for the learning of new information and acquisition of new skills [14]. The use of BCI is in itself a skill, as changes in the brain’s electrophysiological signals are reflections of central nervous system (CNS) activity into the intended products of that activity: messages and commands that act on the world [30]. BCIs also depend on feedback and on adapting the brain’s activity based on that feedback. This bi-directional adaptive process is a critical component of how people learn to use a BCI system.
BCI is a bi-adaptive process where people learn to use a sensorimotor rhythm-based BCI system begin by using various kinds of motor imagery to modify rhythm amplitudes [14]. Over time, the training allows the user to control the BCI system through the familiarity of control modalities as well as acquiring skills that both the user and the system learn and maintain [14].
By extension, the algorithm that is used to decode intentions should accommodate for human factors such as diurnal change or fatigue. Adapting to the user’s individualized states and needs is a key aspect as users are also learning to modulate their own brainwaves
voluntarily through appropriate feedbacks (i.e. visual, tactile) [33]. This revisits the issue that the factor of age and its impacts are often overlooked in BCI literature. As aforementioned, aging can significantly affects the spatial features in cerebral activation. Since commonly used BCI feature enhancement methods are relying on this exact aspect of spatial activation differentiation, it is critical that this aspect is taken into consideration when designing the underlying algorithm. This is especially important when the target user population for the BCI application is of an older age group, such as for stroke rehabilitation. Stroke may impact an individual’s EEG response in multiple ways, through multiple avenues of changes to the person’s physical and emotional health and abilities. Stroke affects the body’s functioning and structure, limits one’s functional activities, and restricts one’s participation in their self-care [9]. All these factors are simultaneously influenced by environmental and personal factors bi-directionally, which plays into the equation of stroke’s ultimate effect on EEG – this can be variable for each individual [9]. We will further discuss the aspects of rehabilitation and user groups in the following section.
2.3 BCI uses and users
BCI can be especially useful for those with severe neuromuscular disorders that disrupt the neuromuscular channels through which the brain communicates with and controls its external environment [30]. Examples of such conditions that impair the neural pathway or the muscles themselves include late stage amyotrophic lateral sclerosis (ALS), lock-in syndrome, brainstem stroke, brain or spinal cord injury, cerebral palsy, muscular dystrophies, multiple sclerosis [30]. These conditions impair the neural pathways that control or impair the muscles, and affect nearly two million people in the United States
alone, and far more around the world [30]. Those most severely affected may lose all voluntary muscle control, including eye movement and respiration, and may be completely locked in to their physical body, unable to communicate [30]. While people who have these conditions are unable to produce voluntary muscle movements, their sensory and cognitive functions are typically only minimally affected by the disease. Hence, an alternative avenue for communication is to potentially use electroencephalograph (EEG) signals to control an assistive device that helps people restore daily functioning. The goal is to enable people to operate devices with reliable, consistent control, to communicate and interact with their environment, ultimately improving the quality of their lives. This can be accomplished by the user indicating their intentions through a speller system, robotic device control, or predetermined choice selections (i.e. the selection of letters on a screen or controlling a wheelchair) [14], [32], [47]. In 1991, Wolpaw et al. demonstrated that it is possible to control a cursor on a computer screen by modulating the sensorimotor rhythm amplitude, without actual movement execution or sensations [11], [48].
Fundamentally, there are multiple ways in which this is achieved. The BCI can increase the capacities of remaining pathways; restore functions by detouring the neuronal pathway breaks that control muscle movement; provide the brain with new, non-muscular communication and control channels; and/or decipher the individual’s thoughts, or intent, by solely relying on the detected brain activity [30].
In terms of rehabilitation, BCIs hold the potential to restore the user’s innate motor functioning by inducing and guiding activity-dependent brain plasticity, and restoring typical brain functions by affecting motor learning [14]. This neurorehabilitation effect is based on neural plasticity, the ability of our nervous system to reorganize its structure,
function and connections in response to repetitive training [11]. It is influenced by environmental factors, the user’s motivation and attention, as well as timing [11]. By providing feedback on intended movements, it is possible to restore the “action-perception coupling” and induce neural plasticity [11]. The goal of neurorehabilitation is to improve behavior by inducing adaptive changes in dysfunctional neural system while also avoiding maladaptive plasticity, through carefully designed exercises combined with neurofeedback [11]. Similarly, the process of learning to operate BCI systems depend on the existence of neural plasticity, and is thought to follow a similar learning process [14]. The user pays close attention to a motor task by activating or deactivating specific brain signals, achieving control of the system whilst adjusting their own method of BCI control at the same time [14]. In 2013, Ramos-Murguialday et al. showed that post-stroke participants could learn how to control their sensorimotor rhythm desynchronization, especially when contingent feedback was provided [10]. The feedback in this study, for the experiment group, was the concurrent movement of an orthosis attached to the paralyzed limb; the control group patients’ movement of the orthosis occurred randomly, unrelated to SMR control [10]. This suggests that our brain can learn to change, and serves as the fundamental basis for neurorehabilitation such as stroke [40]. This also revisits the hinging question of whether age makes a difference in BCI applications. If stroke is more prevalent in an older population, and if aging changes the brain’s expression of topological signals, it is logical that the algorithm should be designed specifically to this change. Currently, the algorithm is developed on younger populations, which is problematic in that we may not be creating appropriate technology that matches the abilities of the people they are intended to support.
Chapter 3.
Age-related Differences in Somatosensory
EEG response to Vibro-tactile stimulation
3.1 Methods
We examined the EEG response of 11 older adults and 11 younger adults with respect to vibro-tactile stimulation on either the left or right wrist. Each stimulation trial lasts 5 seconds, in total 80 trials (40 left, 40 right) were delivered to each wrist in random order. We aim to analyze the age-related differences in the cerebral response to this stimulation.
3.1.1 Participants
Older adult participants were recruited from the Waterloo Research in Aging Participant Pool (WRAP). A phone script was followed to recruit the participants (see Appendix A). The younger participants were recruited from the surrounding community via physical advertising posters. A total of 11 older adults and 11 younger adults were recruited to participate in this study. The inclusion criteria was age above 18, and the exclusion criteria was any known neurological disorders. This study was approved by the Office of Research Ethics of University of Waterloo, Waterloo, Canada (ORE# 21401).
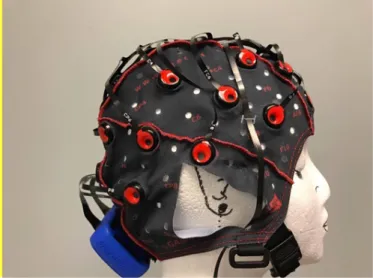
3.1.2 EEG recording & mechanical somatosensory stimulation
EEG signals were recorded using a 32-channel wireless g.Nautilus EEG system (g.tec, Austria), see Figure 1 for the EEG cap.
Figure 1. g.Nautilus 32-channel EEG cap
Electrodes were placed according to the extended International 10–20 system, which has been standardized by the American Electroencephalographic Society (see Appendix B for the layout of the 32-channel setup of the 10-20 system) [32]. The reference electrode was located on the right earlobe, and the ground electrode was located on the forehead. A hardware notch filter at 60 Hz was used, and signals were digitally sampled at 250Hz.
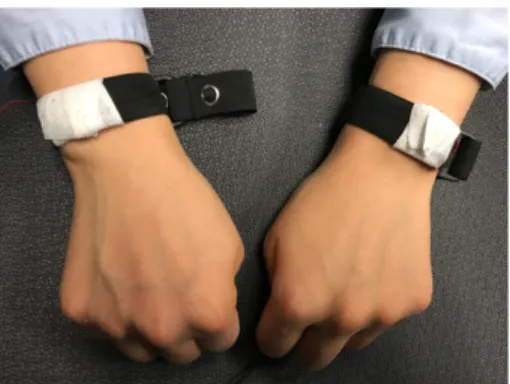
Mechanical vibration stimulation was applied to the dorsal side of left and right wrists using wrist bands with linear resonance actuators (type C10-100, Precision Microdrivers Ltd.) sewn inside. See Figure 2 for the wristband.
Figure 2. Wrist bands with vibration stimulation device built
The two vibration stimulators were connected to and driven by a Sound Blaster E5, a high-resolution USB DAC Amplifier (Creative Inc.). The vibration magnitude was adjusted for each subject between the range of maximum amplitude and half maximum amplitude at the resonant frequency. The optimal amplitude was adjusted based on feedback from the subjects, such that they could comfortably and clearly feel the vibration above their perceptual threshold. The device standard operating procedure is outlined in Appendix C.
3.1.3 Experiment setup & paradigm
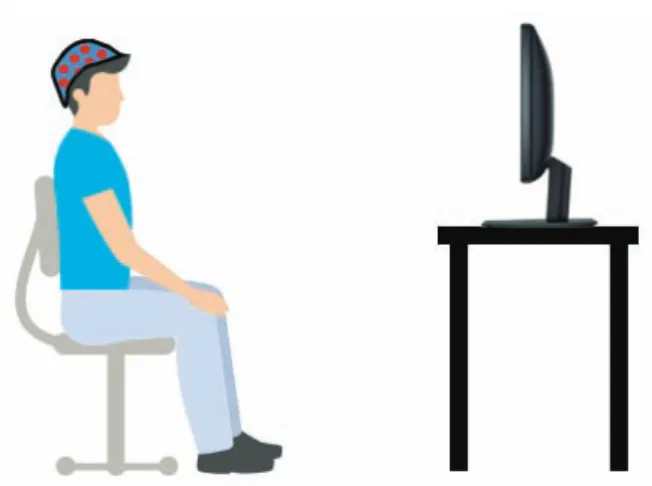
EEG signals were recorded from the subjects before, during, and after stimulation. The subjects were seated in an armchair with their forearms and hands relaxed on the armrest. They faced a computer monitor placed approximately 2m away at eye level (see Figure 3).
Figure 3. Experiment setup
Prior to EEG recording, subjects were shown their EEG in real time on the computer screen to demonstrate how to avoid motor artifacts caused by eye blinks, jaw clenching, and body movements. Subjects were asked to limit these physical movements during the EEG recording.
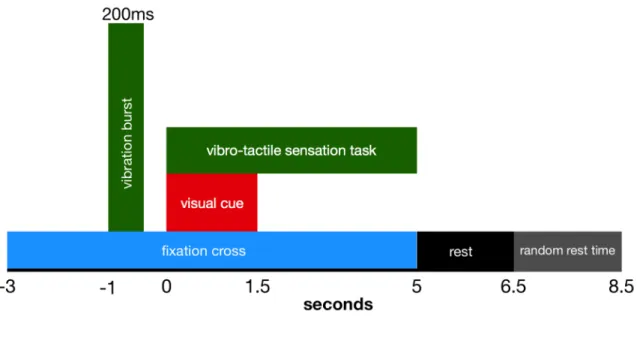
The experimental session consisted of two runs of continuous EEG recording. In each run, the subject performed 40 trials for a total of 80 trials. In each trial, subjects were visually prompted to perceive the feelings on their left or right wrist while a simultaneous vibration was applied to the respective wrist. The sequence of events in each trial is illustrated in Figure 4 and described in detail below.
Figure 4. Experimental protocol for a single run.
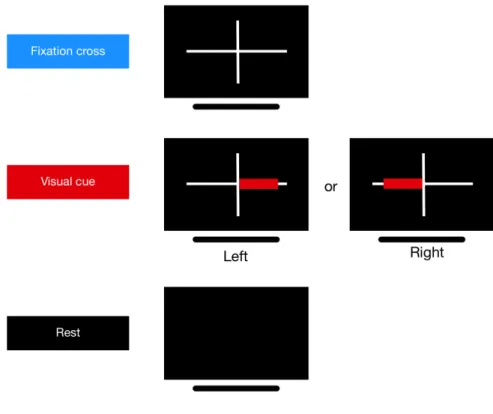
At -3s (the start of each trial), a white fixation cross (“+”) appeared at the center of the dark screen and it lasts throughout the entire trial until rest. At -1s, subjects received a 175 Hz vibration burst lasting 0.2s on the median tendon of both wrists simultaneously, with equal intensity as a prompt for the task to follow. At 0s, either left or right wrist vibro-tactile stimulation would be applied, accompanied by a left or right pointing red visual cue superimposed the white cross. The vibro-tactile stimulation lasted for 5s, while the visual cue lasted for 1.5s. At 5s, the unilateral vibro-tactile stimulator stopped, and the white cross on the screen disappeared. A rest time of 1.5s was given, followed by an additional random rest time of 0 to 2s to prevent subject habituation. Each run contained 20 trials of both left and right task applied in random order. A 2-4 min rest was given between runs. See Figure 5 for the participant’s view during the experiment.
Figure 5. The participant interface during the experiment
3.1.4 Data preprocessing & signal decomposition
Offline signal processing was performed where the EEG data was manually corrected for artifacts using EEGLAB toolbox prior to analyzing event-related spectral perturbations (ERSP) and event-related desynchronization (ERD) / event-related synchronization (ERS) [49]. Artifacts were removed in two steps: 1) trials containing non-ocular artifacts (i.e. large drifts, electrode spikes, saturation) were removed; 2) independent component analysis (ICA) was used to remove ocular artifact components from the remaining epochs; this approach has been used in previous work, such as [49]–[51].
A fourth-order Butterworth filter was applied to the raw EEG signals prior to further spatial filtering. In this study, common spatial pattern (CSP) is used for prior to the classification of EEG epochs into either ‘left’ or ‘right’ hand stimulation. CSP is performed
by simultaneous diagonalization of the covariance matrices of the data from two classes (left and right for this research) [44]. See below for the details of CSP.
The kth trial of the EEG signal before CSP filtering is represented as Ek with dimensions 𝐶 × 𝑁, where 𝐶 is the number of EEG channels and 𝑁 is the number of sample points of the trial. The normalized spatial covariance of the EEG can be obtained from
𝐶$ = 𝐸$𝐸$
(
trace(𝐸$𝐸$()
(1) where 𝑘 is the trial index and ′ denotes the transpose operator and trace(x) is the sum of the diagonal elements of x [44]. For each of the two classes to be separated, let the spatial covariance: 𝐶- = . 𝐶$ $Î /0 𝐶1 = . 𝐶$ $Î /2 (2) where 𝑆- and 𝑆1 are the two index sets for the two separate classes, left and right, respectively [44]. The projection matrix 𝑊 is obtained from the augmented generalized eigen-decomposition, (𝐶- + 𝐶1)𝑊 = 𝜆𝐶1𝑊. The rows of 𝑊 are spatial filters; the column of 𝑊78are spatial patterns. The filtered signals 𝑍
$ = 𝑊𝐸$ is uncorrelated between each of
the 𝑘th trials. The feature vectors for classification were obtained by taking the log variance of the first three and last three rows of the spatially filtered signal 𝑍$, as these correspond to the three largest eigenvalues for one class and three smallest eigenvalues for the opposite class [44]. These retained CSP components (rows) were then used as inputs to linear discriminative analysis (LDA) for classification.
ERSP visualizes the mean change in spectral power relative to a baseline [52]. The baseline reference interval for ERSP calculation was taken from -2 to -1.2s, which is the 0.8s interval prior to the onset of the bilateral vibration burst. Each spectral transform of individual response epochs is normalized by dividing by their respective mean baseline spectra [53]. After performing the artifact removal mentioned above, Small-Laplacian (nearest-neighbour) filtering was applied to the EEG as a high-pass spatial filter to accentuates localized activity and reduces more diffused activity [54]. The ERSP at channels C3 and C4 (which correlates with the activation of the left and right hand respectively) was calculated after small Laplacian filter was applied, to visualize right and left stimulation, respectively. The resulting ERSP visualizes the mental processes and cortical responses to left or right vibro-tactile stimulation.
3.1.6 Event-related desynchronization/ synchronization
ERD and ERS are respectively defined as the percentage of EEG power decrease or power increase with respect to a baseline reference. Average ERD/ERS displays the activation and deactivation of brain regions. It is calculated in a defined frequency band in relation to a baseline reference interval [40]. The baseline reference interval for the ERD/ERS calculation was taken from -2 to -1.2s, which is the 0.8s period prior to the onset of the bilateral vibration burst. Similar to ERSP calculation, the small-Laplacian (nearest-neighbour) [54] was applied to the EEG after artifacts (such as ocular and physical muscular movements) were removed [50]. The value of the Laplacian at each electrode is calculated by combining the value at the location with values of surrounding electrodes. For small-Laplacian it takes the four immediately adjacent electrodes. The distance of the surrounding electrodes determines the spatial filtering characteristics; as distance
decreases, the Laplacian becomes more sensitive to potentials with higher spatial frequency. Hence this gives small-Laplacian gives a high signal-to-noise ratio, especially for spatially concentrated tasks such as respective hand/wrist activation.
The statistical significance of the ERD/ERS was verified by applying a t-percentile bootstrap statistic to calculate confidence intervals with a significance level of α = 0.05.
The quantification of ERD/ERS was calculated in following three steps: 1) Bandpass small Laplacian filtered signals between alpha-beta (8-26 Hz) frequency band; 2) Band power calculation, and 3) Epoch averaging to obtain grand average ERD/ERS. ERD/ERS topoplots sample points were plotted after averaged over the specified time intervals.
3.1.7 BCI Offline Classification
The raw EEG data was used for analyzing BCI classification accuracy to simulate the performance from online BCI. Therefore, no artifact removal was done for the analysis on BCI performance. A 10 × 10 cross validation method was used to evaluate the classification accuracy of each modality. Firstly, the trials were randomly permutated (40 trials for class one and 40 trials for class two). Secondly, the trials in each class were equally divided into ten partitions. Each partition is used as a testing set, classified by the classifier trained on the remaining nine partitions – this yields a classification accuracy for each partition. The training set was used to obtain the CSP components and the parameters of the LDA classifier, which were then used to classify the testing set. This process is repeated ten times, hence generating 100 classification accuracy indexes [44]. These results are averaged to generate a final classification result.
The EEG data from 0 to 2s was used from each epoch for classification accuracy calculation. No trials were discarded to simulate online classification accuracy. There was high inter-subject variation for discriminative frequency bands, hence smaller sub-frequency bands were used in the subsequent analysis: theta (θ, 6-8 Hz), low alpha (α-, 8-10 Hz), alpha (α, 8-13 Hz), upper alpha (α+, 10-13 Hz), low beta (β-, 13-20 Hz), beta (β, 13-26 Hz), upper beta (β+, 20-26 Hz), alpha-beta (αβ, 8-26 Hz), and gamma (η, 10-16 Hz). 10 × 10 cross validation was performed for all sub-frequency band to evaluate BCI performance, and the frequency band that resulted with the highest classification accuracy was individually selected for each subject.
3.1.8 Statistics
The data for ERD/ERS, the data was averaged over segments of 0.2s and the difference between left and right stimulation was analyzed via an independent-sample
t-test with Bonferroni correction for each segment. An independent-samples t-test was also used to compare BCI performance accuracies between younger and older adult populations. This statistical test was chosen because we are comparing between two populations with small sample sizes.
Our null hypotheses are: 1) there is no difference between C3 and C4 in each of the tasks performed, and 2) that there is no difference between younger and older adults in BCI classification accuracy. The significance level of all tests were set at α=0.05.
3.2 Results
3.2.1 Participants
Participants were 11 older adults (ages 56~83; 8 female) and 11 younger adults (ages 18~25; 6 female). All participants were BCI naïve, right handed, had normal or corrected vision, with no reports of psychiatric or neurological disorders, vascular diseases, use of psychiatric drugs, or any drugs affecting the central nervous system. All subjects provided informed consent prior to participation.
The age of the older (72.0±8.07 years old) and younger (21.7±2.76 years old) adult populations were significantly different (t=21.8, p<0.001). The number of years of education of the younger (16.2±3.0 years) and older (4.8±2.67 years) adults were not significantly different (t=-1.25, p=0.226).
3.2.1 Event-related Spectral Perturbation
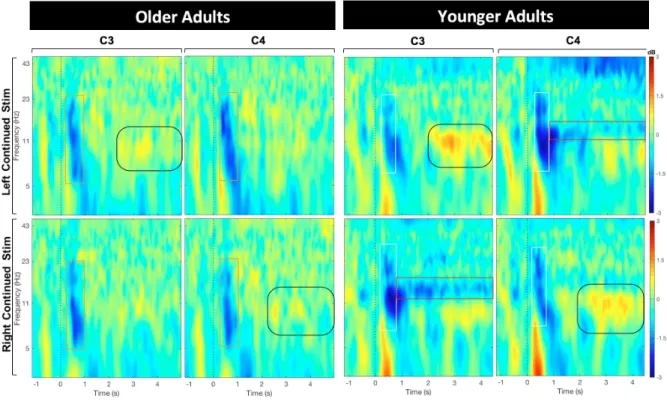
A comparison of the older and younger adults’ ERSP at small-Laplace filtered C3 and C4 channels is shown in Figure 6. For younger subjects, after the unilateral (left or right) vibration stimulation is applied at 0s, a prominent bilateral desynchronization is observed in the alpha-beta frequency band (8-26 Hz), for approximately 0.5s – this is highlighted for visual purposes with the white rectangles in Figure 6. Following this bilateral activation is a sustained contralateral desynchronization centered in the high-alpha frequency band (10-14 Hz) – this is outlined with red bounding boxes. However, for older subjects only the bilateral desynchronization was present (outlined by orange bounding boxes); the latter sustained contralateral desynchronization seen in younger subjects was absent.
Another observation is the ipsilateral synchronization in the alpha frequency band (7.5-12.5 Hz) that is present in both the younger and older subjects, appearing
approximately from 2 to 4s – outlined with rounded black bounding boxes However this is much more prominent in the younger adults than in the older adults.
Figure 6. Average ERSP for all younger and older adults before & during vibro-tactile stimulation, which lasted between seconds 0 – 5.
3.2.2 Event-related desynchronization/ synchronization
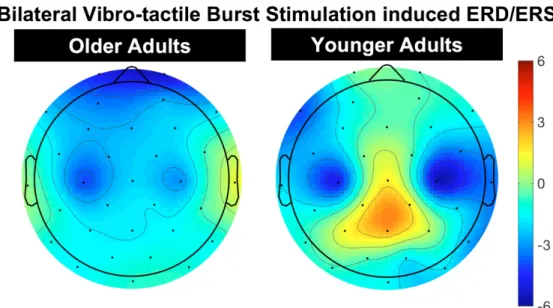
The ERD/ERS was plotted within the alpha-beta (8-26 Hz) frequency because this band is shown to contain the most discriminative information from the ERSP analysis above (Figure 6). The ERD/ERS topoplots in response to the 200ms bilateral stimulation at -1s (on both left and right wrist) was averaged over -0.4 to -0.1s (Figure 7). It is evident that the desynchronization at channels C3 and C4 are more pronounced in younger adults but was absent for older adults (Figure 8a). In the younger adults, there was a prominent synchronization centered around the central-parietal region and parietal lobe at channels CP1, CP2 and PZ, which was absent in the older adults.
Figure 7. Bilateral vibrotactile stimulation ERD/ERS topoplot averaged over 0.4 to -0.1s in response to the 200ms bilateral stimulation at -1s.
(a)
(b)
Figure 8. Comparison of average ERD/ERS of younger and older participants – greater contrast between left and right in younger adults
Calculated in alpha-beta frequency band (8-26 Hz). a) denotes the ERD/ERS change for channels C3 and C4 over time; the center dashed line shows the averaged ERD/ERS while the shading around the dash line indicates averaged ERD/ERS±SD. The thick black line on the bottom superimposing the graph indicates regions of significant difference (averaged over intervals of 0.2s) between the two channels (p<0.05, with Bonferroni correction). b) displays the ERD/ERS averaged over the interval 0.25 to 1s as a topograph.
For the ERD/ERS in response to the sustained vibro-tactile stimulation from 0 to 5s, a distinct contralateral oscillatory desynchronization was observed for younger adults but was absent for older adults (Figure 8a). For younger adults, the desynchronization of the channel associated with the respective wrist being stimulated (EEG channel C4 for left hand and channel C3 for right hand) would reach a maximum of 70% power decrease compared to baseline, sustaining until the end of the trial at 5s; for older participants, this differentiation was neither as clearly visible nor sustained. The power decrease on both sides reaching a maximum of 40% and rebounding back to baseline immediately (at 0.5s), indicate a brief bi-lateral activation in response to a unilateral stimulation. Further, the standard deviation for older adults is especially large during left hand stimulation, with channel C4 completely overlapping C3. As indicated by the horizontal black lines at the bottom of the plots in Figure 8a, the lateralization pattern is distinct and significantly different in the younger adults but not in the older adults, especially for left (non-dominant) hand stimulation. The mean of ERD/ERS across the scalp over the period from 0.25 to 1s is displayed as topographs in Figure 8b. The desynchronization of channel C3 and C4 are distinctly less prominent and diffused in the older adults compared to the younger adults.
3.2.3 BCI Classification Accuracy
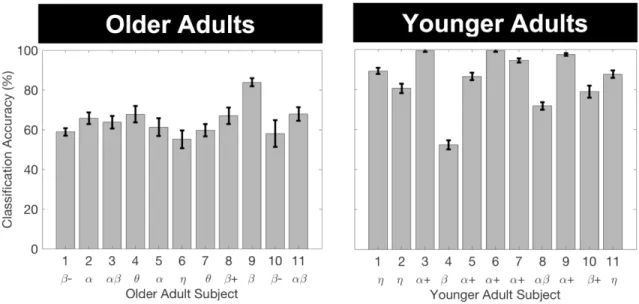
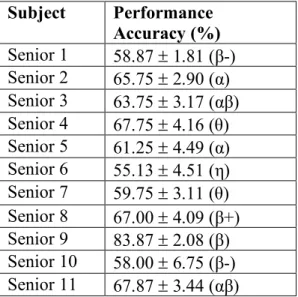
Figure 9. BCI classification performance accuracy – most optimal frequency band labeled
Calculated separately for younger and older adults. Error bars indicate one standard deviation. The frequency band that yielded the highest classification result is shown below the x-axis.
Figure 9 compares the offline BCI classification performance for the aggregated right and left vibro-tactile sensation task for individual older adults and younger adult subjects, respectively. The exact percentages are displayed in table format in Appendix C. The average left vs. right BCI performance accuracy of older subjects was 64.5±7.75%, more than 20% lower than that of the younger subjects (85.3±14.1%) and statistically significantly different (t(20)= -4.3, p <0.001).
Chapter 4.
Discussion
Our results showed that age-related electrophysiological changes in healthy older adults significantly affected SMR characteristics in EEG compared to younger adults. Such changes have critical implications for BCI applications such as BCI-based stroke rehabilitation, which target at older population but are currently developed and validated with much younger population. The significant reduction in activation power spectrum in older adults (seen in Figure 7 & 8) indicates older adult EEG signals are more susceptible to noise and interferences than EEG from younger adults. More importantly, SMR in older adults demonstrated a significantly reduced lateralization, seen through ERSP (Figure 6) and ERD/ERS (Figure 8) in the somatosensory cortex in response to vibro-tactile stimulation, compared to younger adults. These visibly different characters in EEG resulted in a significantly lower BCI classification accuracy for the older adults (Figure 9). For 5 out of 11 of the younger adults, the frequency α+ band yielded the highest classification
result, while that in the older adults is more wide-spread. This indicate that there may not be a concentrated frequency band to target when developing BCIs for the older population, and that the application for each user may need to be more individualized in order to yield a better performance.
Our findings may be explained by changes in the physical structure of the brain including cognition, neurology, and biochemistry, as well as physical features in the body.
affects the majority of brain regions [55]. The greatest shrinkage is usually in the caudate, cerebellum, frontal cortex, insula, anterior cingulate gyrus, superior temporal gyrus, and inferior parietal lobule [55], [56]. The areas being activated in this task (left or right-hand stimulation) is the somatosensory cortex; its structure may be affected by the natural aging of the brain. Cognitively, it is established that aging causes a decrease in processing speed, working memory capacity, inhibitory functions, and long-term memory [22]. Thus, while changes in the brain because of the stroke likely play a significant role, our results indicate that the physiological changes brought about by normal aging may also be a contributing factor to the poor performance of BCI algorithms for stroke survivors that has been found in previous works [15].
This decreased lateralization of activation can be viewed in two contrasting ways: 1) compensation view, which considers the age-related asymmetry reduction to help counteract age-related neurocognitive decline; and 2) dedifferentiation view, which considers this to reflect a difficulty in recruiting specialized neural mechanisms [26]. Similarly, there are also two different explanations on the origin of age-related asymmetry reduction: 1) psychogenic view, which attributes it to a change in cognitive strategies; whereas the 2) neurogenic view, posits it to originate from a change in neural mechanisms [26]. The psychogenic view may explain the quick rebound of the ERD/S back to baseline from the older subjects, indicating an increased efficiency in the brain for normalizing the sensation. In addition, since all the subjects are right handed, hence this view may also partially explain the relative greater sensitivity for the right wrist in comparison to the left wrist in the senior population. These theories may help to explain the decrease in
lateralization observed in the data, however it is out of the scope of this research to be able to postulate the dominance of one explanation over another.
Alternative physiological factors that may contribute to the observed changes in EEG include age-related changes in scalp thickness [57], [58] and skin sensitivity due to mechanoreceptor loss [59]. The scalp thickness change is supported by an additional observation made by the experimenter that there was a noticeably longer EEG electrode set-up time for the older adults compared to younger subjects in using the conductance gel to decrease scalp impedance. We speculate this may be due to a difference in scalp thickness or dryness. In terms of skin sensitivity, a decline in the density of sensory receptors lead to an increase in tactile sensory threshold and decrease in sensation [60]. Sensory receptors involved include: Vater-Pacinian corpuscles in the dermal-hypodermal junction, which primarily feels pressure and vibration, and most sensitive to frequencies 60–400 Hz; Meissner corpuscles in the dermal papillae, which mediates touch sensation, and responds maximally to frequencies 20–50 Hz, and Merkle disks, which are sensitive to frequencies 5–15 Hz [61]. These receptors fine-tune the threshold for detecting sensation. The total number of sensory nerve fibres activated determines the intensity of sensation. As the stimulation produced by the actuators used in this experiment was 27 Hz, modulated with a 175 Hz sine carrier wave, it primarily targets the Vater-Pacinian corpuscles which feels vibration.
Since many EEG processing algorithms for BCI are based on exploiting the lateralization of SMR (e.g., CSP and Laplacian methods), our finding that the classification accuracy in elderly is significantly lower than the younger population by over 20% indicates that normal aging results in a detrimental impact on the performance of these
classification methods. A recent study by Volosyak et al. [62] investigated the age-associated difference in BCI performance by examining the accuracy and speed of a steady-state visual evoked potential (SSVEP)-based BCI spelling application. The results showed that older adults had a significantly lower information transfer rate compared to younger adults [62]. Volosyak et al. attributed their results to smaller SSVEP amplitudes for older adults as well as slower reaction time and learning ability [62]. Our findings are in agreement with this previous research in that we found similar patterns of amplitude reduction in the older adult population, except we measured it in the ERD power amplitude. However, different from [4], we further demonstrated the significant reduction of lateralization in ERD/ERS. Our research suggests that population alternative algorithms and approaches need to be developed for BCI systems for older adults with less dependence on lateralization is required.
Our results agree with the CRUNCH hypothesis proposed by Reuter-Lorenz et al.
[63] and HAROLD theory proposed by Cabeza et al. [26], both of which suggest a compensatory account of neural circuits that results in a more symmetrical activation in the senior’s brain compared to younger adults. This can be observed in our results in the ERSP as well as ERD/ERS (Figures 6–8). This is a crucial aspect as the change in the locality and strength of activation can significantly alter BCI classification accuracy (as seen in Figure 9), especially when relying on spatial information from CSP and Laplacian filters. This finding is crucial to the field of BCI rehabilitation such that we need to re-think the fundamental elements, such as laterality-based activation, on which many of the traditional methods are based on, and develop new tactics that utilize appropriate measures to enable older adults to adequately use BCI applications such as for rehabilitation.
4.1 Confounding factors and limitations
Physiological confounding factors that may have played a role in the observed differences include scalp thickness [57], [58] and skin sensitivity due to mechanoreceptor loss [59], [60], and there may well be others. In our research, we noted it takes a noticeably longer time to set up the EEG electrodes and noticed an increased scalp impedance for the older adults. We speculate this to be due to a difference in scalp thickness or dryness, and we recommend this to be taken into consideration for future research and application targeting older adults. Moreover, we accounted for the differences in skin sensitivity by calibrating all participants’ perception of the vibration prior to the start of the trials, to accommodate for the changes in the perceptual threshold with aging.
Methodologically, since all the older participants were recruited from the Waterloo Research in Aging Participant Pool, there might be inherent bias in the homogeneity of the participant recruitment source. We also recognize that a larger sample size would be more favourable in demonstrating significance; our limited sample size is a major limitation. However, we have demonstrated significant results based on a smaller size, therefore, there is no need for a larger sample size for the current study. In the future, we are looking to further investigate the age-related differences on other BCI modalities such as motor imagery (MI). As MI is also based on lateralization of activation, we suspect there will also be significant changes that accompanies aging in this paradigm. All subjects (older and younger adults) in this study were right handed; while this can be a potential methodological bias, this factor is matched between the two age group populations being compared, and hence it should not be a major point of concern.
Other limitations of our research are factors out of our control, which include individual lifestyle and habits such as physical and cognitive exercise, social status and life experience that may influence EEG [64]. We also used LDA as our classification technique, which has limited performance on more complex, non-linear data; other aforementioned classification techniques may potentially yield better or worse results, depending on the signal features that is used to train the model. In addition, other BCI modalities and signals may also drastically shift the results. As this study only investigated sensorimotor rhythm (SMR), generalizations to other types of signals is premature. However, as SMR are the basis for most BCI-based neurorehabilitation techniques, it prompts the field to take the factor of age and the accompanied brain’s changes that take place into consideration when designing future BCI applications for older adults. In addition, as we only have investigated this age-related difference in healthy older populations, in order to apply the findings to BCI rehabilitation, we need to verify the findings in a post-stroke population. This paradigm may also be a way to assess the heterogeneity in stroke populations. This further consolidates the need to design algorithms to tailor to the changing EEG signals in the older population.