AN INTEGRATED DTM-GIS DATA STRUCTURE: A RELATIONAL APPROACH by M. Pilouk, K. Tempfli Department of GeoInformatics ITC P.O.Box 6, 7500 AA Enschede The Netherlands ABSTRACT
To achieve a better solution to utilizing and maintaining both DTM and GIS datasets more efficiently at one time, a new approach to their integration into a unified data structure is investigated using the triangular irregular network and single-valued vector map models. A relational database approach is chosen for the implementation, which demonstrates the practicability of the model with respect to various topological queries and to obtain information about terrain relief from the unified dataset.
INTRODUCTION
The increasing demand for reliable and comprehensive digital data for various purposes governs the need for the integration of diverse geographic information (GI). The integration of DTMs and GISs is one of the issues in this context. ADTM represents terrain relief, thus the shape of the (topographic) surface in 3-dimensional space, whereas a GIS refers to other features of the terrain such as hydrography, soil, land use, etc, which are traditionally presented in 2-D. At present, DTMs and GISs are usually integrated only by interfacing approaches (e.g., Ebner et al, 1990; Mark et al, 1989; Arc/Info, 1991). In such approaches the data structures of the DTM and the GIS remain unchanged, which implies separate data storage and manipulation of the two systems. This can cause problems of integrity of terrain representation, reliability of derived height and slope information, and low efficiency whenboth sets of information have to be used to facilitate better spatial analysis and graphic presentation. We are therefore investigating a different approach which aims at a higher level of integration. In developing a unified data structure, the paper outlines the basic concept, the data model and the construction of a relational database structure. To demonstrate some queries, the tables were implemented in dBASE IV SQL. A thorough analysis of the query space as well as rules for data editing and updating are still under investigation and therefore not included here.
TRIANGULATION AND SINGLE VALUED VECTOR MAP
Two main principles in structuring data are proximal ordering and decomposition into primitives. Digital terrain relief modelling requires interpolation, which in turn requires that the proximal relationships among the given points are known. As DTMs in most cases are based on nongridded data, adjacency can be expressed best by a triangulation. Triangulation of surveyed points in order to interpolate contour lines for topographic maps was in fact applied long before the advent of computers. Thiessen (1911) polygonal tessellation and its geometric dual, the Delaunay triangulation (see Pilouk and Tempfli, 1992), are of special interest as it establishes a natural neighbour structure. Furthermore, the triangular irregular network (TIN) structure can readily accommodate skeleton data (ridge lines and drainage lines) as triangle edges, which generally increases the fidelity of surface representation (see Pilouk, 1992; Roushannejad, 1993). Among the various advantages of a triangular tessellation, as pointed out frequently in the literature, it is worth mentioning that it allows for local editing and updating of elevation data without elaborate reinterpolation as is necessary in a grid-based structure (see Fritsch and Pfannenstein, 1992).
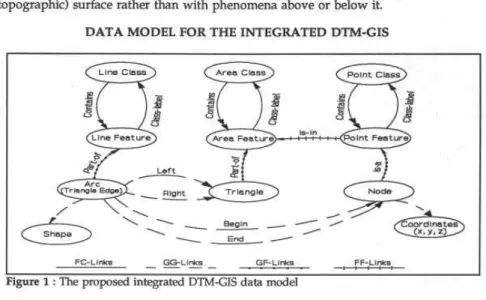
The concept of triangulation can be applied also to any othervector-structured GI. Any area feature can be decomposed into triangles, a line feature can be decomposed into a sequence of edges of triangles, and a set of point features can be vertices of triangles. This way a congruency can be established between structuring "DTM data" and "GIS data". Molenaar (1988) suggested a model for vector-structured representations of a terrain situation. What he called the formal data structure (FDS) of a single-valued vector map (SWM) distinguishes three data types: terrain features, their geometric primitives, and their thematic attributes. These elementary data types and the elementary links between them can be graphically represented as indicated in figure 1. The FDS provides a 2-D topology; the coordinates linked to 'node', however, can be 3-dimensional. Nevertheless, interpolation (i.e., surface construction) in a SWM would be difficult without an adequate tessellation. On the other hand, using a complete 3-D model is expected to cause too much overhead for applications dealing with only the (topographic) surface rather than with phenomena above or below it.
DATA MODEL FOR THE INTEGRATED DTM-GIS
Figure 1 : The proposed integrated DTM-GIS data model
By extending the FDS ofSWMto include on the geometric level the item 'triangle' (see figure 1), a data model is obtained which serves the purpose of unified handling of all
surface related data. In the unified structure (UNS), an area feature is not anymore linked to 'arc' directly but to its geometric primitive 'triangle' . An area feature consists of one or more triangles. Arcs are linked to triangles through the 'left' and 'right' geometry-geometry links (GG-links). The vertices of a triangle can be found through the arc-triangle and arc-node links. Each node is represented by one coordinate triple which consists of one X, one Y, and one Z. Since all nodes are equipped with 3-D coordinates, a plane equation can be derived from the three vertices of a triangle. This allows further derivation of information which relates to terrain relief, such as elevation at any point, slope, and aspect. Additionally, the real-time visualization is no longer limited to orthogonal views (the traditional map). Popular visualizations, such as perspectives, pseudo-perspectives, and stereo views, can be generated more efficiently, and can be combined with a cursor to pick-up information from the "3-D graphics".
TOPOLOGICAL ASPECT OF THE INTEGRATED DTM-GIS DATA MODEL The UNS fits nicely into topological reasoning (see Egenhofer et a1,1989). It consists of 0-simplicas (points), 1-simplicas (arcs), and 2-simplicas (triangles), which are the smallest data elements in 0, 1, and 2 dimensions respectively . This approach means that the decomposition process of 2-cells (area features) into 2-cell simplicial complexes, which are the collection of 2-simplices, is needed. By equipping each 0-simplex with 3-D coordinates (x,y,z), mapping of this model in 3-D metric space becomes possible and
meaningful. The simplicialcomplexes (e.g. point, lineand polygon objects) can be formed from these simplices. Consequently, various topological operations and derivation of topological relationships can be easily performed by using the basic binary relationships (see Egenhofer et al, 1989), because all objects are said to be decomposed into minimal spatial objects.
A RELATIONAL DATA STRUCTURE OF INTEGRATED DTM-GIS In general, the proposed data model can be mapped into different kinds of data structures (e.g., network, relational, object-oriented, etc.) . We have chosen the relational one, considering ease of implementation, flexibility, and availability of various database management systems (DBMSs). The network data structure is powerful but it takes more effort in implementation, while an object-oriented one is even more difficult to implement because it needs careful definition for not only each object but also the methods to access that object. Moreover, only few object-oriented database management systems are commercially available, while a network structure normally has to be implemented by programming. Another reason for choosing a relational approach is its maturity in providing a rigorous procedure for mapping the data model to a data structure. This is known as normalisation, which is the mechanism to ensure data integrity of the database against updating anomalies. The common approach is to decompose a preliminary table into first, second, third, fourth, and fifth normal forms; this way several normalised tables are obtained. However, this seems to be a very tedious task. A more appealing approach has been proposed by Smith (1985), where tables are composed from a dependency diagram. If the procedure is followed correctly, the obtained database tables are then fully normalized. The steps can be summarized in four phases: constructing dependency statement, mapping from dependency statements to dependency diagram, composing relational tables from the dependency diagram, and improving the handling of the relational table by introducing a surrogate key if necessary.
Constructing dependency statement
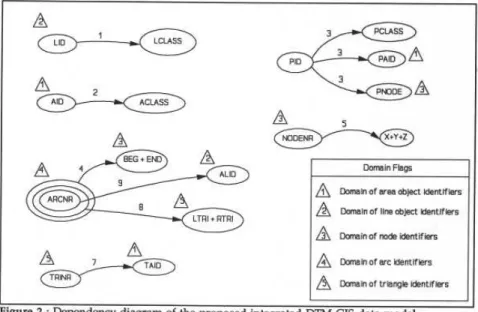
In this phase the data fields to be stored in the database have to be identified first. Looking at the data model in figure 1, data fields are encompassed by ellipses, whereas the relationships are the labels on the lines connecting two ellipses. The relationships between each pair offields is analyzed and then translated into a dependency statement. The list of dependency statements is given below. It deviates from the list given by Bouloucos (1990) according to the change that was introduced to the FDS. Modified statements are marked with '*'; added ones with '+' .
(1) Aline feature identified by an LID belongs to one LCLASS line feature class. (2) An area feature identified by an AID belongs to one ACLASS area feature class. (3) A point feature identified by a PID belongs to one PCLASS point feature class, is represented by one PNODE node number and may fall inside one PAID area feature.
(*4) An arc identified by ARCNR has one BEG starting node and one END ending node. (*5) Each NODENR node has a position given by a one X x-coordinate, one Y y coordinate, and one Z z-coordinate.
(6) The original dependency statement on crossing of line features is deleted since line crossings (above/below) are taken care of by given 3-D information and dependency statement 8.
(+7) A triangle identified by TRINR represents at most one TAID area feature. (+8) An ARCNR arc has at most one LTRI triangle on its left side, at most one RTRI triangle on its right side (null value of LTRI and/or RTRI indicates that this arc is a part of crossing over or under of that part of the surface and thus is not a triangle edge).
(+9) An ARCNR arc represents at most one ALID line feature. Mapping from dependency statements into dependency diagram
From the above list of dependency statements, thecorresponding dependency diagram can be drawn as shown in figure 2. The attributes (data fields) are shown within bubbles. Aline between two bubbles indicates a relationship between one data field and the other. A single-headed arrow indicates that it is a single-valued dependency and a double
� � � �
Domain Flags Domain of area object identifiers
Domain of line object identifiers Domain of node identifiers
Domain of arc identifiers Domain of triangle identifiers Figure 2 : Dependency diagram of the proposed integrated DTM-GIS data model headed arrow indicates a multi-valued dependency. More than 1 bubble covering a data field indicates that not all the relationships may apply to every value of the field. For example, ARCNR = 60 in figure 4 has a left and a right triangle but is not part of a line feature. A number adjacent to a line between two bubbles indicates the dependency statement number. Each domain flag which is the indicator of different named fields having a common field type (e.g., TRINR, LTRI, and RTRI are of the same field type representing triangle identifiers) is shown as a number within a small triangle.
Composing relational tables from dependency diagram
First tables are composed from the single-valued dependencies and then from the multi-valued dependencies . A bubble which has no arrow pointing to it becomes a primary key field of one table. A target bubble becomes a data field in the same table. A bubble which is pointed to by an arrow and has a domain flag also becomes aforeign key field in the same table. In case of multi-valued dependency, all data fields emanating arrows comprise the primary key. Special care should be taken here if there are more than three fields comprising a primary key; the table may not be practicable, which results in bad response time. The solution is to split into two tables by introducing a surrogate key acting as the primary key for one table and as a foreign key in the other. The following tables result:
Rl : LINE (LID, ldass) R5 : NODE (NODENR, x, y, z) R2: AREA (AID, aclass) R7: TRIAREA (TRINR, taid) R3: POINT (PID, pdass, paid, pnode) R8: ARCTRI (ARCNR, ltri, rtri) R4: ARC (ARCM, beg, end) R9: ARCLINE (ARCNR, alid)
QUERY DEMONSTRATION Preparation
For ease of comparison with the SWM, the example given by Bouloucos et al (1990) and shown in figure 3 is used as a given vector map. Height information is obtained from a DTM which was derived from a contour map. Before integrating the DTM and the vector map, the topological relationships (tables) of the vector map must be constructed. This is assumed to be completed already. The newdatabase is created in the following steps:
(1) Converting all nodes of the map (figure 3) to raster format according to their x and y coordinates. The ILWIS version 1.3 POINTS module was used for this purpose. The
� � � � � � � � �
output is the raster image of all nodes. The pixel value of each raster node is the NODENR (from table R5 in the preceeding
section) . 3
(2) Overlaying the image obtained from step (1) with the DTM to provide the z-coordinate for each node.
(3) Tessellating the nodes image by using the INTTHS program (see Pilouk, 1992). The output is the Thiessen polygon image, with
each polygon given the colour 399
value corresponding to the value of NODENR.
(4) Generating TIN data structure by using the THSTIN
program (see Pilouk, 1992). The
IalL
422output is a vertex-based TIN structure. The graphical
representation of this result is Figure 3 : Single valued vector map (see Appendix shown in figure 5. A for legend)
(5) Creating the TRIAREA table (R7 in preceeding section) in
dBASE IV and then importing the TIN data from step (4) into this table, updating the TAID field in order to specify the area feature where each triangle belongs (a containment check algorithm can be applied for this purpose).
(6) In the structure of the SVVM, there is only one arc table; in the UNS we have three, i.e., R4, R8, R9. To create them, first the structure of the original arc table is changed by adding ARCNR according to figure 4. Eventually this table will become R4 (see preceeding section) . Next the ARCTRI table is created and the data values are entered of left and right triangles in each record. To automate this updating, an algorithm which computes the turning direction from one arc to the next can be used (see Shmutter and Doytsher, 1988). The ARCLINE table (R9) is created next and the data values of ALID are obtained by transferring those arcs that represent a line feature from the original arc table. The last step is deleting from the arc table those fields which must not be in the table R4.
(7) Extending the structure of the node table by adding a data field for z-coordinate, then updating this data field according to the output from step (2).
(8) Adding two new nodes in the NODE table where the "ROAD2" crosses "RAILROAD" and "RIVERS" using the same planimetric coordinates (x, y) but different height (z-coordinate), and three new arcs as follows:
Existing Nodes New Nodes New Arcs NODENR X Y z NODENR X Y z ARCNR BEG END
20 32 7 35 40 32 7 40 105 21 40 25 32 12 36 41 32 12 41 104 40 41 105 41 27
Updating the ARCLINE table by changing the arcs that belong to "ROAD2" (say composing a bridge on "ROAD2") as follows:
Existing arcs Updated arcs ARCNR ALID ARCNR ALID
19 5 103 5
29 5 104 5
38 5 105 5
(9) Dropping the line-crossed table (R6) of SVVM.
The metamorphosis of the SVVM (figure 3) obtained by the above steps is shown in figures 4 and 5.
� � � � � � Query examples
(1) Question: How large is the forest area represented on this map?
Approach: Retrieve all triangles from TRIAREA table which belong to the area class forest (AID = 'FOREST') and then compute the summation of the area of each triangle by first retrieving the three vertices of each triangle.
SQL: SELECT trinr FROM triarea, area WHERE aclass = 'FOREST' AND aid = taid;
Result : The output from this stage is all the triangle numbers that belong to the forest area.
TRIAREA->TRINR
2, 6, 10, 20, 27, 47, 52, 53, 58, 59, 60, 61,62
(compare figure with 3 and 5) Figure 4 : SVVM after decomposition into triangles The next step is to retrieve showing all arc numbers
coordinates of the vertices of these triangles (TN).
SQL: SELECT DISTINCT arcnr FROM triarea, arctri WHERE (trinr = TN)
AND Mrinr =1tri) OR (trinr = Ad)) SAVE TO TEMP triside; SELECT DISTINCT nodenr, x, y, z FROM arc, node, triside WHERE (tr1side .arcnr=arc .arcnr) AND ((nodenr = beg)
OR (nodenr = end));
Result : If TN is 20, the output is as follows:
NODENR NODE->X NODE->Y NODE->Z
3 8 28 40
4 10 24 35
39 6 12 47
(compare with figure 5) The area of each triangle can be computed by using various formula; the summation of all triangles that belong to forest
area is the area of the forest in Figure5 :Triangular Irregular Network showing triangle
this map. and node numbers
The first question can be
extended to the elevation problem such as: (2) Question: Give all forest above 40 m.
Approach :
(a) Retrieve all forest areas using the approach as demonstrated in question (1) with the additional criterion that at least one of the three nodes of a triangle must have a z coordinate greater than 40. The result can be saved in the view or temporary table.
(b) Using the previously saved view or temporary table as an input, separate triangles with all three nodes having z-coordinate greater than or equal to 40 m (save as GT40a
� �
table) from those triangles which have at least one node with a z-value smaller than 40 (save as VERIFY table).
(c) Using VERIFY table as an input, trace all contours at 40 m through this set of triangles and at the same time decompose them into new triangles using the derived contour line as triangle edges. Applying the same procedure as in step (b), separate triangles into two sets: one with all nodes having z-values greater than or equal to 40 (save as GT40b table) and the other one with all nodes having z-values less than or equal to 40 (save as LT40 table).
(d) The union of the two triangle sets obtained from steps (b) and (c), namely GT40a and GT40b respectively, comprises the forest area above 40 meter.
(e) Using the combined data from (d), compute the area of the forest above an elevation of 40 meters.
Note: The SQL example of question (2) is not given because it is almost the same as demonstrated in question (1). Moreover, the contour tracing algorithm needs to be implemented first. Details and programming example can be found in (Alias, 1992). (3) Question: Give all the triangles which are the neighbours of triangle number 18.
Approach: Retrieve the three vertices of this triangle from TRIAREA table and then match with the begin and end nodes of the arc from the arc table. The left or right triangle of this arc, which has a number different from
18, is one of the neighbours of triangle 18.
SQL : SELECT trinr, ltri, rtri FROM triarea, arctri
WHERE ((Itri = 18) OR (rtri = 18)) AND (trim = 18);
Result:
TRIAREA->TRINR ARC->LTRI ARC->RTRI 18 11 18
18 18 21
18 19 18
The above result implies that the neighbours of triangle 18 are 11, 21, and 19 (compare with figure 5).
(4) Question: Which line features are crossed by a specific one?
SQL:
(i) SELECT nodenr,x,y,z FROM node,arc,ardine WHERE (livid=alid) AND (ardine.arcnr=arc .arcnr)
AND ((nodenr = beg) OR (nodenr=end)) Figure 6 : Perspective view of the terrain. SAVE TO TEMP nodesofl;
(ii) SELECT distinct node.nodenr node .x,node.y node .z (iii) SELECT distinct alid,ldass
FROM node,nodesofl FROM ardine,line,arc,crosnode
WHERE (node .x=nodesofx) WHERE ((crosnode.nodenr=beg) or (crosnode.nodenr=end)) AND (node .y=nodesofl.y) AND (arcarcnr=ardine .arcnr) AND (alid=lid)
AND (node .zonodesofl .z) AND (alidolinid);
SAVE TO TEMP crosnode;
Result: If linid = 5 (ROAD2) the output is
ARCLINE->ALID LINE->LCLASS 3 RAILROAD 4 RIVERS
DISCUSSION
From the above examples, We can easily see that the extended data model maintains the obvious topological characteristics of SWM. Therefore, most of the queries which are possible on SWM should also be possible with UNS (see Appendix B). Moreover, it can be seen that the unified of TIN-DTM and GI data structures leads to a more straightforward way of utilizing both types of information, since overlaying of SWM features with the DTM every time after a query is not needed nor is a large necessary programming effort. In general, UNS shows flexibility and ease of implementation, especially when mapping into a relational database and using a commercial DBMS such as dBASE IV. Furthermore, the two datasets are said to be fully integrated into one, thus data handling and manipulation are simpler.
If there is a requirement for higher fidelity of surface representation than just furnishing the terrain features with z-coordinates, both bulk elevation points and surface skeleton features have to be added to the database, thus, reducing sampling distance. These additional objects should still be maintained within the TIN structure by densifying the existing triangles. For this purpose, the approach proposed by Jackson
(1989) can be applied.
Issues of 3-D topology, such as a road passing over a river, can be handled without the additional table that is needed in SVVM. The problem of line features having different elevation at their crossing is solved by having two nodes, the pair having identical (x, y) coordinates but different z-values. The z-value of the crossing over road is interpolated along the arc of the road at the bridge. Consequently this arc is then split to two new arcs. The bridge node and the two arcs that share it are not part of a triangle. The crossing is found by querying the nodes that have the same (x, y) coordinates. This approach can be extended to also handle "crossing" area features by allowing triangle vertices to carry multiple z-values. However, handling multivalue surfaces, in general, still requires further investigation.
The UNS is expected to have favourable properties in updating of information. Studying this issues requires to establish the consistency rules (see Kufoniyi, 1989). A specific problem arises when a new feature is added as triangles need to be densified. This requires special care in the selection of the interpolation algorithm when a newnode is being added; the height information has to be attached to that node; otherwise the integrity of surface representation may be lost. Another challenge is to develop the means for data handling of this new structure to be able to deal with operations like insertion, deletion, etc., which normally alter the topology.
CONCLUSIONS AND OUTLOOK
Adata model for the integration of DTMs and GISs has been proposed. Mapping from this data model into a relational data structure is illustrated. The obtained result shows a more complete integration between DTM and CIS than can be achieved by tools for exchanging data between both subsystems. The two datasets are no longer separated. All surface features can be represented with 3-D coordinates, which offers additional possibilities in spatial analysis leading to better utilization of geoinformation. The comparison with SVVM shows that UNS is compatible with SVVM in preserving 2-D topology of a planar map and thus is expected to support the same queries as SVVM. Some discussion about problems relating to multivalue surfaces (crossing but not intersecting features) is also given. Further research is directed to the investigation and development of appropriate data handling and manipulating algorithms with regard to the proposed data model. Another issue to be investigated is to what extent adding redundancy will increase the responsiveness. Under study already is the analysis of the query space of UNS and further extension of the model, such as association with complete 3-D models.
ACKNOWLEDGEMENTS
The authors wish to thank Prof. M. Molenaar for his valuable suggestion specifically concerning the data model, and V. Bric for his contribution to the SQL experiment with the model.
REFERENCES
Alias, 1992. Triangular Network in Digital Terrain Relief Modelling, M.Sc. Thesis, ITC, Enschede, The Netherlands.
Arc/Info, 1991. Surface Modelling with TIN, Arc/Info user's ,guide, ESRI, U.S.A. Bouloucos. T, Kufuniyi, O., and Molenaar, M., 1990. A Relational Data Structure
for Single Valued Vector Maps, International Archives of Photogrammetry and Remote Sensing Vol. 28, Part 3/2, Commission III, Wuhan, China, pp. 64-74.
Ebner, H., Hossler, R., and Wurlander, R., 1990. Integration of An Efficient DTM Program Package into Geographical Information Systems, International Archives of Photofammetry and Remote Sensing, Vol. 28, Part 4, Commission IV, Tsukuba, Japan, pp. 116-121 .
Fritsch, D. and Pfannenstein, A., 1992. Conceptual Models for Efficient DTM Integration into GIS, Proceedings Third European Conference on Geographical Information Systems (EGIS '92), Volume. 1, Munich, Germany, pp. 701-710.
Kufoniyi, O., 1989. Editing of Topologically Structured Data, M.Sc. Thesis, ITC, Enschede, The Netherlands.
Jackson, J., 1989. Algorithms for Triangular Irregular Networks Based on Simplicial Complex Theory, ASPRS-ACSM Annual Convention, Baltimore, No, U.S.A., pp. 131 136.
Mark, D.M., Lauzon, J.P., and Cebrian, J.A., 1989. A Review of Quadtree-based Strategies for Interfacing Coverage Data with Digital Elevation Models in Grid Form, International Tournal of Geographical Information Systems Vol.3, No. 1, Taylor & Francis, London, pp. 3-14.
Molenaar, M., 1988. Single Valued Polygon Maps, International Archives of Photogammetry and Remote Sensing, Vol. 27, Part B4, Commission IV, Kyoto, Japan, pp. 592-601 .
Pilouk, M., 1991. Fidelity Improvement of DTM from Contours, M.Sc. Thesis, ITC, Enschede, The Netherlands.
Pilouk, M., and Tempfli, K., 1992. A Digital Image Processing Approach to Creating DTMsfrom Digitized Contours, International Archives of Photogrammetry and Remote Sensing Vol. XXIX, Part B4, Commission IV, Washington, D.C., U.S.A., pp. 956-961 . Roushannejad, A. A.,1993, Mathematical Morphology in Automatically Deriving Skeleton
Lines from Digitized Contours, M.Sc. Thesis, ITC, Enschede, The Netherlands. Smith, H.C., 1985. Data base design: Composing fully normalized tables from a
rigorous dependency diagram, Communication ofthe ACM, Vol. 28, No. 8, pp.826-838. Shmutter, B., Doytsher, Y., 1988. An Algorithm to Assemble Polygons, ACSM-ASPRS
Annual convention, St. Louis, Missouri, pp. 98-105.
Thiessen, A.H., 1911, Precipitation averages for large areas. Mon. Wea. Rev. Tuly' pp. 1082-1084.
APPENDIX A
POINT TABLE LINE TABLE AREA TABLE
PID PCLASS PAID PNODE LID LCLASS AID ACLASS
1 MILL 0 37 1 RIVER2 1 FOREST
2 WELL 2 38 2 RIVER1 2 GRASSLAND
3 CHAPEL 1 39 3 RAILROAD 3 ARABLELAND
4 RIVER3 4 CITY
5 ROAD2 5 LAKE
6 ROAD3 9 OUTERLIMIT
APPENDIX B
Give all arcs bound area "maid". Which area(s) intersected by line livid" ?
SELECT arcnr SELECT ardine .arcnr taid
FROM arctri,triarea FROM arctri,arcline,triarea
WHERE Mtri=trinr) OR (rtri=trinr)) WHERE (arcline.alid=1inid)
AND (taid=maid) AND (ardine .arcnr=arctri.arcnr)
GROUP BY arcnr AND (Qtri=trinr) OR (rtri=trinr))
HAVING COUNT(arcnr)=1 ; SAVE TO TEMP allarcs;
Give all arcs bound map . SELECT distinct arcnr taid
SELECT distinct arcnr FROM allarcs
FROM arctri GROUP BY arcnr,taid
WHERE (ltri=0) OR (rtri=0); HAVING COUNT(arcnr)=1
SAVE TO TEMP inter; Which area(s) touch by area "maid" ?
SELECT arcnr SELECT distinct taid,adass
FROM arctri,triarea FROM inter,area
WHERE ((ltri=trim) OR (rtri=trinr)) WHERE (taid=aid); AND (taid=maid)
GROUP BY arcnr Is area "aid2" inside of area "aidl" ?
HAVING COUNT(arcnr)=1 SELECT arcnr
SAVE TO TEMP bound; FROM arctri,triarea
WHERE ((ltri=trim) OR (rtri=trinr))
SELECT distinct taid,aclass AND (taid=aidl)
FROM triarea bound,arctri,area GROUP BY arcnr
WHERE (taidomaid) HAVING COUNT(arcnr)=1
AND (arctri .arcnr=bound.arcnr) SAVE TO TEMP bound3; AND (taid=aid)
AND (otri=trinr) OR (rtri=trinr)) ; SELECT arcnr FROM arctri,triarea
Which area(s) bounded by line "livid" ? WHERE ((ltri=trinr) OR (rtri=trinr))
SELECT distinct taid,adass AND (taid=aid2)
FROM arctri,triarea,arcline,area GROUP BY arcnr WHERE (ardinealid=livid) AND (taid=aid) HAVING COUNT(arcnr)=1 AND (ardine.arcnr=arctri .arcnr) SAVE TO TEMP bound4; AND ((ltri=trinr) OR (rtri=trinr)) ; mnofarc=0
SELECT COUNT(*) into mnofarc FROM bound4 ; Which area(s) intersected by line livid" ? insert into bound3
SELECT ardine.arcnr,taid SELECT * FROM bound4 ;
FROM arctri,arcline,triarea
WHERE (arcline.alid=livid) SELECT arcnr
AND (ardine.arcnr=arctri .arcnr) FROM bound3 GROUP BY arcnr AND ((ltri=trinr) OR (rtri=trinr)) HAVING COUNT(arcnr)=2
SAVE TO TEMP allarcs; SAVE TO TEMP commarcs,
mcommon=0
SELECT distinct arcnr,taid SELECT COUNT(*) into mcommon FROM commarcs; FROM allarcs
GROUP BY arcnr,taid IF mcommon=0
HAVING COUNT(arcnr)=2 ? " NO, SORRY !"
SAVE TO TEMP inter; ELSE
IF mcommon=mnofarc SELECT distinct taid,aclass ? " YES, BINGO!"
FROM inter,area ELSE
WHERE (taid=aid); ? " NO, SORRY!"
ENDIF ENDIF