Michigan Technological University Michigan Technological University
Digital Commons @ Michigan Tech
Digital Commons @ Michigan Tech
Dissertations, Master's Theses and Master's Reports2018
Quantitative Genetics of Populus
Quantitative Genetics of Populus
Roba BdeirMichigan Technological University, [email protected]
Copyright 2018 Roba Bdeir
Recommended Citation Recommended Citation
Bdeir, Roba, "Quantitative Genetics of Populus", Open Access Dissertation, Michigan Technological University, 2018.
https://digitalcommons.mtu.edu/etdr/709
Follow this and additional works at: https://digitalcommons.mtu.edu/etdr
QUANTITATIVE GENETICS OF POPULUS
By Roba Bdeir
A DISSERTATION
Submitted in partial fulfillment of the requirements for the degree of DOCTOR OF PHILOSOPHY
In Biochemistry and Molecular Biology MICHIGAN TECHNOLOGICAL UNIVERSITY
2018
This dissertation has been approved in partial fulfillment of the requirements for the Degree of DOCTOR OF PHILOSOPHY in Biochemistry and Molecular Biology.
School of Forest Resources and Environmental Science
Dissertation Co-Advisor: Oliver Gailing Dissertation Co-Advisor: Victor Busov
Committee Member: Gerald Tuskan Committee Member: Thomas Werner
Dedication
Dedicated to my beloved parents Mohammad Aiman Bdeir
&
4
Table of Contents
QUANTITATIVE GENETICS OF POPULUS ... 1
Dedication ... 3
Table of Contents ... 4
Preface ... 7
Acknowledgments ... 8
Abstract ... 9
Chapter 1: General Introduction ... 10
Goals and Objectives ... 13
References ... 14
Chapter 2: Quantitative Trait Locus mapping of Populus bark features and stem diameter ... 16
Abstract ... 16
Introduction ... 17
Materials and methods ... 19
Mapping population ... 19
Plant material and construction of genetic linkage map ... 19
Phenotypic measurements ... 19
QTL analysis ... 20
Candidate genes ... 21
Position of LBD genes ... 21
Results ... 22
Analysis of phenotypic correlations among traits and trait frequency distributions 22 QTL analysis and detection across contrasting environments ... 22
Description of QTL clusters ... 23
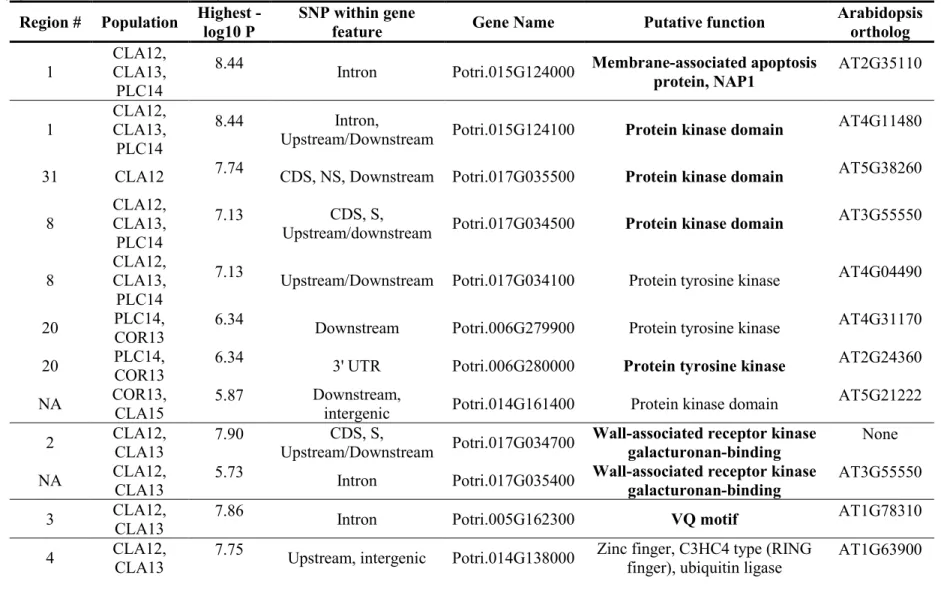
Candidate gene identification and characterization ... 27
5
Future work ... 32
Conclusion ... 33
References ... 34
Figures and Tables ... 40
Chapter 3: Genome-Wide Association Studies of bark texture in Populus tricocarpa ... 47
Abstract ... 47
Introduction ... 48
Material and Methods... 49
Plant material ... 49
Genetic data ... 49
Phenotypic measurements ... 50
Statistical Analysis ... 50
Genome-wide association mapping ... 50
Candidate genes ... 51
Results ... 51
Phenotyping for bark texture ... 51
Genetic associations with phenotypic variation in bark texture ... 52
Characterization of genomic regions ... 52
Discussion ... 53
Radial growth and tissue differentiation ... 54
Suberin accumulation ... 56
Programmed cell death ... 57
Future Work ... 58
Conclusions ... 59
References ... 60
Figures and Tables ... 65
Chapter 4: QTL mapping of stomata density in hybrid Populus ... 80
Abstract ... 80
Introduction ... 81
Materials and methods ... 82
6
Stomatal imprints and density measurements ... 83
Genetic linkage map ... 83
QTL analysis ... 83
Candidate genes ... 84
Results ... 84
Repeatability of stomatal density measurements ... 84
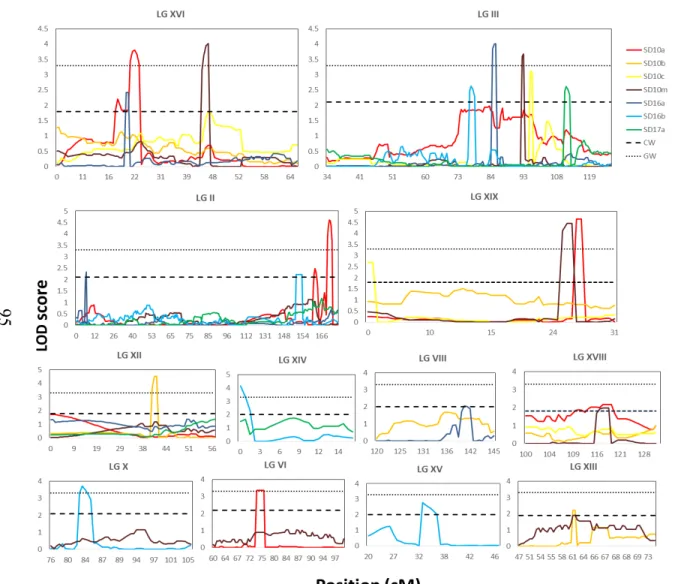
QTL for stomatal density ... 84
Candidate genes ... 86
Significantly overexpressed GO terms ... 86
Discussion ... 87
QTL for stomatal density ... 88
Future Work ... 89
References ... 90
Figures and Tables ... 94
Chapter 5: Summary and Conclusion... 102
7
Preface
The second chapter is a manuscript published in BMC Plant Biology (Bdeir et al, 2017, DOI 10.1186/s12870-017-1166-4), on which I am first author. My co-advisors, Dr. Oliver Gailing and Dr. Victor Busov, and co-authors Dr. Yordan Yordano, Dr.
Wellington Muchero and Dr. Gerald Tuskan helped conceive and design the study. All provided helpful input on the presented paper and helped in writing and revising the manuscript.
The third chapter comprises a manuscript submitted to BMC Plant Biology on which I am first author. My co-advisors, Dr. Oliver Gailing and Dr. Victor Busov, and co-authors Dr. Yordan Yordanov and Dr. Gerald Tuskan helped conceive and design the study. Dr. Wellington Muchero helped by running the association mapping tests. All provided helpful input on the presented paper and helped in writing and revising the manuscript.
The fourth chapter comprises a manuscript draft to be submitted to Tree Genetics and Genomics on which I am first author. My co-advisors, Dr. Oliver Gailing and Dr. Victor Busov, and co-authors Dr. Matias Kirst, Dr. Wellington Muchero and Dr. Gerald Tuskan helped conceive and design the study. All provided helpful input on the presented paper and helped in writing and revising the manuscript.
8
Acknowledgments
I would like to extend thanks to the many people, in many countries, who so generously contributed to the work presented in this thesis.
Special mention goes to my enthusiastic supervisors, Oliver Gailing and Victor Busov. My PhD has been an amazing experience and I thank you both wholeheartedly, not only for their tremendous academic support, but also for giving me so many wonderful opportunities. I am also hugely appreciative for sharing their expertise so willingly. Similar, profound gratitude goes to Gerald Tuskna and Wellington Muchero, who has been a truly dedicated mentor. I am particularly indebted to Wellington for his constant faith in my work, and for his support when so generously hosting me in Oregon. I have very fond memories of my time there.
Special mention goes to Thomas Werner, Matias Krist, Yordan Yordanov and Soha Albukhari, for helping me along my journey.
Finally, but by no means least, thanks go to mom, dad, Moe, my husband Ahmad and my bundle of joy Randa for their unbelievable support. They are the most important people in my world and I dedicate this thesis to them.
9
Abstract
Evidence for bark, stem and stomatal density adaptation to different climates in the model species Populus is seen in both the natural population as well as in the greenhouse, but the genetic basis of these adaptation remains poorly understood. The present thesis investigates bark texture, bark thickness, diameter and stomatal density variations among Populus population using two quantitative genetics methods to attempt understand the genetic system controlling inheritance of these traits and to associate them with respective genes. The first approach aimed at detecting quantitative trait loci (QTL) associated with all phenotypic traits in an interspecific hybrid pedigree (Populus trichocarpa x P. deltoides and P. deltoides) collected across several years and sites. Identifying QTL for these important traits will pinpoint to polymorphisms linked to functional genes and provide a list of candidate genes and a baseline for future work. QTL specific to bark texture were highly reproducible in shared intervals across sites, years and replicates. Furthermore, significant positive correlations and co-localization between traits QTL suggest pleiotropic regulators or closely linked genes. Since bark texture showed promising results using the low-resolution QTL method, it was then analyzed further using high-resolution population genomic approach, the genome-wide association study (GWAS). Association mapping defined the genomic regions associated with natural variation in bark texture in a clonally replicated provenance trials of P. trichocarpa across three sites, multiple years. The association mapping used with a high-density SNP array allowed us to detect narrow genomic intervals (1-20 kb) with high reproducibility and shared candidate genes for bark texture variation. Several candidate genes were identified related putative function and their location close to QTL maxima were highlighted and are worth further investigation using functional genomics or forward genetics approaches. The results should be exploited for the future conservation and breeding of Populus species.
10
Chapter 1: General Introduction
The genus Populus, belonging to the family of Salicaceae, contains 30 to 35 species recognized by taxonomists [1] are forest trees (poplars, cottonwoods, aspens) with tremendous economic and ecological value, as well as valuable characteristics of basic scientific interest. Due to the inherent difficulties of studying such very large long-lived organisms, a model system for forest trees was developed. Poplars have several advantages as a model tree, including fast growth, ease of propagation and of cloning, propensity to hybridize, a small genome and many more [2]. Furthermore, their multiple beneficial uses to society are countless by providing wood, pulp and fiber, contributing to a sustainable development, as well as restoration of forest land and mitigation of climate change.
The spread of fast-growing poplar hybrid plantations across the world was the results of the increasing worldwide demand for wood products as well as the rising world population growth. Breeding programs were established in several countries including Belgium, France, Netherlands, Germany, UK, Canada and the USA [3, 4] to improve poplars for growth, wood products, bioenergy, biomass and environmental enhancement. In China alone, 20 million ha of poplar and willows tree plantings were established by 1978 known as the “Great Green Wall” in efforts to compensate for the many cut forests, resort vegetation and to protect the cities from dust and sand storms [5]. While in the western USA, since the early 1980s private industry planted large blocks of hybrid poplars totaling 20,000 ha [6].
The common cottonwoods of North America(Populus deltoides Bartr. ex Marsh and P. trichocarpa Torr. & Gray) and the black poplar of Europe (P. nigra L.) are the most important species for poplar breeding programs worldwide [7]. P. deltoides
naturally thrives in the eastern, southern and mid-western USA and southern Canada and has been regarded as the fastest-growing native tree in North America [8], while P. trichocarpa occurs in Pacific coastal areas from California to Alaska in the northwestern North America [8]. The hybrid P. trichocarpa × P. deltoides shows hybrid vigour
(heterosis) with many improved qualities including rapid growth rate, excellent form, site adaptability, ease of propagation and genetic pliability [7, 8]. The knowledge from the pioneering poplar genetic and silvicultural work on P. trichocarpa × P. deltoides hybrids
11
along with the recent release of genomic resources and the P. trichocarpa genome [9] will further support the identification of the underlying genetics involved in complex traits important for plants breeding.
In forest genetics, poplars have been adopted by tree physiologists as a model system due to this rapid growth, ease for clonal propagation and strong heterosis in interspecific hybridization [2, 10, 11]. Furthermore, it offers abundant genetic variation in tree morphology, anatomy and physiology where poplars are known to their plasticity and adaptations to varied environments and specific conditions [12]. For these treasons and many more, Populus is the center of forest genetics studies from molecular to
ecological studies to investigation of large-scale systems to improve our understanding of tree growth and development to use in protection of forest ecosystems and practical tree breeding.
The traditional tree improvement for the selection of trees with imperative traits of economic importance an impractically slow and expensive process due to the long generation interval and since selection is based on physical traits [2, 11, 12] and since most poplars will not flower earlier than 4 years old. Additionally, classical genetic tools such as inbred lines cannot be produced rapidly enough due to the inability of self-pollination. Consequently, we need a sustainable program for this long-lived tree with basic knowledge of its genetic infrastructure including breeding and maintenance of living clone banks. Interspecific hybridization to produce large progeny arrays and multi-generation pedigrees are the basis for genetic mapping experiments designed to identify important genomic regions and the underlying genetics affecting important tree
phenotypes [2, 10, 11]. Having the whole-genome sequence of P. trichocarpa readily available and the use of genetic markers in the naturally occurring molecular diversity provided an excellent resource for population and quantitative genetics and genomics of the genus.
Molecular markers are specific DNA sequences especially useful in designing breeding strategies to characterize and evaluate genetic diversity in a population, specifically aiding in maximizing genetic gain and monitoring the efficiency of tree improvement traits [13-15]. They are of significant value in multiple trait breeding and are used more efficiently in applied plant breeding, such as breeding for two traits found
12
in two separate parents are chosen to produce offspring with both desired traits [14]. The discovery of gene linkage, genes on the same chromosome, led to the establishment of linkage maps further aided by the development of DNA molecular marker technology [16, 17]. DNA markers are known to be valuable tools for crop improvements in rice, wheat, maize, barely and many more plant species [18-21]. As for the genus Populus, several types of genetic markers and genetic maps have been developed [7, 22, 23].
Genetic mapping, either QTL (Quantitative Trait Loci) or GWAS (Genome Wide Association Study) is based on the fact that during meiosis genes and markers segregate via chromosome recombination; thus, genes/markers that are close together (linked) will be transmitted together from parent to progeny more frequently. This leads to the
determination of the recombinant frequency and converting them into centi Morgans (cM) as a genetic map unit [24-26]. Once the population is selected, either F2
recombinant inbred lines or a naturally occurring population, the identification of DNA markers, polymorphisms, between individual trees is critical for constructing a linkage map. The final step involves marker scoring and coding on individual tree within a population and conducting linkage analysis using computer programs and creating a linkage map [24-26]. It is used to analyze and detect an association between the trait of interest and the genotype of markers pointing to the underlying genes responsible for the desirable trait.
The conventional QTL mapping is based on the association between genotype and phenotype in a F2 population, derived by backcrossing the F1 hybrid to one of the parents [25]. QTL mapping has high statistical power for detecting a QTL, however, it provides low resolution. Furthermore, only allelic diversity that segregates between the parents of the particular F2 cross can be assayed; thus, we are limited to the genetic diversity present in the parents of our segregating population [25]. The second type GWAS or association mapping (also named linkage disequilibrium mapping) is based on identifying genes from unorganized natural populations. The low levels of linkage disequilibrium (LD) in natural populations of Populus makes candidate gene association studies very accurate since polymorphisms are expected to be within <1 kb of the SNP (single nucleotide polymorphisms) used to detect it [12]. Association mapping offers a very fine resolution, to the base pair variation, thus overcoming the limitations found in QTL mapping
13
technique. Nonetheless, it has its own drawbacks, such as losing power for detection for any rare alleles since the power for detecting a loci using GWAS will be determined by the frequency of alleles [27, 28]. Consequently, GWAS are often complementary to QTL mapping when conducted together they mitigate each other’s limitations.
Goals and Objectives
The primary goal of this study was to identify allelic effects of genes controlling economically important traits, including bark and stomatal density, using two population genomics methods, the conventional QTL mapping and association mapping (GWAS). The main objectives of the present study were:
1. Study the genetic variation among different clones and populations of Populus across replicates and years.
2. Identify positional candidate genes that underlie QTL for bark texture, bark thickness, diameter growth and stomatal density.
3. Test reproducibility and consistency of QTL across years and environments.
4. Comparison between GWAS mapping with QTL mapping results and quantification of the number of candidate genes within the QTL intervals.
5. Identification of the differences in the genetic control of bark texture in P. trichocarpa and P. deltoides.
14
References
1. Eckenwalder JE: Systematics and evolution of Populus. Biology of Populus and its Implications for Management and Conservation 1996, 7:30.
2. Bradshaw H, Ceulemans R, Davis J, Stettler R: Emerging model systems in plant biology: poplar (Populus) as a model forest tree. Journal of Plant Growth Regulation 2000, 19(3):306-313.
3. Riemenschneider DE, Stanton BJ, Vallée G, Périnet P: Poplar breeding strategies.
Poplar Culture in North America 2001(Part A):43-76.
4. Stettler R, Bradshaw T, Heilman P, Hinckley T: Biology of Populus and its implications for management and conservation.: NRC Research Press; 1996. 5. Veste M, Gao J, Sun B, Breckle S-W: The Green Great Wall–combating
desertification in China.Geographische Rundundschan 2006, 2:14-20.
6. Dickmann DI, Isebrands JG, Eckenwalder JE, Richardson J: Poplar culture in north America.: NRC Research Press; 2002.
7. Cervera M-T, Storme V, Ivens B, Gusmao J, Liu BH, Hostyn V, Van Slycken J, Van Montagu M, Boerjan W: Dense genetic linkage maps of three Populus
species (Populus deltoides, P. nigra and P. trichocarpa) based on AFLP and microsatellite markers.Genetics 2001, 158(2):787-809.
8. Isebrands JG, Richardson J: Poplars and willows: trees for society and the environment.: CABI; 2014.
9. Tuskan GA, Difazio S, Jansson S, Bohlmann J, Grigoriev I, Hellsten U, Putnam N, Ralph S, Rombauts S, Salamov A: The genome of black cottonwood, Populus trichocarpa (Torr. & Gray).Science 2006, 313(5793):1596-1604.
10. Wullschleger SD, Jansson S, Taylor G: Genomics and forest biology: Populus
emerges as the perennial favorite. In.: Am Soc Plant Biol; 2002.
11. Taylor G: Populus: Arabidopsis for forestry. Do we need a model tree?Annals of Botany 2002, 90(6):681-689.
12. DiFazio SP, Slavov GT, Joshi CP: Populus: a premier pioneer system for plant genomics. In: Joshi C, DiFazio SP, Kole C, editors Genetics, genomics and breeding of poplar Enfield, NH: Science Publishers. 2011: 1-28.
13. White TL, Adams WT, Neale DB: Forest genetics.: Cabi; 2007.
14. Liu BH: Statistical genomics: linkage, mapping, and QTL analysis. Boca Raton, FA: CRC press; 2017.
15. Bradshaw H, Stettler RF: Molecular genetics of growth and development in
Populus. IV. Mapping QTLs with large effects on growth, form, and phenology traits in a forest tree.Genetics 1995, 139(2):963-973.
16. Sturtevant AH: History of genetics.: Harper and Row; New York And London; 1965.
17. Botstein D, White RL, Skolnick M, Davis RW: Construction of a genetic linkage map in man using restriction fragment length polymorphisms. American Journal of Human Genetics 1980, 32(3):314.
18. Kumar LS: DNA markers in plant improvement: an overview. Biotechnology Advances 1999, 17(2-3):143-182.
15
19. Blair M, Panaud O, McCouch S: Inter-simple sequence repeat (ISSR) amplification for analysis of microsatellite motif frequency and fingerprinting in rice (Oryza sativa L.).Theoretical and Applied Genetics 1999, 98(5):780-792. 20. McLauchlan A, Ogbonnaya FC, Hollingsworth B, Carter M, Gale K, Henry RJ,
Holton TA, Morell MK, Rampling L, Sharp PJ: Development of robust PCR-based DNA markers for each homoeo-allele of granule-bound starch synthase and their application in wheat breeding programs. Australian Journal of Agricultural Research 2001, 52(12):1409-1416.
21. Andersen JR, Lübberstedt T: Functional markers in plants. Trends in Plant Science 2003, 8(11):554-560.
22. Bradshaw H, Villar M, Watson B, Otto K, Stewart S, Stettler R: Molecular genetics of growth and development in Populus. III. A genetic linkage map of a hybrid poplar composed of RFLP, STS, and RAPD markers. Theoretical and Applied Genetics 1994, 89(2-3):167-178.
23. Rahman MH, Dayanandan S, Rajora OP: Microsatellite DNA markers in Populus tremuloides. Genome 2000, 43(2):293-297.
24. Jones N, Ougham H, Thomas H: Markers and mapping: we are all geneticists now.The New Phytologist 1997, 137(1):165-177.
25. Collard B, Jahufer M, Brouwer J, Pang E: An introduction to markers, quantitative trait loci (QTL) mapping and marker-assisted selection for crop improvement: the basic concepts.Euphytica 2005, 142(1-2):169-196.
26. Haley CS, Andersson L: Linkage mapping of quantitative trait loci in plants and animals.Genome mapping: a practical approach 1997.
27. Korte A, Farlow A: The advantages and limitations of trait analysis with GWAS: a review.Plant Methods 2013, 9(1):29.
28. McCarthy MI, Abecasis GR, Cardon LR, Goldstein DB, Little J, Ioannidis JP, Hirschhorn JN: Genome-wide association studies for complex traits: consensus, uncertainty and challenges.Nature Reviews Genetics 2008, 9(5):356.
16
Chapter 21: Quantitative Trait Locus mapping of Populus bark features and stem diameter
Abstract
Bark plays important roles in photosynthate transport and storage, along with physical and chemical protection. Bark texture varies extensively among species, from smooth to fissured to deeply furrowed, but its genetic control is unknown. This study sought to determine the main genomic regions associated with natural variation in bark features and stem diameter. Quantitative trait loci (QTL) were mapped using an interspecific pseudo-backcross pedigree (Populus trichocarpa x P. deltoides and P. deltoides) for bark texture, bark thickness and diameter collected across three years, two sites and three biological replicates per site. QTL specific to bark texture were highly reproducible in shared intervals across sites, years and replicates. Significant positive correlations and co-localization between traits QTL suggest pleiotropic regulators or closely linked genes. A list of candidate genes with related putative function, location close to QTL maxima and with the highest expression level in the phloem, xylem and cambium was identified. Candidate genes for bark texture included an ortholog of Arabidopsis ANAC104
(PopNAC128), which plays a role in lignified fiber cell and ray development, as well as Pinin and Fasciclin (PopFLA) genes with a role in cell adhesion, cell shape and
migration. The results presented in this study provide a basis for future genomic characterization of genes found within the QTL for bark texture, bark thickness and diameter in order to better understand stem and bark development in Populus and other woody perennial plants. The QTL mapping approach identified a list of prime candidate genes for further validation using functional genomics or forward genetics approaches.
1The material contained in this chapter was previously published in BMC Plant Biology (Bdeir et al, 2017).
17
Introduction
Bark, the outermost surface of stems and branches in woody plants, encompasses all tissues outside the vascular cambium and includes the secondary phloem, secondary cortex and the periderm [1, 2]. Bark’s outer layer, or phellem, is composed of mostly dead tissues that form a protective barrier between plant and the abiotic and biotic environment, while the inner layer, or phloem, serves as a conduit for transport and storage of photosynthate [1, 2]. Despite its important roles including photosynthate transport [3], photosynthesis [4, 5], storage [6], mechanical support [7] and protection [8-11], the molecular basis of bark formation remains poorly understood (for reviews see: [12, 13]).
Bark texture varies among species, and even among genotypes within species, and has notable phenotypic diversity ranging from smooth, peeling, fractured, fissured to plated [14]. Within genera, bark texture differs between related species, e.g., in mature Populus trichocarpa (Torr. & Gray), bark is smooth or lightly flaky, while in P. deltoides (Bartr. ex Marsh), bark is rough and highly furrowed [15]. Bark’s high morphological diversity suggests that variation in texture may be an important component of variation in plant ecological strategies. It has been reported that in ash and beech smooth bark
genotypes are less susceptible to insect and fungal diseases [16, 17]. In addition, bark thickness and moisture content are correlated with enhanced fire resistance [9, 18, 19] and in cork oak the phellem is also the basis of the cork manufacturing industry [20]. Despite the biological, ecological and industrial value of bark, the genetic basis of bark’s features remains undefined.
To further understand the variation in bark texture, we need a better
understanding of outer bark development. The outer bark includes all tissues formed by the phellogen, consisting of dead hollow cork cells [1, 2], and originating from the outermost layer of the secondary phloem [2]. Romero [21] has proposed that
discontinuous periderms may be the result of variation in radial meristematic activity in the phellogen in apparent response to the mechanical stresses imposed by radial growth, whereas, smooth textured barks may be derived from the formation of a single periderm and continuous shedding of phellem. However, since most plant species develop several periderms over the course of time, smooth bark scales can develop from preceding
18
periderms from beneath the stem surface while uneven thick and thin layers result in the bark splitting, and in a peeling bark appearance [21]. Finally, Romero [21] also suggests that scaly and fissured bark develops when bark growth is discontinued and overlapping layers of periderms are formed. While these descriptions provide indications on how bark texture can vary, there remains a lack of understanding of phellem development at the molecular level. Additionally, variation in radial meristematic activity in the cambium may affect both diameter growth and bark texture as result of mechanical stresses. Especially Lateral Organ Boundaries (LBD) genes were found to be important regulators of woody perennial growth in poplar [22]. Specifically, the two LBD genes, PtaLBD1 and PtaLBD4 are expressed at the cambium/phloem boundary and are involved in ray cell and secondary phloem development. Two other LBD genes, PtaLBD15 and
PtaLBD18, are expressed at the cambium/xylem boundary and are involved in secondary xylem development.
Quantitative Trait Locus (QTL) mapping in segregating populations is a powerful tool to 1) uncover genes underlying naturally occurring phenotypic variation and 2) dissect the genetic basis of phenotypic traits [23]. QTL-based approaches have often been implemented to study the complex genetic architecture underlying wood formation, including lignin, diameter, height, biomass and various wood chemistry traits [24-31]. However, only a few studies have explored bark features and are limited to bark
thickness in Eucalyptus globulus [32], Pinus hybrids [33] and Boehmerianivea [34]. In Populus,QTL mapping and gene expression analyses were used to link sequence polymorphisms and variation in transcript levels [35-37].
Thus, in this study, we investigate bark texture, bark thickness and diameter variation in the pseudo-backcross Family 52-124 derived from a cross between a P. trichocarpa x P. deltoides hybrid and P. deltoides [25, 38]. Novaes et al. [25] performed a QTL mapping study in the same mapping pedigree for 20 biomass and wood chemistry traits (including stem diameter) under different nitrogen treatments and identified a total of 63 QTL distributed across 14 chromosomes. In the present study, QTL mapping was done using a genetic map with high marker density anchored to the P. trichocarpa whole-genome assembly [39], which allowed us to determine the map position of QTL and identify underlying candidate genes. Specifically, we performed QTL analyses for bark
19
texture, bark thickness and stem diameter and report results across three years and two geographic locations. These three traits have been chosen since we suspect an inter-connection between their development. Specific objectives were to: 1) identify positional candidate genes that underlie QTL for bark texture, bark thickness and diameter growth and 2) test reproducibility and consistency of QTL across years and environments. Materials and methods
Mapping population
An interspecific hybrid poplar pseudo-backcross pedigree (Family 52-124) composed of 396 genotypes was created by crossing the hybrid female clone 52-225 (TD), an F1 hybrid derived from P. trichocarpa (TT, clone 93-968) × P. deltoides (DD, clone ILL-101), with P. deltoides (DD, clone D124) (Fig. S1a) [25]. The F1 hybrid, clone 52-225, had smooth bark and was crossed with P. deltoides clone D124 with rough bark. The mapping population was planted at Boardman, OR (45°50'8"N, 119°33'48"W) in 2010 with two replicates of 396 genotypes in a three-block replication for a total of six ramets per cloned genotype (Fig. S1b). The same pedigree was planted in Morgantown, WV (39°39′32″N 79°54′19″W), in 2006 with four replicates of the 396 genotypes used in this study.
Plant material and construction of genetic linkage map
We used the genetic map of the mapping family 52-124 comprised of 3,568 SNP markers with known genomic positions for QTL identification. SNP genotyping, marker curation and genetic map construction were previously described by Muchero et al. [31]. Phenotypic measurements
Phenotypic data for bark texture (BT), bark thickness (BTh) and diameter at breast height (D) for all 396 full-sibs were analyzed in this study. Specifically, for the Oregon site (OR), bark texture data were collected in year 3, 4 and 5 by visual inspection, whereas diameter and bark thickness data were collected only in year 3 by using diameter tape and a bark thickness gauge on two opposites sides of the stem. For the West Virginia site (WV), bark texture data were collected in year 4 and 6 by visual inspection; diameter
20
and bark thickness traits were collected only for year 4 using a caliper and ruler. Bark texture was assigned a qualitative score based on a scale from 1 (smooth) to 4 (furrowed with deep grooves) (Fig. 1). Especially, the replicated multi-year measurements allowed for a reliable identification of QTL in Boardman, Oregon. Some QTL in Morgantown, Virginia, could have remained undetected as result of the lower number of replicates and years.
Pair-wise phenotypic correlations were calculated as Pearson correlation coefficients for all three traits across the two different geographic regions and the three years using WinSTAT software [40] to assess covariance within blocks, and within and between years (Table S1). To assess variation within blocks, the two replicates for each of three blocks, named as 1a, 1b, 2a, 2b, 3a & 3b, respectively, were analyzed at the OR site in year 3. In year 4 and 5, only block 1 and 2 were measured.
QTL analysis
The data were evaluated for the presence of outliers and recording errors were corrected or deleted. WinSTAT [40] was used to check for normal distribution of
residuals. Transformations were deemed unnecessary (Fig. S2). The traits were analyzed with the interval mapping method implemented in MapQTL6 [41] to map putative and suggestive QTL intervals on the genetic linkage map and to test for reproducibility across years and environments. Composite interval mapping with the Multiple-QTL Model (MQM) method was then used to further refine the QTL regions. Markers closely linked to a putative QTL were selected as cofactors and the selected markers were used as genetic background controls in subsequent MQM mapping. We selected additional cofactors until no additional QTL was detected. Mean phenotypic values across the two replicates per site were analyzed separately for each of the three blocks across three years for the OR site and across two years for the WV site. The putative QTL were subjected to 1,000 genome-wide (GW) and chromosome-wide (CW) permutation tests [42] to
determine LOD significance thresholds at the 0.05 significance level (Table S2). A putative QTL was declared when it was detected in at least two replicates or in one replicate in different years or sites, with at least one of those instances exceeding the chromosome-wide LOD threshold. To account for minor deviations from normality in
21
some cases, we also performed the non-parametric Kruskal-Wallis test which is the equivalent to the one-way analysis of variance [43].
Candidate genes
Genes underlying genome-anchored QTL intervals (Table S3, S4) were identified from the Populus genome assembly V3.0 [44] in the Phytozome database via BioMart tool (https://phytozome.jgi.doe.gov). A complete gene list with InterPro descriptions was collected including both putative and unknown functions. Expression profiles of the gene models from various tissues: bud, leaf, various parts of root and stem (expression
FPKM), were downloaded from the publicly available PhytoMine database (https://phytozome.jgi.doe.gov/phytomine/begin.do). The Affymetrix microarray expression raw date profiles for the traits bark and mature phloem, developing phloem, cambium, developing cambium and mature cambium were obtained from the NCBI, GEO database (https://www.ncbi.nlm.nih.gov/geo/, GEO accession number GSE30507) [45]. The raw data were normalized using the RMA algorithm [46] and further analyzed statistically using TM4:MeV software [47, 48], utilizing Affymetrix probe annotation [49].
The genes’ expression in developing and mature phloem/xylem and cambium was then assessed for each QTL interval for all traits based on publicly available data. For each QTL cluster, genes in the map interval with the highest LOD score and high expression in phloem, cambium and xylem tissues (above the 90th percentile) were compiled in a list (Table S5).
Position of LBD genes
The position of the Lateral Organ Boundaries Domain (LBD) genes with putative role in bark development and diameter growth were identified by using the BLAST tool in the Populus genome assembly V3.0 in the Phytozome (https://phytozome.jgi.doe.gov/) database against well-established Arabidopsis thaliana LBD genes.
22
Results
Analysis of phenotypic correlations among traits and trait frequency distributions Bark phenotypes ranged from smooth (1) to deeply furrowed bark (4) (Fig. 1). Shallowly fissured bark typical for P. trichocarpa was not found in this backcross pedigree (P. deltoides x P. trichocarpa hybrid backcrossed with P. deltoides). The interspecific crossing parent, P. trichocarpa (clone 93-968) x P. deltoides (clone ILL-101), had relatively smooth bark (mean value: 1.33, SD: 0.47). The other crossing parent, P. deltoides clone D124, had a rough bark texture (mean: 2.66, SD: 0.47). The
grandparent P. deltoides (DD, clone ILL-101) had a slightly furrowed bark texture while grandparent P. trichocarpa (TT, clone 93-968) had smooth and slightly fissured bark (field observations on adult trees, no genotypes and measurements available in the field trials). Bark texture showed the highest correlation within blocks (r=0.91 to 0.93, p<0.0001). The phenotypic correlations at the OR site within the same year for bark texture ranged from r=0.58 to 0.76; for diameter, r=0.38 to 0.45 and for bark thickness, r=0.40 to 0.56, all at p<0.0001 (Table S1). Comparing mean values of traits among years, bark texture values were significantly correlated among years at the OR site (r=0.51 to 0.77, p<0.0001). The correlations were weaker for the WV site, but still highly significant (r=0.39, p<0.0001). Finally, at year 3, bark thickness showed a strong positive correlation with both bark texture (r=0.32 to 0.69, mean value r=0.49, p<0.0001) and diameter (r=0.17 to 0.75, mean value r=0.43, p<0.0001) within the OR site (Table S1, blue and green sections), however, bark texture and diameter showed inconsistency in correlation values and significance ranging from r=0.15 (p<0.05) to r=0.47 (p<0.0001) (Table S1, red section). Overall, traits showed high correlations among replicates and years, and traits were correlated with each other. Across site correlations were only significant for bark texture ranging from r=0.25 to 0.40 (p<0.01-0.0001).
QTL analysis and detection across contrasting environments
Seven major QTL clusters were detected for bark texture on seven individual chromosomes I, II, VI, VIII, XIII and XVIII (Table S2), with all clusters containing at least three individual QTL above the GW threshold. For diameter, three QTL clusters with significance above the GW threshold were detected on chromosome I, VI and
23
XVIII; in addition, two suggestive QTL above the CW threshold were detected on chromosome VIII and XII (Table S2). Bark thickness showed three QTL clusters above the GW threshold on chromosome I, VI and XVIII, and four QTL above the CW
threshold on chromosome II, VIII and XII (Table S2). Chromosome VIII likely contains two separate QTL since they map to distinct chromosomal positions. All 94 individual QTL detected for the three traits across various chromosomes were successfully anchored to the Populus genome assembly (Fig. 2; Table S2). For the seven bark texture QTL clusters, the percentage of phenotypic variance explained (PVE) ranged from 3.6 to 12.8% for QTL above the GW threshold, while for diameter and bark thickness, it ranged from 5.4 to 8.4% and 4.5 to 9.6%, respectively (Table S2). For QTL on chromosome II, VI, VIII and XII the deltoides genotype DD was associated with the lower value for bark texture (Table S2), while for QTL on chromosome I, XIII and XVIII the DT genotype was associated with a lower value for bark texture.
Figure 3 shows a graphical outline of LOD score profiles for bark texture QTL versus map location across all seven chromosomes before (left) and after cofactor
selection (right). The QTL for bark thickness and diameter, described above, overlap with six out of the seven bark texture QTL clusters using the interval mapping approach (Fig. 2). Specifically, QTL for bark texture overlap with diameter and bark thickness QTL on chromosome I, VI and XII, and solely with bark thickness QTL on chromosome II, VIII and XVII (Fig. 2). Overall, reproducibility and co-location within the same map interval are observed across experimental replicates within sites and years and in some cases across sites.
Description of QTL clusters
Based on significance, consistency and reproducibility of the QTL across sites, years and replicates, specifically for bark texture, we classified the QTL clusters according to four criteria: 1) significance (LOD scores), 2) reproducibility across biological replicates, 3) reproducibility over time (years) and 4) reproducibility across environments (sites). All seven QTL clusters were significant with at least three individual QTL having LOD scores above the GW threshold and were reproducible across blocks (biological replicates) within the same year and across two years for the OR
24
site. Four QTL clusters on chromosome I, II, VIII and XIII, were reproducible between sites across very different environments. In each QTL cluster most of the QTL were associated with bark texture. Below we provide a detailed description of all seven bark texture QTL clusters ranked according to the four criteria and their association with bark texture, bark thickness and diameter.
QTL cluster on chromosome I was associated with all three traits (Fig. 2). For diameter four out the five QTL were significant at the GW threshold and for bark thickness three out of the four QTL were above the GW threshold (Table S2). For bark texture, twelve QTL were detected across all replicates and years in both OR and WV and ranged from 101 to 192 cM (before cofactor selection) with highly reproducible LOD maxima after cofactor selection consistently around 165 cM (Table S2; Fig. 3a). For the OR site, seven out of the ten QTL in this cluster were above the GW threshold all being detected in years 3 and 5; whereas at the WV site, the two QTL for both years were above the CW threshold. All twelve individual QTL mapped reproducibly to the same map interval and LOD maxima positions at the GW threshold were typically associated with no more than three markers in close proximity, around 3 cM (Fig. 3a). Notably, the results showed consistency and high reproducibility, first between blocks within
individual years, second within the same site, and third across sites. Overlapping QTL intervals and maxima with high significance across all years are presented in Table S2 and in Figures 2, 3.
The second bark texture QTL cluster was detected across all replicates and years in OR, and in year 4 in WV, and was mapped on chromosome VIII within the
chromosomal region 48 to 104 cM before cofactor selection with varied LOD maxima positions after cofactor selection (~50 cM, ~65 cM or 74 cM) (Table S2; Fig. 3a). When comparing this cluster with other traits, one overlapping QTL for bark thickness
(significant at the CW level), peaking at 67 cM was detected. For the OR site, six of the ten QTL for bark texture in this cluster were significant above the GW threshold; whereas at the WV site, only one QTL was found above the CW threshold. All eleven individual QTL within this cluster mapped reproducibly within the same map interval, however positions of QTL maxima varied for the OR site (Fig. 3a). The overall reproducibility
25
within the OR site, across both sites and across all years, was high and QTL were found within the same chromosomal region covering 25 cM.
The third bark texture QTL cluster mapped on chromosome XIII and was detected across all years and replicates in OR, and in year 4 in WV, within the chromosomal region 83 to 118 cM before cofactor selection and reproducible LOD maxima after cofactor selection was found around 108 cM (Table S2; Fig. 3a), which interestingly co-located with the Lateral Organ Boundaries Domain gene LBD15c (Potri.013G156200), a candidate gene for xylem development [22]. No QTL for bark thickness or diameter were found in this QTL interval. For the OR site, seven out of the nine QTL in this cluster were significant above the GW threshold across all years; whereas at the WV site, only one QTL was detected and found above the GW threshold. All ten individual QTL mapped reproducibly within the same map interval and positions of QTL maxima were typically associated with no more than four markers in close proximity covering a map interval around 5 cM (Fig. 3a). The results showed overall consistency and
reproducibility between block replicates within individual years, within the OR site and across the two sites and across most years (Table S2, Fig. 3a).
The fourth bark texture QTL cluster on chromosome II was detected in both OR and WV, across all years and replicates for both sites, within a chromosomal interval from 0 to 70 cM (before cofactor selection) but displayed inconsistent and variable LOD maxima after cofactor selection (Table S2; Fig. 3b). When comparing this cluster with bark thickness and diameter, one overlapping QTL for bark thickness (significant at the CW threshold), peaking at 0 cM, was found. Eight out of the ten individual bark texture QTL were significant above the GW threshold, indicating reproducibility within
replicates and sites, between sites and across years. However, after cofactor selection, the LOD maxima greatly varied even within replicates of the same year.
The fifth bark texture QTL cluster was detected on chromosome VI in OR in years 3 and 5 only, within a chromosomal interval from 135-204 cM (before cofactor selection) and had LOD maxima after cofactor selection between 153-162 cM (Table S2; Fig. 3b). Several overlapping QTL, four for diameter (two GW QTL) and two GW QTL for bark thickness, were found within the same chromosomal interval, however the LOD maxima varied among traits after cofactor selection. Six out of the seven individual QTL
26
for bark texture were above the GW threshold, indicating reproducibility within replicates at the OR site and across the two years. However, the results were not consistent across the two sites, as no QTL was detected at the WV site. Only three out of the nine
individual QTL were found significant above the GW threshold, while others were significant at the CW threshold.
The sixth bark texture QTL cluster mapped on chromosome XII and was detected across all years and replicates in OR within the chromosomal interval from 62-113 cM before cofactor selection and consistent LOD maxima between 98-104 cM were detected after cofactor selection at the OR site (Table S2; Fig. 3b). Two individual QTL, one for bark thickness (CW QTL) and one for diameter (CW), were partially overlapping with bark texture QTL, but had LOD maxima separate from the LOD maxima for bark texture. Out of the nine individual QTL, only three were above the GW threshold. The results are reproducible between replicates and within and across the three years in OR. Though no significant QTL were detected in WV, the QTL graph shows a suggestive QTL with increasing LOD score near the same chromosomal interval noted above (Fig. 3b), though still below the CW threshold.
Finally, the seventh bark texture QTL cluster, mapped on chromosome XVIII within the chromosomal interval from 13-35 cM, before cofactor selection, with
reproducible LOD maxima at 30 cM after cofactor selection, detected in year 3 and 5 at the OR site (Table S2 and Fig. 3b). A QTL cluster for bark thickness closely overlapped with the same chromosomal interval with LOD maxima further upstream. Four separate QTL for diameter were detected on the same chromosome (two above the GW threshold). In year 5, three out of the seven bark texture QTL were above the GW threshold. The QTL were only reproducible across year 3 and 5 at the OR site, although a suggestive QTL was found for WV (Fig. 3b).
The Kruskal-Wallis rank sum test was subsequently used to confirm significant associations of individual markers linked to the QTL. For all traits, the markers
underlying the QTL interval were also significantly associated with the traits (p<0.005). The Kruskal-Wallis test provides further confirmation of the marker-trait association, indicating that the results of the QTL analysis were not influenced by segregation distortion or non-normal distribution of certain traits.
27 Candidate gene identification and characterization
To narrow the QTL position and identify candidate genes within the QTL interval MQM mapping was used. Intervals spanning the genomic regions (physical location by MQM mapping) summarized in Table S2 were used to identify all genes occurring within the seven QTL clusters for bark texture and for the QTL clusters that were associated with bark texture, diameter and bark thickness. The number of genes for each trait in QTL clusters based on MQM mapping with cofactor selection is summarized in Table S3. There were 1869 genes within genome-anchored QTL intervals for bark texture, out of which, 1476 (82%) had annotations based on the InterPro domain and expression profiles (average FPKM) for 22 different tissues and based on Affymetrix microarray expression data for bark and woody tissues (phloem, cambium and xylem), whereas a total of 693 and 789 genes were detected in QTL clusters for diameter and bark thickness, respectively (Table S4).
QTL for all three traits overlap in QTL cluster on chromosome I, where the diameter QTL included 25 genes and the bark thickness QTL encompassed 115 genes. Two additional QTL clusters on chromosome VI and XII were associated with all three traits where diameter and bark thickness QTL had 369 and 209 overlapping genes on chromosome VI and 29 and 14 overlapping genes on chromosome XII, respectively. QTL clusters for bark texture on chromosome II, VIII and XVIII overlapped with bark
thickness QTL only, containing 963, 23 and 38 overlapping genes, respectively (Fig. 2, Table S4). As a result of the Salicoid duplication event in the Populus genome, nearly every chromosome has a paralogous segment elsewhere in the genome; this is due to the whole-genome duplication between chromosomes resulting in homologous genomic blocks [50]. Each of the seven chromosomes noted above has a Salicoid paralog, yet none of these duplicated genes in paralogous segments co-located with other QTL for the same trait.
Top expressional candidate genes (above the 90th percentile) for mature and developing phloem, cambium, developing xylem and mature xylem in QTL intervals with the highest LOD scores resulted in a compiled list of the top candidate genes for each trait (Table S5). In total, the top candidate genes with putative function in the
28
control of bark texture, diameter and bark thickness are narrowed down to 40, 20 and 46 genes spanning various QTL clusters (Table S5).
Discussion
We have characterized segregating bark features in an interspecific backcross of Populus. With the use of QTL mapping, we are able to link the phenotypic traits to their associated polymorphisms in the genome, thus integrating phenotypic and genotypic data to identify putative genetic mechanisms related to phellem development.
While other studies have identified QTL in interspecific P. trichocarpa and P. deltoides families for many different traits, including leaf size and shape, growth and bud set, diameter, height, stem and root biomass and various wood chemistry phenotypes [25, 35, 51-54], little research has been done on bark features [55-57], despite bark being one of the key-energy-related characteristics of lignocellulosic feedstock [58-60].
We identified several QTL that encompassed both bark traits and stem diameter and found that these intervals mapped consistently across geographic locations, replicates within sites and across years. Interestingly, one study, using the same pedigree, reported several overlapping QTL with our traits [25]. Specifically, bark texture QTL in our study overlapped on chromosome I, II and XVIII with QTL associated with total biomass, C5 and C6 sugars, and height. Additionally, diameter and bark thickness QTL overlapped on chromosome VIII, XII and XVIII with QTL for diameter and biomass traits [25]. It is difficult to determine if there are genes that have pleiotropic effects or whether there are alternate genes within the co-located intervals because of the large size of the interval and lack of expression evidence in the Novaes et al. [25] study.
While a few studies have analyzed bark thickness, e.g., Eucalyptus globulus, Pinus hybrids and Boehmerianivea [32-34], the genetic basis and causal loci of bark thickness and/or bark texture have not yet been determined. In Boehmerianivea, a perennial herbaceous plant belonging to the Urticaceae Family, several QTL for bark thickness have been mapped and some were identified in the same QTL intervals across two contrasting environments in Changsha, China at varying time throughout the year [34].
29
Bdeir et al. (2016) and Yordanov et al. (2010) previously identified genes with a role in bark development [61, 22]. Based on the generation of loss-of-function
phenotypes through transgenic plants, Lateral Organ Boundaries Domain (LBD) genes were found to have a crucial role in meristem maintenance and were identified as important regulators of woody perennial growth in poplar, specifically in Populus tremula x Populus alba (Pta). The overexpression of PtaLBD1 resulted in wide
multiseriate rays as compared to uniseriate rays in the wild type [22]. In the regulation of secondary (woody) growth, two genes of the LBD Family (PtaLBD1 and PtaLBD4) were involved in secondary phloem and ray cell development and two genes (PtaLBD15 and PtaLBD18) in secondary xylem formation. Interestingly, one of the PtLBD15 paralogs (Potri.013G156200, total expression 36.30), previously found to have a role in secondary growth, was found in the QTL cluster on chromosome XIII for bark texture with the highest LOD score. In this chromosome region seven out of a total of 10 QTL detected were above the genome-wide threshold (Fig. 2). PtaLBD1 (Potri.008G043900) was detected in the diameter QTL cluster on chromosome VIII with a LOD score of 2.27. Both PtaLBD15 and PtaLBD1 are involved in secondary growth in poplar and are potential candidate genes for diameter growth and bark characteristics. PtaLBD15 was found in Populustremula x P.alba to be mainly expressed at the cambium/xylem boundary and thus is likely involved in secondary xylem development. PtaLBD1 was found to regulate secondary phloem and ray development and was highly expressed in the phloem and cambial zone [22]. Therefore, their apparent involvement in secondary growth and development in poplar and their detection in QTL clusters for diameter and bark texture make them candidate genes for these traits. Finally, PtaLBD12
(Potri.008G072800, total expression 26.06) was detected in the QTL cluster on
chromosome VIII and overlapped with diameter and bark thickness QTL. PtaLBD12 has been reported to be involved in the development of various lateral organs from the meristem in Arabidopsis plants, but its role in secondary growth is unknown [62].
We were able to identify a list of candidate genes underlying the QTL intervals of all three traits using genetic markers anchored to the Populustrichocarpa genome. Generally, QTL were highly reproducible among biological replicates and years and even across geographic locations. While some QTL studies obtained good reproducibility
30
across two different time data set [33, 34, 63], our study has identified significant QTL consistently co-locating across sites, years and replicates especially for bark texture. For instance, QTL in clusters on chromosome I, VIII, XII, XIII and XVIII were consistently identified within ~25 cM.
When comparing all the aspects of the seven bark texture QTL clusters, including significance, reproducibility across replicates, years and sites, along with consistency of the QTL, major QTL were identified on chromosome I, VIII and XIII, where QTL maxima were found within a 5-20 cM interval across most replicates, years and at both sites. Given the environmental contrast between the OR and WV experimental sites, four out of the seven QTL clusters, representing a total of 47 individual QTL, detected for bark texture were remarkably consistent across both sites. Differences in reproducibility for QTL clusters across sites suggest differential environmental effects on gene
expression. In comparison to bark texture, QTL clusters for bark thickness and diameter had lower reproducibility across sites.
In QTL clusters on chromosome I, VI and XII, QTL for bark texture, bark thickness and diameter were syntenic. Co-location of QTL for traits can be the result of pleiotropic effects or closely linked genes. These overlapping QTL could be an
explanation of different aspects of bark texture and radial growth. Romero [21] proposed that rough bark results in response to the mechanical stresses imposed by a varied radial growth and due to different meristematic activity in the phellogen, a discontinuous periderm. Strong correlation between bark texture and diameter could indicate that bark texture is partly related to diameter growth. Using interval mapping without cofactor selection, QTL for bark texture overlap with QTL for both traits which are related to radial growth (diameter and bark thickness) on three chromosomes (I, VI, XII) and solely with bark thickness on three other chromosomes (II, VIII, XVII). Furthermore, using MQM mapping, QTL for these traits were mapped to different neighboring positions of the same chromosomes (Fig. 2). Consequently, bark texture seems to be only partly related to diameter growth, and other factors such as meristematic activity of the phellogen and cell adhesion are likely to have major effects on bark texture. A higher mapping resolution as obtained in linkage disequilibrium mapping in natural population
31
samples is needed to narrow down the QTL region to individual genes and to distinguish between pleiotropic effects and close linkage.
Bark features in our study ranged from smooth to deeply furrowed which is characteristic for P. deltoides. Variation in shallowly fissured bark which is characteristic for P. trichocarpa was not observed among the segregating progeny. Thus, the QTL identified in this progeny set only represent a subset of a larger number of
polymorphisms affecting the traits. And in a pseudo-backcross involving multiple P. deltoides parents, polymorphisms associated with characteristic bark features of P. trichocarpa seem to be largely undetected. Association populations for P. trichocarpa will be used to find additional candidate genes associated with bark texture in this species.
Each of the seven QTL clusters detected have a Salicoid paralog, and yet none of these paralogous genes showed up in the QTL analyses as significant. This further
supports that the identified chromosomal regions are not artifacts of spurious correlations. Due to large genomic intervals in QTL clusters with partly overlapping QTL intervals the identification of specific candidate genes was difficult. This limitation was evident in our analyses where only two out of the seven QTL clusters on chromosome XIII and XVIII, encompassed less than 70 candidate genes, while the other clusters included from 123 to 963 candidate genes. Nonetheless, several candidate genes within the QTL interval can be identified based on their putative functions. Using the MQM method, we were able to identify informative loci for bark texture and narrow the QTL region to a small
chromosomal region with a short and manageable candidate gene list. For example, a total of 11 NAC genes were detected in bark texture QTL clusters one, five, one, three and one paralogs found on chromosome I, II, VI, VIII and XII, respectively. Specifically, the gene PopNAC128 (Potri.001G206900) is a prime candidate gene and was identified in the QTL interval on LG I within the QTL maxima (LOD score 9.88) and with a moderate expression value. PopNAC128 is one of the orthologs of Arabidopsis
ANAC104 (Arabidopsis Nac Domain Containing Protein 104) and XND1 (Xylem NAC Domain 1). In a related study, Populus and Arabidopsis transgenic plants with
overexpression of these genes resulted in severe dwarfing, lacking phloem fibers and a reduction in stem diameter, cell size and number, vessel number, and frequency of rays in
32
the xylem [64]. While this study did not focus on bark texture, lack of sufficient lignified fiber cells in the mutant affects the development of fiber bundles and ultimately bark texture as result of slowed secondary phloem development.
Another interesting gene, Potri.001G206700, an ortholog of AT4G33430 (BAK1, Bri1-Associated Receptor Kinase; ELONGATED; SERK3), is involved in patterning and growth regulation [65-67] and was found in the QTL interval on chromosome I, also within the QTL maxima (LOD score 9.88) and with a very high expression value above the 90th expression percentile across phloem/xylem and cambium tissues.
Variation in bark texture could be related to cell adhesion, which is essential to form a single periderm resulting in smooth bark, while lack of cell-cell adhesion leads to the development of uneven and discontinued bark or bark splitting causes a peeling and fissured bark appearance [21]. At the molecular level, several QTL and expressional candidate genes with high expression in phloem/ xylem and cambium identified in this study have a role in cell adhesion, including Pinin (Potri.001G208200) and PopFLA or Fasciclin-Like Arabinogalactan (Potri.013G151300, Potri.013G151400 and
Potri.013G151500). Interestingly, both genes fall within the QTL interval with the highest LOD scores and are above the 90th gene expression percentile for both xylem and phloem tissues. Many of the studies on Pinin, mainly on animal epithelial cells, revealed a vital role in cell-cell adhesion and cell shape [68, 69]. No studies exploring the Pinin gene in plants were found. The FLA gene is better studied across the plant kingdom, including Arabidopsis and Populus, and shows specific and high expression during the onset of secondary-wall cellulose synthesis, particularly in stem cells undergoing secondary-wall deposition [70, 71]. Transgenic lines indicate a role in cell-wall
architecture and composition. Specifically for PopFLA, a role in tension wood formation in the xylem of mature stems was suggested based on a reduction in transcript levels leading to reduced stem flexural strength by modulation of cellulose and lignin composition in the xylem [70, 72, 73].
Future work
The top QTL and expressional genes reveal additional potential candidates (Table S5), some of which are proteins of unknown or putative function and have never been
33
studied. These genes represent potential candidate genes for future studies using either functional genomics or forward genetics techniques. Candidate genes within QTL intervals were identified based on Affymetrix Microarray expression profiles obtained from public databases. In the future, qRT-PCR confirmation of candidate genes’ expression profiles should be performed in various tissues (phloem, cambium, xylem, phellogen) of the parental clones and part of the mapping pedigree.
Conclusion
In conclusion, the results presented in this study provide a basis for future
genomic characterization of genes found within the QTL for bark texture, bark thickness and diameter in order to better understand stem and bark development in Populus and other woody perennial plants. Additionally, profiling the expression of the candidate genes (eQTL studies) in the developing bark of the mapping pedigree would allow parsing the list of candidate genes into those genes with high expression profiles in the tissue of interest. Bark texture is a complex trait which can be affected by differences in cell adhesion and radial meristematic growth. In the future, developmental differences between bark texture phenotypes should be analyzed in anatomical sections in
34
References
1. Carlquist S: Wood, bark, and stem anatomy of Gnetales: a summary.
International Journal of Plant Sciences 1996, 157:S58-S76.
2. Srivastava LM: Anatomy, chemistry and physiology of bark.International Review of Forestry Research 1964, 1:203-277.
3. Jensen KH, Liesche J, Bohr T, Schulz A: Universality of phloem transport in seed plants.Plant Cell Environ 2012, 35(6):1065-1076.
4. Cernusak LA, Hutley LB, Beringer J, Holtum JA, Turner BL: Photosynthetic physiology of eucalypts along a sub-continental rainfall gradient in northern Australia.Agricultural and Forest Meteorology 2011, 151(11):1462-1470. 5. Pfanz H, Aschan G, Langenfeld-Heyser R, Wittmann C, Loose M: Ecology and
ecophysiology of tree stems: corticular and wood photosynthesis.
Naturwissenschaften 2002, 89(4):147-162.
6. Scholz FG, Bucci SJ, Goldstein G, Meinzer FC, Franco AC, Miralles-Wilhelm F: Biophysical properties and functional significance of stem water storage tissues in Neotropical savanna trees.Plant, Cell & Environment 2007, 30(2):236-248.
7. Niklas KJ: The mechanical role of bark.American Journal of Botany 1999, 86(4):465-469.
8. Gill A, Ashton D: The role of bark type in relative tolerance to fire of three central Victorian eucalypts.Australian Journal of Botany 1968, 16(3):491-498. 9. Lawes MJ, Adie H, Russell-Smith J, Murphy B, Midgley JJ: How do small
savanna trees avoid stem mortality by fire? The roles of stem diameter, height and bark thickness.Ecosphere 2011, 2(4):1-13.
10. Romero C, Bolker BM: Effects of stem anatomical and structural traits on responses to stem damage: an experimental study in the Bolivian. Amazon. Canadian Journal of Forest Research 2008, 38(3):611-618.
11. Romero C, Bolker BM, Edwards CE: Stem responses to damage: the evolutionary ecology of Quercus species in contrasting fire regimes.New Phytologist 2009, 182(1):261-271.
12. Fagard M, Höfte H, Vernhettes S: Cell wall mutants.Plant Physiology and Biochemistry 2000, 38(1):15-25.
13. Plomion C, Leprovost G, Stokes A: Wood formation in trees.Plant physiology 2001, 127(4):1513-1523.
14. Whitmore T: Studies in systematic bark morphology. . New Phytologist 1962, 61(2):191-207.
15. Dickmann DI: An overview of the genus Populus. In: Poplar culture in north America. NRC Research Press; 2001: 1-42.
16. Heyd RL: Managing beech bark disease in Michigan. In: Beech bark disease: proceedings of the beech bark disease symposium June 16–18, 2004; Saranac lake NY Gen Tech Rep NE: 2005.
17. Marshall JM, Smith EL, Mech R, Storer AJ: Estimates of Agrilus planipennis
infestation rates and potential survival of ash.The American Midland Naturalist 2013, 169(1):179-193.
35
18. Hengst GE, Dawson JO: Bark properties and fire resistance of selected tree species from the central hardwood region of North America.Canadian Journal of Forest Research 1994, 24(4):688-696.
19. Wang GG, Wangen SR: Does frequent burning affect longleaf pine (Pinus palustris) bark thickness?Canadian Journal of Forest Research 2011, 41(7):1562-1565.
20. Pereira H: Cork chemical variability. BioResources 2013, 8(2):2246-2256. 21. Romero C: Tree responses to stem damage. PhD thesis: University of Florida,
Gainesville, FL, USA; 2006.
22. Yordanov YS, Regan S, Busov V: Members of the LATERAL ORGAN BOUNDARIES DOMAIN transcription factor Family are involved in the regulation of secondary growth in Populus.The Plant Cell 2010, 22 (11):3662-3677.
23. Schadt EE, Monks SA, Drake TA, Lusis AJ, Che N, Colinayo V, Ruff TG, Milligan SB, Lamb JR, Cavet G: Genetics of gene expression surveyed in maize, mouse and man.Nature 2003, 422(6929):297-302.
24. Beaulieu J, Doerksen T, Boyle B, Clément S, Deslauriers M, Beauseigle S, Blais S, Poulin P-L, Lenz P, Caron S: Association genetics of wood physical traits in the conifer white spruce and relationships with gene expression.Genetics 2011, 188(1):197-214.
25. Kirst M, Myburg AA, De León JP, Kirst ME, Scott J, Sederoff R: Coordinated genetic regulation of growth and lignin revealed by quantitative trait locus analysis of cDNA microarray data in an interspecific backcross of
eucalyptus.Plant Physiology 2004, 135(4):2368-2378.
26. Novaes E, Osorio L, Drost DR, Miles BL, Boaventura‐Novaes CR, Benedict C, Dervinis C, Yu Q, Sykes R, Davis M: Quantitative genetic analysis of biomass and wood chemistry of Populus under different nitrogen levels.New
Phytologist 2009, 182(4):878-890.
27. Pot D, Rodrigues J-C, Rozenberg P, Chantre G, Tibbits J, Cahalan C, Pichavant F, Plomion C: QTLs and candidate genes for wood properties in maritime pine (Pinus pinaster Ait.).Tree Genetics & Genomes 2006, 2(1):10-24.
28. Thumma BR, Southerton SG, Bell JC, Owen JV, Henery ML, Moran GF: Quantitative trait locus (QTL) analysis of wood quality traits in Eucalyptus nitens.Tree Genetics & Genomes 2010, 6(2):305-317.
29. Wegrzyn JL, Eckert AJ, Choi M, Lee JM, Stanton BJ, Sykes R, Davis MF, Tsai CJ, Neale DB: Association genetics of traits controlling lignin and cellulose biosynthesis in black cottonwood (Populus trichocarpa, Salicaceae) secondary xylem.New Phytologist 2010, 188(2):515-532.
30. Muchero W, Sewell MM, Ranjan P, Gunter LE, Tschaplinski TJ, Yin T, Tuskan GA: Genome anchored QTLs for biomass productivity in hybrid Populus
grown under contrasting environments.PloS one 2013, 8(1):e54468. 31. Muchero W, Guo J, DiFazio SP, Chen J-G, Ranjan P, Slavov GT, Gunter LE,
Jawdy S, Bryan AC, Sykes R: High-resolution genetic mapping of allelic variants associated with cell wall chemistry in Populus.BMC genomics 2015, 16(1):24.