Distribution Inside Large Buildings
In large buildings the type of distribution depends on the building type, dimension, the length of supply cables, and the loads. The distribution system can be divided in to:
The vertical supply system (rising mains).
The horizontal supply (distribution at each floor level).
In most cases a high voltage supply and transformer substation is required. Normally HV switchgear and substation transformers are installed at ground floor ( or basement ).
However, often there are appliances with large power demand installed on the top floors (converters and motors for lifts, air-conditioning equipment and electric kitchens).
As it is desirable to brining the high voltage supply as close as possible to the load centers, transformers are installed at the top floor, or if required, additional ones are installed on one of the intermediate floors. In such cases transformers with non-inflammable insulation and cooling are used.
The arrangement of the rising mains depends on the size and shape of the building and suitable size of shafts for installing cables and bus ducts must be provided in coordination with the building architect.
The vertical supply system are implemented in several ways, some of which are :
Department of Electrical Engineering – Dr. Hussain Al-Mashat 2
Single Rising Main
Applications
:-Where high supply security is not important.
Advantages
:-a) The different loads of individual floors are balanced out. b) Only a small main L.V board is required.
c) Simple in construction and operation.
Disadvantages
Department of Electrical Engineering – Dr. Hussain Al-Mashat 4
Busway and Busduct Details
Busway and plug-in arrangement Details
Department of Electrical Engineering – Dr. Hussain Al-Mashat 6
Rising Mains Details
Grouped Supply
Applications
:-High rise building with high load concentration.
Advantages
:- Easier mounting.
Smaller size for rising mains.
Disadvantages
:- A fault in any rising mains effect several floors (relatively low security).
Loads are balanced only within each group.
Department of Electrical Engineering – Dr. Hussain Al-Mashat 8
Individual Floor Supply
Applications
:-In high rise buildings were stories are let separately (metering is at central point at ground floor).
Advantages
:-a) Smaller size of cables can be used (easy installation).
b) In the case of a fault in arising main, only one story is effected.
Disadvantages:-a) Different loading of the individual floors can not be balanced out. b) The rising main must be rated for the peak load of each floor.
c) Uneconomical – large number of cables and the size of the rising main shaft is quite large.
Fifth Floor Second Floor Third Floor Forth Floor First Floor Ground Floor MDB L&P SMDB L&P L&P L&P X
Typical Arrangement of an individual
Floor Supply System
Department of Electrical Engineering – Dr. Hussain Al-Mashat 10
Ring Main Supply
Applications
:-In large buildings when relatively higher security is required.
Advantages
:-a) Higher power supply security ( in the event of a fault, it is possible to switch off the faulty part and leave the majority of the building operational )
b) A small low voltage distribution board is required.
c) The differing loading of individual floor are balanced out ( smaller sizes for rising mains )
Double Feed Supply
Applications:-In large buildings with relatively large loads at the top floors (lifts, kitchen, air-conditioning).
Advantages
:-a) Higher power supply security.
b) The differing loading of individual floors are balanced out. c) Smaller L.V. distribution board required.
In practice all supply circuits presented above are used depending on the building type, size, load data, etc.
Department of Electrical & Electronic Eng. – Dr. Hussain Al-Mashat
Î
Constructional Details of 33/11 kV and 11/0.4 kV
Distribution Substations
The power supply to the city of Baghdad is provided basically from two main substations of 400/132 kV (Baghdad East and Baghdad west), which in turn supply many substations of 132/33 kV (or 132/33/11 kV) distributed geographically throughout the city. A schematic diagram showing the structure of this system is given in Fig.1. These 132/33 kV substations in turn provide power supply to a very large number of 33/11 kV substations as shown in Fig.2. Most of these 33/11 kV substations are equipped with two transformers of 31.5 MVA each (or 2x16 MVA) as shown in Fig.3. To the 11 kV busbars of these substations (which is divided into two sections) several 11 kV feeders (up to fourteen) are connected using underground cables and/or overhead line systems.
Each circuit branch is served by a draw-out circuit breaker mostly by using one of these types :
SF6 Circuit Breaker Vacuum Circuit breaker
Minimum-Oil Circuit Breaker
There are about 1150 feeders operating at 11 kV in the city Baghdad alone with a total length of 6845 km.
Equipment layout of a typical such substation is shown in Fig.4. Also equipment layout and some constructional details of these substations is shown in Fig.5.
Ï kV busbars and used to provide power supply to all substation axillaries. The substation axillaries include providing power supply to emergency lighting, airconditioning, various socket outlets, battery chargers, and all other control and monitoring equipment.
Each 11kV feeder provides the supply to large number of 11/0.4 kV distribution transformers installed using one of the following systems:
i. Pole-mounted transformers supplied directly from 11 kV overhead lines through manually operated fused switches. The transformer size in this system is mostly 250 kVA (in few cases in areas with low load density the 100 kVA size is used).
ii. Compact type unit substations installed usually at street pavements, in industrial, residential, and commercial areas. . These substations are provided with three compartments:
High Voltage Compartment
It is placed at one side of the substation, and has an independent access through a double-sided door with a specially designed lock. It has the capacity to hold up to three cubicles.
Transformer Compartment
This compartment occupies the middle of the substation and designed to accommodate standard transformers of sizes up to 630 kVA (in some cases up to 1000 kVA). The cover of this compartment is removable to enable transformer installation on site.
Low Voltage Compartments.
Department of Electrical & Electronic Eng. – Dr. Hussain Al-Mashat
Ð substation and it is provided with all required protective and control devices. To the low voltage busbars several outgoing 0.4 kV feeders are installed. Each low voltage feeder provides the power supply to various numbers of consumers. A single line diagram of a typical such substation is shown in Fig.6.
The compact type unit substations has the following advantages :
a) Reduction in civil engineering work (only a small excavation is required)
b) Can be easily transported by a truck due to its small size
c) Remarkable reduction in the installation cost (all internal connections are made at the factory)
d) Minimum space requirement
e) Adaptation to any application using different standard schemes. f) Designed for operation outdoors ( weatherproof )
g) High operation safety for both the operator and the equipment
h) Reduction in the maintenance cost as compared with open installations i) Special sandwich construction of walls prevent quick and direct
heating of equipment caused by direct sunshine conditions.
iii. Privately owned substations installed at consumer's premises in building basements or in conventional brick-wall rooms. Transformer sizes used in this case vary from 100 to 1000 kVA and in accordance with load size.
Department of Electrical & Electronic Eng. – Dr. Hussain Al-Mashat Ñ B A G H D A D E A S T 4 0 0 / 1 3 2 k V B A G H D A D W E S T 4 0 0 / 1 3 2 k V R a s h d i y a J a m e e l a T h a w r a M u t h a n n a F a r a b i N e w B a g . Q u s a i b a W a z i r iy a G a z a li B a g . S o u t h H u r r i y a J a m i a a Y a r m o o k T a g i J a z a i r D a u r a K a d i m i y a M a a r r y M a n s o o r J a d i r i y a 1 3 2 / 3 3 k V S u b s t a t i o n s S a r r a f i y a M e e d a n 1 3 2 / 3 3 k V S u b s t a t i o n s 1 3 2 k V 1 3 2 k V 1 3 2 / 3 3 k V S u b s t a t i o n s F i g . 1 B A G H D A D C I T Y P O W E R S U P P L Y S T R U C T U R E
Department of Electrical & Electronic Eng. – Dr. Hussain Al-Mashat !! Ò
x
132 kV 33 kV 11 kVx
132 kVx
132 kV 33 kV 11 kV X 11 kV X 11 kV X X 11 kV X 11 kV X 33/11 kV Transformers 33/11 kV TransformersFig.2. Power Supply Structure to 33/11 kV Substations from Main Satellite Substations
Ó
Department of Electrical & Electronic Eng. – Dr. Hussain Al-Mashat
Ô
Õ
Fig.5. Equipment Layout and Some Constructional Details of a Typical 33/11 kV Substation
Department of Electrical & Electronic Eng. – Dr. Hussain Al-Mashat Ö 630 500 500 630 100 Spare 100 500 180 kVAR PFC
Incoming Feeder Outgoing Feeder
1000 kVA 11/0.4 kV Transformer 11 kV Load break switches 11 kV Load break switch fitted with 80 A HRC Fuses
1600 A TP MCCB
A A A
V Cos
2000A TP&N Copper Busbars
1600/5A CT 11 Single core cables size 240 mm2each
(three cables per phase & two for neutral)
MCCB Circuit Size (A)
Two cables size (3x120+70) mm2+ E each
Lift Supply SMDB-G SMDB-1 SMDB-2 SMDB-3
Fig.6 Single Line Diagram of a Typical 11/0.4 kV Substation
Two cables size (3x185+95) mm2+ E each
Î Í Fig.7 Equipment Layout of a Typical 11/0.4 kV Compact Unit Substation
Department of Electrical & Electronic Eng. – Dr. Hussain Al-Mashat
Î Î
Fig.8 External View of a Privately Owned Substation
Emergency Generators
Emergency generators are used to provide critical loads with power supply in the case of mains failure (operating theaters & intensive care units in hospitals, computer buildings, etc…).
Emergency generators are usually driven by diesel engines, and connected to the load in the following way :
a) When the generator is of the same size as the power supply transformer.
b) When the generator is of a smaller size as compared with the power supply transformer
Single Line Diagram of Main and Emergency Supply Connections for Case a
Department of Electrical & Electronic Eng. – Dr. Hussain Al-Mashat
!! Ï
Single Line Diagram of Main and Emergency Supply Connections for Case b
Mains Failure panel ( MFP )
The MFP is intended for automatic operation (Start & Stop) of the
emergency generator and in coordination with the mains incoming
supply from the low voltage side of transformer.
The MFP shall be provided with
:-
Two interlocked 3-phase, 4 pole contactors for the
connections of mains and generator supply.
A set of HRC fuses for output load distribution.
All the necessary voltage sensing relays, time relays, control
switches, light indicator, alarms, etc…
The MFP must have the following features
:-
To provide the output load distribution with supply from
public mains when it is available.
To provide the output load distribution with supply from
generating set in the case of mains failure with adjustable time
delay (10 - 15) sec.
It should operate the generating set also when the mains
voltage falls in one or more phases below 80% of the standard
value (adjustable).
It should allow the generator to run up to the correct
frequency and voltage before operating the contactors.
When the public mains power returns to within acceptable
limits, the contactors should change over positions and the
Department of Electrical & Electronic Eng. – Dr. Hussain Al-Mashat
!! Ñ
generator stop and reset itself in readiness for further failure.
A built in time delay unit shall be provided to allow generator
running for a short period (adjustable) after mains have
returned to ensure power supply continuity, should further
mains failure or fluctuations occur.
It should have a duty selector switch with ON, OFF, and
TEST positions.
Uninterruptible Power Supply ( UPS )
The basic version of the UPS consists of a rectifier, inverter,
and batteries.
During normal operation, the inverter supplies the critical load
and ensures that the amplitude and frequency of the output voltage
are stable and precisely controlled.
The inverter receives its power from mains via the rectifire
which, at all times, float charges the batteries.
In the event of an interruption in the power supply, the batteries
takes over the task of supplying power to the inverter.
When the mains power has been restored, the rectifier resumes
input power to the inverter and automatically recharges the battery
Schematic Diagram of a Typical UPS Installation
125100 12560 10060 10030 10030 Rectifier Inverter Batteries Source 1 Source 2 M ai nt en an ce b yp as s sw itc h S ta tic b yp as s sw itc hDepartment of Electrical & Electronic Eng. – Dr. Hussain Al-Mashat
!! Ó
Case (1) : Mains Available ( Normal Operation )
The energy required by the load flow through the rectifier –
inverter chain.
The rectifier-charger also supplies a low current which is
sufficient to maintain the battery in a charged state (floating)
Case (2) : Mains Failed ( Emergency Operation )
When the mains voltage disappears, the battery bank
immediately supplies the load via the inverter.
During this period the battery voltage decreases (discharge
period).
Case (3) : Return of Mains
When the mains voltage returns, the rectifier-charger again feed the inverter ( and the load) and recharges the battery bank.
Department of Electrical & Electronic Eng. – Dr. Hussain Al-Mashat
!! Õ
Parallel Systems
The UPS system may comprise up to six similar parallel chains.
All chains are connected to the load and share it equally.
In the event of a failure in any one chain, its load is
immediately transferred to the remaining chains and it disconnect
itself from the load bus.
REACTIVE POWER CONTROL IN DISTRIBUTION NETWORKS
Introduction
The consumption of active power (kW), is always accompanied by the consumption of a certain amount of reactive power (kVAR) due to the existence of inductive circuit devices such as induction motors, transformers, induction furnaces, gas discharge lamps, and all other similar devices using magnetic field effects.
An increase in the consumption of reactive power causes obviously lower values of power factor, which in turn increases active power losses, voltage drop, and reduces the effective capacity of generating units and other system components.
For these reasons, the electricity suppliers fix a lower limit on cos
below which the consumer must pay for his excess reactive power consumption in the form of panties. For example, a load power factor of 0.8 in Spain and 0.7 in Belgium will increase the energy bill by 10%.
Power factor improvement in a certain installation is achieved by compensating some (or all) of the reactive power absorbed by it. This is implemented by injecting a certain amount of reactive power into the terminals of that installation.
It is a usual practice to inject most of the reactive power required as close as possible to the load which requires it; by doing so, the power loss and voltage drop caused by the reactive power flow in lines and cables are reduced. Therefore, shunt capacitors have been applied on distribution feeders at medium voltage levels ( 11-33 ) kV as well as at low voltage level by design engineers.
1 S2 S1 Q2 P Q1 Qc 2
the technical merits of capacitor installations are more pronounced, but the cost of capacitors is also increased. Therefore, capacitor sizes must offer the best compromise between technical and economical requirements. Also capacitor type (fixed, switched, or automatically controlled ) as well as points of injection to feeders affect greatly the technical and economical performance of the distribution system.
Fig.1
As it could be seen from Fig.1
For the same value of apparent power (S), the active power (P) increases as the value of Cos approaches unity. For this reason Cos is referred to as the “power factor”, which takes into account the available power.
The total power that must be supplied increases (for a given value of active power P) as the value of Cos decreases.
Individual Compensation:
This method is usually used for one load, a group of loads at the same location, isolated transformer, and industrial plants with relatively low values of power factor. In this method the initial value of power factor (cos 1) is usually known and could be improved to any new required
value (cos 2).
The amount of kVAR to be injected (Qc) is found as:
Qc = Q1 – Q2 = P*tan1 - P*tan 2 Qc = P( tan1 - tan2 ) Qc = P*K Fig. 2 P = S cos Q = S sin S2 = P2 + Q2 tanQ/P
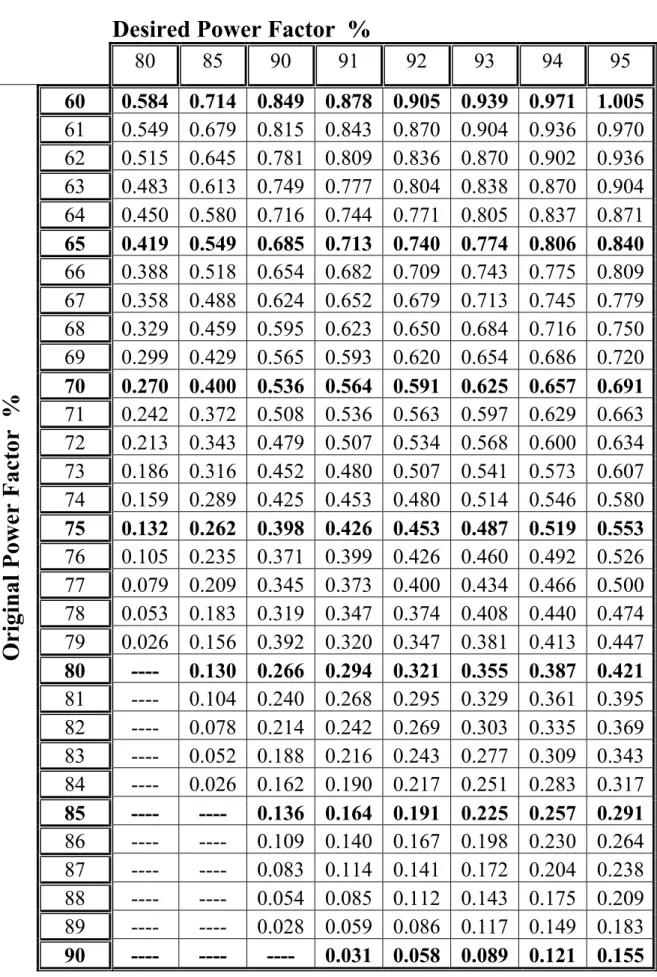
The results of applying the above equations are given in a charts and tables and could be used to determine the amount of kVAR that should be installed to improve the power factor to the required value.
Table for Finding the K – factor K = ( tan1 - tan2)
Desired Power Factor %
80 85 90 91 92 93 94 95 60 0.584 0.714 0.849 0.878 0.905 0.939 0.971 1.005 61 0.549 0.679 0.815 0.843 0.870 0.904 0.936 0.970 62 0.515 0.645 0.781 0.809 0.836 0.870 0.902 0.936 63 0.483 0.613 0.749 0.777 0.804 0.838 0.870 0.904 64 0.450 0.580 0.716 0.744 0.771 0.805 0.837 0.871 65 0.419 0.549 0.685 0.713 0.740 0.774 0.806 0.840 66 0.388 0.518 0.654 0.682 0.709 0.743 0.775 0.809 67 0.358 0.488 0.624 0.652 0.679 0.713 0.745 0.779 68 0.329 0.459 0.595 0.623 0.650 0.684 0.716 0.750 69 0.299 0.429 0.565 0.593 0.620 0.654 0.686 0.720 70 0.270 0.400 0.536 0.564 0.591 0.625 0.657 0.691 71 0.242 0.372 0.508 0.536 0.563 0.597 0.629 0.663 72 0.213 0.343 0.479 0.507 0.534 0.568 0.600 0.634 73 0.186 0.316 0.452 0.480 0.507 0.541 0.573 0.607 74 0.159 0.289 0.425 0.453 0.480 0.514 0.546 0.580 75 0.132 0.262 0.398 0.426 0.453 0.487 0.519 0.553 76 0.105 0.235 0.371 0.399 0.426 0.460 0.492 0.526 77 0.079 0.209 0.345 0.373 0.400 0.434 0.466 0.500 78 0.053 0.183 0.319 0.347 0.374 0.408 0.440 0.474 79 0.026 0.156 0.392 0.320 0.347 0.381 0.413 0.447 80 ---- 0.130 0.266 0.294 0.321 0.355 0.387 0.421 81 ---- 0.104 0.240 0.268 0.295 0.329 0.361 0.395 82 ---- 0.078 0.214 0.242 0.269 0.303 0.335 0.369 83 ---- 0.052 0.188 0.216 0.243 0.277 0.309 0.343 84 ---- 0.026 0.162 0.190 0.217 0.251 0.283 0.317 85 ---- ---- 0.136 0.164 0.191 0.225 0.257 0.291 86 ---- ---- 0.109 0.140 0.167 0.198 0.230 0.264 87 ---- ---- 0.083 0.114 0.141 0.172 0.204 0.238 88 ---- ---- 0.054 0.085 0.112 0.143 0.175 0.209 89 ---- ---- 0.028 0.059 0.086 0.117 0.149 0.183 O ri gi n al P ow er F ac to r % 90 ---- ---- ---- 0.031 0.058 0.089 0.121 0.155
V X Q ΔV ΔV ΔV ΔV rise voltage The V )X Q (Q PR ΔV V QX PR ΔV c 2 1 c 2 1 100 cos ) cos 1 cos 1 ( % cov Re 100 ) cos 1 cos 1 ( % cov Re cos cos cov Re 1 2 1 1 2 1 2 1 2 1 x x S kVA ered x P kVA ered P P S S kVA ered
Although the use of this method improves distribution system performance, it does not provide an optimum solution as it considers each group of loads independently of all other loads connected to the same distribution feeder.
Advantages of Reactive Power Compensation:
There are many benefits to be gained from the application of shunt capacitors to distribution circuit, some of these benefits are
:-1. Voltage Drop Reduction
The injection of a certain amount of reactive power in a feeder, will reduce the reactive current flow in it up to the point of injection, which will reduce the voltage drop up to that point and consequently improve the voltage profile of the feeder.
Voltage drop before compensation Voltage drop after compensation
2. Increasing the Apparent Power Capacity
When the power factor increases, the apparent power (S) for the same active power decreases.
The recovered apparent power in percent of the active power demand or the initial kVA demand could be found
as:-The results of applying the above equations for various values
of initial PF’s (cos
1) and improved PF’s (cos
2) are also
tabulated and plotted graphically.
)
cos
cos
1
(
2 2 1 2 2 2 1
xR
V
S
P
)
2
...(
...
2 2 2 2 1xR
V
S
S
P
3.Reduction in Line & Cable Losses
As the power factor is increased, the line losses are reduced ( because the line current is reduced).
P = S
1cos
1= S
2cos
2S
2= S
1(cos
1/cos
2) ……… (1)
Initial 3-phase power losses (P1) is
:-R
V
S
P
2 2 1 1
Final 3-phase power losses (P2) is
:-R
V
S
P
2 2 2 2
Power loss reduction
P =
P
1–
P
2Substituting for S2 from equation (1) in equation (2) we get
:-The results of applying equation (3) for various values of initial PF’s (cos1) and improved PF’s (cos2) are also tabulated and plotted
graphically.
)
3
.(
...
...
100
)
cos
cos
1
(
%
2 2 1 2 1x
P
P
Reduction in Line and Cable Losses %
in Relation to Losses before Compensation
2 2 2 2 2 1 rat c i rat c i S S P P S S P P
4. Reduction in Transformer Losses
Transformer losses are also reduced when the PF is improved from (cos1) to (cos2) :
Initial transformer losses = Final transformer losses =
Therefore, the power loss reduction in transformer after compensation :-) S S S ( P duction Re Loss 2 rae 2 2 2 1 c
Control Methods
The amount of capacitors connected should be controlled in accordance with load variations as to keep the power factor and voltage within the design limits. To achieve this, capacitor banks are provided with manual or automatic switching facilities.
Time Switches
This method is the simplest and the cheapest and the best in the cases where the load kVAR cycle can be predicted.
A timer is set to switch the capacitor bank at times dictated by the kVAR needs. It is normal to fit a device to prevent switching in at week-ends and during holidays.
Disadvantages
:-1. Problems arise if holiday periods are irregular.
Time Switches with Voltage Over-ride
This method was developed to overcome the disadvantage of
the simple time switch. A voltage sensing relay ( energized by the
timer ) is used to switch the bank only if the voltage condition
require it.
Voltage-Sensitive Control
In this method a voltage sensing relay is used to switch the
capacitor bank in response to system voltage changes. The
disadvantage of this method is that the capacitor bank has other
important functions beside voltage control.
kVAR Sensitive Control
In this method a reactive power relay is used to perform
switching of capacitors in accordance with load kVAR variations.
This method is widely used but it is quite expensive.
Cos
Sensitive Control
This method is used in special cases where a well-defined
power factor conditions occurs regularly.
Department of Electrical & Electronic Eng. – Dr. Hussain Al-Mashat
!! Î
DISTRIBUTION SYSTEM
CONFIGURATION
Distribution networks carry electrical power from main substation sited within areas for load, to secondary substations with lower voltage level and then to individual consumers.
These networks may be of a limited spread , but are characterized by their density and complexity. These factors distinguish them clearly from h.v. and e.h.v. transmission which carry power from generating centers frequently over long distances to the areas of load.
In the Iraqi power system, the term medium voltage include all voltages in the range from 33 kV down to the low utilization voltage level. This means that all 33, 11, 6.6 kV lines, feeders and substations are included in the term of medium voltage distribution.
In the design and development of distribution network, the configuration are selected and compared using the following principles:
The circuit should be reliable (a fault in any part should not affect
other healthy parts).
The circuit should be economical.
It should be simple in operation and maintenance.
It should be capable to meat future expansions without large financial
costs.
It should have reasonable short-circuit level.
Also in selecting the distribution circuit configuration the consumer type and importance is also considered. For this purpose consumer are divided
into:- Consumers of first category:
These consumers must be supplied from at least two independent sources, because any supply interruption could cause losses in human lives (operating theaters in hospitals, intensive care units, electric transport, etc.).
Consumers of second category:
These consumers must also be supplied from two independent sources because supply interruption could cause very large financial losses such as large industrial plants.
Consumers of third
category:-These consumers tolerate short time power interruption in power supply as it dose not cause damages mentioned above.
Many distribution system configurations are available in practice, some of these circuit are:
Radial Distribution System:
In this system, separate feeders are radiated from a single substation and feed distribution transformations from one end only.
This is the simplest distribution circuit and satisfies most circuit requirements with the lowest initial cost but it has the following drawbacks:
The circuit is not very reliable as in the case of fault in any feeder
section, the supply to consumers who are on the side of the fault away from the substation is interrupted.
Department of Electrical & Electronic Eng. – Dr. Hussain Al-Mashat
!! Ð
The consumers at the distant end of the feeder would be subjected to
voltage fluctuations when the load on the feeder changes.
Ring Distribution System:
In this system the primaries of distribution transformers form a loop. The loop circuit start from the substation bus-bars, makes a loop through the areas to be served and returns to the substation. The circuit provides for quick restoration of service in the case of transformer or feeder fault.
This circuit is very reliable but has a relatively larger cost. Also each side of the ring should not be loaded more than 50% of its rating as to accept the load of the other side in the case of fault.
Spike Distribution System:
In this system all secondary substations are supplied by using radial feeders. In addition a separate stand-by feeder is provided for emergency (to provide power supply in the case of a fault in any main feeder). Each feeder in this case is designed to withstand its own load with no additional capacity. The circuit is reliable and could be used if the site permits.
Spindle Distribution System:
In this system all secondary substations are supplied by using radial feeders. In addition a switching station is provided to connect the supply to the feeder with a faulty section .This circuit could be implemented only if the site layout permits. It is more expensive but reliable .
Network ( or Grid ) Distribution System:
In this system the primary feeders are connected to form a grid ( or network ). The network is then supplied at two or three locations. The network should be provided with sectionalizing and switching facilities. The system provide a good supply security and flexibility but it has a large capital investments.
Primary Selective Distribution System:
In this system two separate feeders are used and each distribution substation could be connected to either feeder. In the case of a fault in any feeder, the load could be transferred ( manually or automatically ) to the other feeder. The system is very reliable but has a large financial cost.
Department of Electrical & Electronic Eng. – Dr. Hussain Al-Mashat !! Ò 11 kV Draw-out Circuit Breakers Incoming Supply from Transformer 11 kV Side 11kV Busbars 11/0.4 kV Transformer Substation
Single Line Diagram of the Radial Distribution System
11 kV Draw-out Circuit Breakers Incoming Supply from Transformer 11 kV Side 11kV Busbars 11/0.4 kV Transformer Substation
Department of Electrical & Electronic Eng. – Dr. Hussain Al-Mashat !! Ô Incoming Supply from Transformer 11 kV Side 11kV Busbars 11/0.4 kV Transformer Substation
Single Line Diagram of the Spike Distribution System
11 kV Draw-out Circuit Breakers
Incoming Supply from Transformer
11 kV Side
11kV Busbars
11/0.4 kV Transformer Substation
Single Line Diagram of the Spindle Distribution System
11kV Busbars 11 kV Draw-out
Department of Electrical & Electronic Eng. – Dr. Hussain Al-Mashat
!! Ö
11/0.4 kV Transformer Substation
1,2,3 are the supply points from main 33/11 kV substations x x x x x x x x x x x x x x x x x x x x x x x x x x x x x x x x x x x x x x x x x x 1 2 3 1 3 2
Incoming Supply from Transformer
11 kV Side
11kV Busbars
11/0.4 kV Transformer Substation
SingleLine Diagram ofthe Primary Selective Distribution System
Department of Electrical & Electronic Eng. – Dr. Hussain Al-Mashat !! Î Î
km
r
D
X
L
0
.
144
log
(
avg)
0
.
0157
/
31 23 3 12*
D
*
D
D
D
avg
D
D
D
D
D
avg
3*
*
2
1
.
26
D31 D23 D12 D D 2DDistribution System Parameters
Distribution system parameters are required and used in the electrical design, voltage drop and power loss calculations, etc.
The active resistance per unit length in /km depends on conductor size and material and could be found from the corresponding tables. ( see tables for Al, Cu, and ACSR )
The inductive reactance per unit length XL for overhead lines and
cables depends mainly on their geometry and could be found from the following equation :
r – Conductor radius
Davg – Average spacing between conductors
In the case of triangular phase arrangement :
In the case of horizontal phase arrangement :
For most practical cases :
XL = ( 0.3 to 0.4 ) /km for overhead lines
XL = ( 0.34 to 0.36 ) /km for overhead lines in distribution systems
XL = ( 0.08 to 0.1 ) /km for cables
Distribution System Parameters
Distribution system parameters are required and used in the electrical design, voltage drop and power loss calculations, etc.
The active resistance per unit length in
/km depends on conductor size and material.Conductor Materials
The conductor material used in overhead line must have: 1. High electrical conductivity (low resistance)
2. High tensile strength (mechanically strong) 3. Low cost
The two most common materials in use for overhead line construction are:
1. Copper (Cu)
Conductivity and tensile strength of Cu are high, but the cost
of material is also high.
2. Aluminum (Al)
a) Conductivity of Al is about 60% of that of Cu.
b) Low tensile strength (mechanically weak)
c) Lower cost and lighter weight when compared with Cu
conductor of the same resistance.
For the same resistance, Al has a larger diameter than Cu
(reduced corona effect)
Mainly because of its lower cost and lighter weight, Al (in various forms and improvements) has been used almost exclusively in overhead line construction.
Department of Electrical & Electronic Eng. – Dr. Hussain Al-Mashat
!! Ï
Also conductors used in T.L. are always stranded for easier handling, easier transportation (on drums), and to avoid mechanical vibration which may lead to conductor breaking.
Several types of conductor constructions using Al are available on international market, these are:
AL or AAC – Aluminum or All Aluminum Conductors (which are usually used for shorter spans because of the low tensile strength).
AAAC – All Aluminum Alloy Conductors ( this type can be used for longer spans because of mechanical improvements).
ACSR - Aluminum Conductors Steel Reinforced ( this type is almost exclusively used for the construction of the majority of T.L. during recent years because of the good mechanical properties and relatively low cost).
Conductor Resistance
The active resistance (R) of a uniform conductor of length l and cross-section A could be found from the following equation:
In the above equation:
- The resistivity of the material (
-m) l - The length of conductor (m)A – Cross-sectional area of conductor (m2)
However, in practice the active resistance for the various materials used in T.L. construction in addition to several other important data are given in the appropriate tables. ( See tables for Al, Cu, and ACSR conductors )
A l R
Inductive Reactance
The inductive reactance per unit length X
Lfor overhead lines and
cables depends mainly on their geometry and could be found from
the following equation :
r – Conductor radius
Dm – Mean geometric spacing between conductors
In the case of triangular phase arrangement :
In the case of horizontal phase arrangement :
Line Voltage (kV) 0.5 10 15 20 30 Dm (m) o.4 to 0.6 0.8 to 1.0 1.2 to 1.4 1.4 to 1.6 1.6 to 2.0
For most practical cases :
X
L= ( 0.3 to 0.4 )
/km for overhead lines
XL = ( 0.34 to 0.36 )
/km for overhead lines in distribution systemsX
L= ( 0.08 to 0.1 )
/km for cables
X
Lalso could be found from corresponding tables or charts.
km r D XL 0.144log( m)0.0157 / 3 31 23 12
*
D
*
D
D
D
m
D31 D23 D12D
D
D
D
D
m
3*
*
2
1
.
26
D D 2DDepartment of Electrical & Electronic Eng. – Dr. Hussain Al-Mashat
!! Ñ
Transformer Losses
Transformer losses could be found from the following equation :
In the above equation :
P - Total transformer losses
Pi – Transformer iron losses ( independent of load )
Pc – Transformer copper losses ( load losses )Srat – The rated power of transformer kVA
S – The actual transformer power kVA For (n) parallel operating transformers :
S – The total load of ALL transformers kVA Srat - The rated power of ONE transformer kVA
Daily and annual energy losses could be found as :
E =
P *
t (kWh)
Line and Cable Losses
P = 3 I
2R ; but
Also the daily and annual energy losses could be found as :
E =
P *
t (kWh)
) ( ) ( 2 kW S S P P P rat c i ) ( ) ( * 1 * 2 kW S S P n P n P rat c i V
S
I
3
R
V
Q
P
R
V
S
P
22
2
2 2
Economical Number of Transformers
In the case of daily and annual load variation and when several
transformers are operating in parallel, it is more economical to
switch transformers ON and OFF in accordance with the load
requirements.
For (n) parallel operation transformers we have :
For (n+1) parallel operation transformers we have :
P
n=
P
(n+1) 2)
(
*
1
*
rat c i nn
P
n
P
S
S
P
2 ) 1 ((
)
1
1
)
1
(
rat c i nS
S
P
n
P
n
P
c i ratP
n
P
n
S
S
*
(
1
)
Department of Electrical & Electronic Eng. – Dr. Hussain Al-Mashat
!! Ó
Radial Distribution System Calculations
Approximate voltage drop for each section could be found as