SCHOOL OF ENGINEERING
PhD THESIS
Academic Year 2008-2009
J. Gomez-Parada
Parametric Analysis of the Drag Produced
by a VHBR Engine using CFD
Supervisors:
S. Ogaji
R. Singh
October 2009
© Cranfield University 2009. All rights reserved. No part of this
publication may be reproduced without the written permission of the
Every great achievement is the
victory of a flaming heart.
i.
Abstract
The future of the civil aeronautics industry will be determined by the decreasing oil supplies around the world and by more environmentally friendly aircraft designs. Future Gas Turbine engines are being designed focusing on the fuel economy reducing emissions and noise.
This project is on the application of Computational Fluid Dynamics (CFD) techniques to the computation and parametric analysis of drag produced by the nacelle of Very High By-pass Ratio (VHBR) engines as integrated into the airframe. Engines based on VHBR concept are consistent with the objectives of VITAL which is an EU project for creating environmentally friendly engine without SFC penalties or impairing other benefits. Three main architectures for the fan were considered for the task, a geared turbofan, contra rotating turbofan and direct drive turbofan. The long range geared turbofan is the one considered in this project.
Increasing the BPR for turbofan engines is one of the best options for decreasing the SFC and noise produced by the power plant, unfortunately there are some issues to be considered. One of the major drawbacks when the BPR reaches very high values (VHBR) is the integration to the airframe because of the very large size of the fan. The drag produced by the nacelle has to be countered with propulsive force and therefore decreasing the propulsive efficiency and increasing the SFC.
CFD can be used for parametric analysis of drag produced by turbofan nacelles. The analysis was carried out in 3 basic stages. 2D geometry analyses of the afterbody and forebody are the first stage. Small changes to the basic geometry parameters were made in order to form conclusions about which parameters are more significant for drag generation in each section of the nacelle.
In the second stage of the project a 3D geometric analysis was carried out with the whole nacelle. The important parameters from the 2D simulations and some of the parameters required for 3D geometry were varied in the analysis. Conclusions were made about the influence of each of the parameters in drag generation and their influence on the interaction between forebody and afterbody.
In the third stage of the project, the influence on drag of the positioning of the engine relative to the wing is analyzed. No geometry changes were made and no pylon was used.
Conclusions were made from the changes of pressure distribution and supersonic zones and their impact on the drag.
ii.
Acknowledgements
I would like to thank The National Council for Science and Technology of Mexico (CONACYT) for the financial support during my studies.
Thanks also to all of my friends giving support to me during the good and bad times in Cranfield, especially Jacinto, Osvaldo, Edwin, Quike, Birute, Lydiane, Nafsika, Hara, Sharon, Matthieu, Dimitrious and Joanna. Special thanks to those close friends that were not only a moral support but also academic, without them this project would have never been finished. Fernando Colmenares, always a friend helping me to stay on the right track. Birute Bunkute, she always provided me her knowledge and shoulder to keep on standing. I have learnt a great deal from those lecturers and researchers working with me over these years and gratefully acknowledge my debt to them, especially Stephen Ogaji, Pericles Pilidis, Philip Rubini, Riti Singh and Darrell Williams. Special mention has to be made of Mark Savill, his guidance was a real breakthrough during my work. Thanks to Mark‟s knowledge and support I was able to continue until the end.
Everyone in Mitchell Hall and Cranberries staff were very important to me. They are like my family. They not only gave food to me, they also helped me to keep on smiling during all of these years.
To those of you who already passed away but are still with me. Manchas, please keep behind me on the uphill and in front of me on the downhill. Abi, keep on praying, you are with me, always. Grandfather, you are the best engineer I have ever met, I will keep on wearing your hat.
My family is always the most important. My mom, when I was happy she was there, when I was crying she was there, she has always been there. Betsa, my little sister, I specially love that girl always in parties and having fun. Cesar, my brother, is always working but also staying there when support for me was needed. Sosa family, forever my other family. My dad, is my database of knowledge when I need him.
iii.
List of Contents
i. Abstract ... i
ii. Acknowledgements ... iii
iii. List of Contents ... iv
iv. List of Figures ... viii
v. List of Tables ... xv
vi. List of Symbols and abbreviations ... xvi
vii. Subscripts... xviii
1 Introduction ... 1
1.1 EnVIronmenTALly Friendly Aero Engine (VITAL) ... 2
1.1.1 Integration of the Engine into the Airframe ... 3
1.2 Objectives of the project ... 3
1.3 Contribution to knowledge ... 4 1.3.1 Achievements ... 4 2 Contribution to knowledge ... 6 3 Methodology ... 8 3.1 Literature review ... 9 3.2 2D Analysis ... 9
3.2.1 Choosing parameters to be analyzed ... 10
3.2.2 Afterbody methodology ... 10
3.2.3 Forebody methodology ... 11
3.2.4 Results Analysis ... 11
3.3 3D Isolated Nacelle Analysis ... 11
3.3.1 CAD geometry generation ... 12
3.3.3 Parametric calculations ... 12
3.3.4 Results analysis... 13
3.4 3D Integrated Nacelle Analysis ... 13
3.4.1 WB Analysis ... 13
3.4.2 WBN Analysis ... 14
4 Literature Review ... 18
4.1 VHBR Engine ... 18
4.2 Installation of the propulsion system ... 21
4.2.1 Drag ... 23
4.2.2 Interference Effects ... 27
4.2.3 Integration Methodology ... 29
4.3 CFD ... 34
4.3.1 Turbulence modelling ... 37
4.3.2 Use of Computational Fluid Dynamics for integration ... 40
4.3.3 Grid Generation ... 44
5 Isolated nacelle (2D simulations) ... 45
5.1 Geometric Model Design ... 45
5.1.1 Forebody profile ... 46 5.1.2 Afterbody profile ... 47 5.2 Parameters variation ... 48 5.3 Meshing strategy... 49 5.3.1 Afterbody ... 49 5.3.2 Forebody ... 51 5.4 CFD ... 54
5.4.2 Convergence ... 55
5.5 Initial Conditions ... 56
5.6 y+ parameter ... 57
5.7 Afterbody simulations ... 57
5.7.1 Main parameters ... 57
5.7.2 Mesh Dependency Analysis ... 58
5.7.3 y+ analysis ... 61
5.7.4 Parameters to be analyzed ... 61
5.7.5 Results and analysis ... 63
5.8 Forebody simulations ... 70
5.8.1 Main parameters ... 70
5.8.2 Mesh Dependency Analysis ... 71
5.8.3 y+ analysis ... 73
5.8.4 Parameters to be analyzed ... 74
5.8.5 Results and analysis ... 76
6 Isolated Nacelle (3D simulations) ... 83
6.1 Geometry ... 83 6.1.1 Parameters analyzed ... 85 6.2 Grid Generation ... 86 6.2.1 Meshing strategy... 86 6.3 Simulation setup ... 88 6.3.1 Boundary conditions ... 88 6.3.2 Solver ... 90 6.3.3 Convergence Analysis ... 90 6.4 Result analysis ... 91
6.4.1 Maximum Diameter (Dmax) change analysis ... 94
6.4.2 Highlight Diameter (Dhigh) change analysis ... 101
6.4.3 Total nacelle length variation analysis ... 108
7 Integrated Nacelle to an airframe ... 115
7.1 Introduction ... 115 7.2 Methodology ... 116 7.3 Geometry ... 116 7.4 Meshing strategy... 118 7.4.1 WB system grid ... 118 7.4.2 WBN grid ... 120 7.5 Simulation Setup... 121 7.6 Simulation ... 122 7.6.1 Convergence ... 122 7.7 Parameters ... 124
7.8 Results and analysis ... 126
8 Final Observations ... 139
9 Conclusions ... 141
10 Further work ... 143
11 References ... 145
12 Appendixes ... 153
A. Mach Number Contours of 3D Isolated Nacelle simulations ... 153
B. Profiles of Cp and Ma number of 3D Isolated Nacelle simulations ... 165
iv.
List of Figures
Figure 4.1 Optimization of fan pressure ratio (Cohen, 1987, p. 99) ... 19
Figure 4.2 Relation between Efficiency and Bypass Ratio (Lecordix, 1992) ... 20
Figure 4.3 Fuel consumption improvements (Burgsmueller, 1996) ... 21
Figure 4.4 Installed Nacelle Components (Mullender, 1996) ... 22
Figure 4.5 All of the forces acting on a short cowl nacelle ... 26
Figure 4.6 Forebody forces ... 27
Figure 4.7 Afterbody forces... 27
Figure 4.8 Spanwise lift distribution with and without nacelles (Rossow, 1992) ... 28
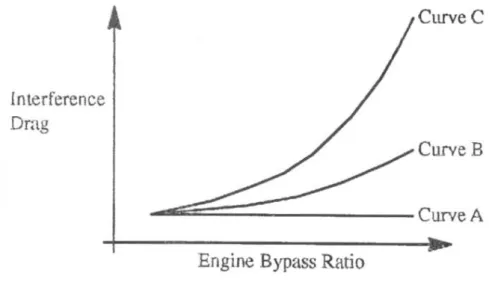
Figure 4.9 Variation of Interference Drag with Engine Bypass Ratio for a given application ( Cedar, 1993) ... 29
Figure 4.10 Relation between the Interference Drag and the position of the engine (Rossow, 1994) ... 29
Figure 4.11 Factors influencing nacelle installation design (Berry, 1994) ... 30
Figure 4.12 Decomposition for Thrust/Drag bookkeeping (von Geyr, 2005) ... 32
Figure 4.13 Pressure based solver, segregated and coupled algorithms (Fluent 6.2 Documentation, 2007) ... 35
Figure 4.14 Density based solver (Fluent 6.2 documentation, 2007) ... 36
Figure 4.15 Grids for an isolated Inlet and an installed Nacelle (Joubert, 1993) ... 42
Figure 4.16 Chimera Grid generation Technique (Cedar, 1993) ... 43
Figure 4.17 Capabilities of different numerical approaches (Rudnik, 2002) ... 43
Figure 5.1 Super ellipse parameters ... 47
Figure 5.2 Nacelle design parameters... 48
Figure 5.3 Afterbody grid zones (Coarse mesh shown) ... 50
Figure 5.4 Grids created in order to evaluate the mesh independence of the nozzle. ... 51
Figure 5.5 Forebody meshing sections ... 53
Figure 5.6 Three meshes created to analyze the mesh independency ... 54
Figure 5.7 Simulation residuals got asymptotic (Afterbody simulation shown) ... 55
Figure 5.8 Drag Coefficient Convergence criterion (Afterbody simulation shown) ... 56
Figure 5.10 Comparison of the Cf for the afterbody ... 59
Figure 5.11 Comparison of the Cp for the afterbody ... 60
Figure 5.12 The y+ parameter for one of the Afterbody simulations ... 61
Figure 5.13 Afterbody contours of Pressure Coefficient ... 63
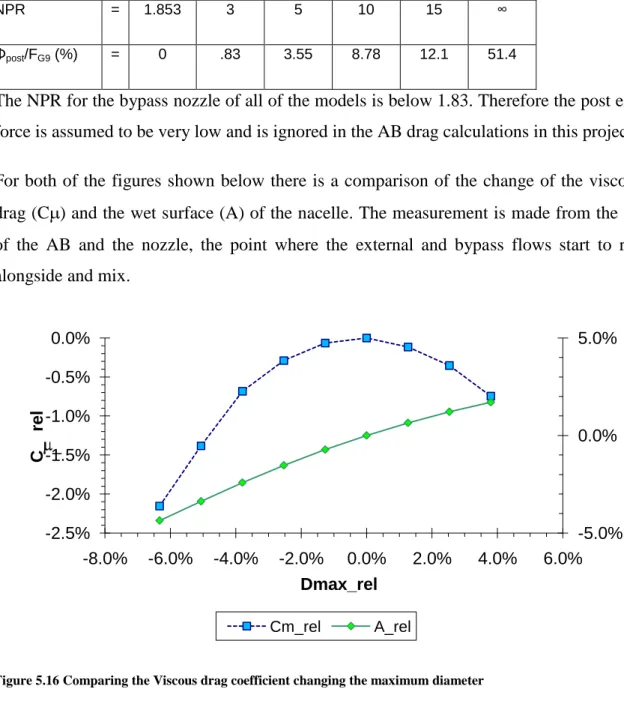
Figure 5.14 Afterbody contours of Mach number for a small maximum diameter nacelle . 64 Figure 5.15 After body contours of Mach number for a large maximum diameter nacelle . 64 Figure 5.16 Comparing the Viscous drag coefficient changing the maximum diameter ... 66
Figure 5.17 Comparing the Viscous drag coefficient changing the exhaust angle ... 67
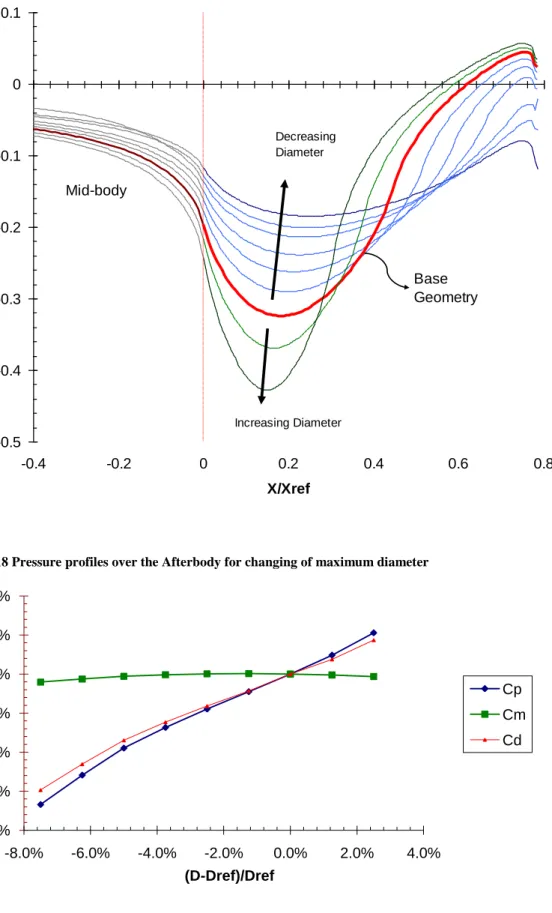
Figure 5.18 Pressure profiles over the Afterbody for changing of maximum diameter ... 68
Figure 5.19 Influence of Dmax on viscous, pressure and drag coefficients on the AB ... 68
Figure 5.20 Pressure profiles over the Afterbody for changing of exhaust angle ... 69
Figure 5.21 Drag change for the change of the maximum diameter and the bypass exhaust angle... 70
Figure 5.22 Forebody boundary conditions (not to scale) ... 71
Figure 5.23 Forebody Cf comparison for the mesh independence analysis ... 72
Figure 5.24 Forebody Cp comparison for the mesh independence analysis ... 72
Figure 5.25 Comparing the Cf and Cp of the coarse and medium meshes with the fine one ... 73
Figure 5.26 Y+ analysis for the Forebody ... 74
Figure 5.27 Drag Change with respect to the lip length ... 74
Figure 5.28 Mach number profiles for a forebody model ... 76
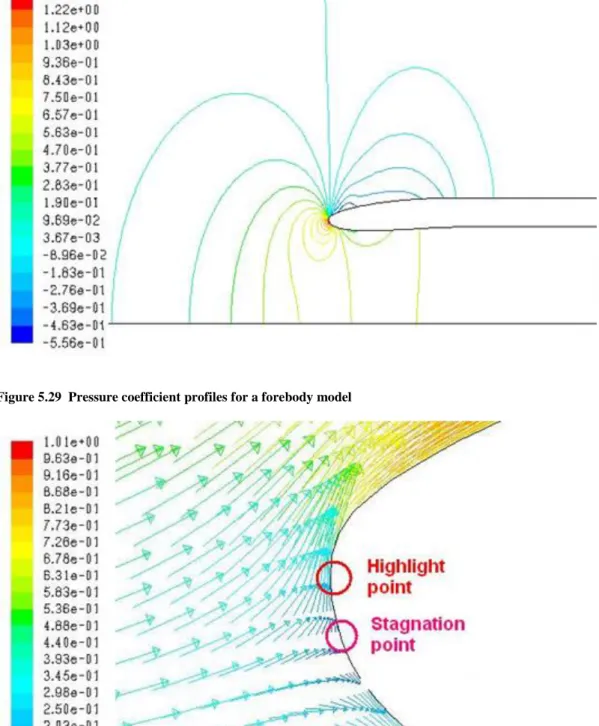
Figure 5.29 Pressure coefficient profiles for a forebody model ... 77
Figure 5.30 Velocity vectors at the highlight point of an intake ... 77
Figure 5.31 Supersonic areas for a small Dmax with a small (left) and large (right) Dhigh 78 Figure 5.32 Supersonic areas for a large Dmax with a small (left) and large (right) Dhigh 78 Figure 5.33 Change of total drag changed by the variation of Dmax and Dhigh ... 80
Figure 5.34 Variation of pre entry force (drag) with respect of the change of Dhigh and Dmax ... 81
Figure 5.35 Change of Drag and its components related to the variation of the throath diameter. ... 82
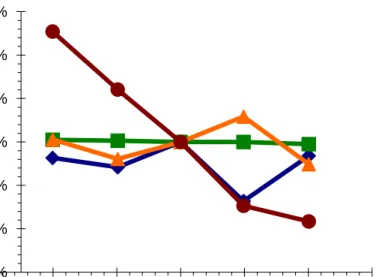
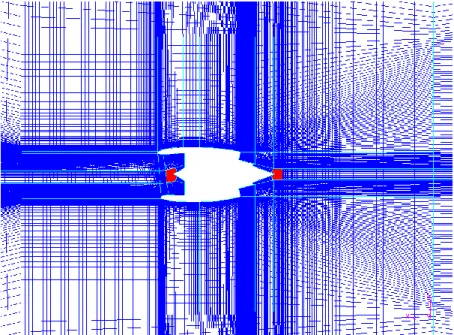
Figure 6.1 Isolated nacelle domain dimensions ... 86 Figure 6.2 Annular shape of every block of the domain. ... 87 Figure 6.3 Mesh at the symmetry plane. The areas filled with red colour are where an unstructured mesh was used. ... 88 Figure 6.4 Boundary conditions (image not to scale) ... 89 Figure 6.5 Side view of a short bypass nacelle, the top part of it is called the crown section and the lower part the keel section. ... 91 Figure 6.6 Total nacelle force change with respect of the change of each of the analysis parameter ... 93 Figure 6.7 Pre-entry drag change with respect of the change of each of the analysis parameter ... 93 Figure 6.8 Mach number profiles of the side section of the nacelle of a Maximum diameter of - 6.0 % change with respect to the reference nacelle. (Mach number profiles are in the range of 0.6 and lower for blue to 1.2 and higher for red). ... 94 Figure 6.9 Mach number profiles of the side section of the nacelle of a Maximum diameter of + 6.0 % change with respect to the reference nacelle. (Mach number profiles are in the range of 0.6 and lower for blue to 1.2 and higher for red). ... 95 Figure 6.10 Axial component of viscous force changes at the Afterbody (AB), Midbody (MB) and Forebody (FB) for Dmax change percentage... 97 Figure 6.11 Pressure coefficient profiles along the crown (a), side (b) and keel (c) sections of the four nacelles shown with the percentage change of maximum diameters. ... 99 Figure 6.12 Change of pressure force on the Afterbody and Forebody related to the change of the daximum diameter ... 100 Figure 6.13 Total force applied to each of the nacelle sections. ... 101 Figure 6.14 Mach number profiles of the side section of the nacelle of a Highlight diameter of - 6.0 % change with respect to the reference nacelle. (Mach number profiles are in the range of 0.6 and lower for blue to 1.2 and higher for red). ... 102 Figure 6.15 Mach number profiles of the side section of the nacelle of a Highlight diameter of + 6.0 % change with respect to the reference nacelle. (Mach number profiles are in the range of 0.6 and lower for blue to 1.2 and higher for red). ... 103
Figure 6.16 Applied viscous force changes at the three sections of the nacelle versus the
percentage of highlight diameter change. ... 104
Figure 6.17 Pressure coefficient profiles along the crown (a), side (b) and keel (c) sections of the four nacelles shown with the percentage change of highlight diameters. ... 105
Figure 6.18 Pressure force changes over the forebody and afterbody related to the highlight diameter changes. ... 106
Figure 6.19 Pressure coefficient (Cp) distribution over the projected area of the FB to the axial component of the geometries with a Dhigh increase of 2.0% (left) and 6.0% (right). ... 107
Figure 6.20 Total force variations at the three sections of the nacelle with respect to the changes of the highlight diameter. ... 108
Figure 6.21 The effect of the change of total nacelle length in the viscous force. ... 109
Figure 6.22 Mach number profiles of the side section of the nacelle of a length of - 6.0 % change with respect to the reference nacelle. (Mach number profiles are in the range of 0.6 and lower for blue to 1.2 and higher for red)... 110
Figure 6.23 Mach number profiles of the side section of the nacelle of a Length of + 6.0 % change with respect to the reference nacelle. (Mach number profiles are in the range of 0.6 and lower for blue to 1.2 and higher for red)... 110
Figure 6.24 Pressure coefficient profiles along the crown (a), side (b) and keel (c) sections of the four nacelles shown with the percentage change of total nacelle length. ... 112
Figure 6.25 Effect of total nacelle length changes in the pressure force. ... 113
Figure 6.26 Effect of the total nacelle length changes in the total force. ... 113
Figure 6.27 Impact of the nacelle length on the viscous and pressure force percentage on total force (a) and the force of the FB, MB, and AB percentage on the total force (b). ... 114
Figure 7.1 MRT-7 project of Aircraft and Vehicle Design of Cranfield University ... 117
Figure 7.2 Simplified geometry of the MRT-7 project ... 118
Figure 7.3 Airframe domain ... 119
Figure 7.4 WB mesh ... 120
Figure 7.5 Integrated nacelle grid ... 121
Figure 7.6 Convergence criteria. (a) residuals, (b) Cd and Cl history and (c) mass flow history ... 123
Figure 7.7 Main parameters for engine positioning ... 125 Figure 7.8 Impact of penetration and vertical positioning on total drag ... 127 Figure 7.9 Pressure (a) and viscous force (b) on the nacelle ... 128 Figure 7.10 Sections of the nacelle chosen for analyzing the influence of the nacelle position on the Cp distribution ... 129 Figure 7.11 Selected nacelle Cp distribution lines along the nacelle of four different simulations (a) h/D=0.6, x/l=0.75 (b) h/D=0.55, x/l=0.75 (c) h/D=0.6, x/l=0.7 (d) h/D=0.6, x/l=0.8 ... 130 Figure 7.12 Mach number profiles for nacelles positioned at (a) h/D=0.6, x/l=0.7, (b) h/D=0.6, x/l=0.8 and (c) h/D=0.5, x/l=0.8... 132 Figure 7.13 Impact of penetration and vertical positioning on wing drag ... 134 Figure 7.14 Wing Sections analyzed (not drawn to scale) ... 135 Figure 7.15 Three selected wing airfoil profiles. (a) and (b) h/D=0.55, x/l=0.75, (c) and (d) h/D=0.6, x/l=0.75 and (e) and (f) h/D=0.6, x/l=0.8 ... 136 Figure 7.16 Airfoil Cp profiles. for the nacelle of (a) h/D=0.65, x/l=0.65, at w/Dmax=2.26 (b) h/D=0.65, x/l=0.65, at w/Dmax=3.27, (c) h/D=0.65, x/l=0.7, at w/Dmax=2.26 and (d) h/D=0.65, x/l=0.7, at w/Dmax=2.26... 137 Figure 7.17 Detailed profiles of Mach number for the simulations of (a) h/D=0.65, x/l=0.65 and (b) h/D=0.65, x/l=0.7 ... 137 Figure 7.18 Impact of penetration and vertical positioning on interference drag. ... 138 Figure A. 1 Mach number profiles of the Crown (top), Side (middle) and keel (bottom) sections of the nacelle of a Maximum diameter of - 6.0 % change with respect to the reference nacelle. ... 153 Figure A. 2 Mach number profiles of the Crown (top), Side (middle) and keel (bottom) sections of the nacelle of a Maximum diameter of - 2.0 % change with respect to the reference nacelle. ... 154 Figure A. 3 Mach number profiles of the Crown (top), Side (middle) and keel (bottom) sections of the nacelle of a Maximum diameter of + 2.0 % change with respect to the reference nacelle. ... 155
Figure A. 4 Mach number profiles of the Crown (top), Side (middle) and keel (bottom) sections of the nacelle of a Maximum diameter of + 6.0 % change with respect to the
reference nacelle ... 156
Figure A. 5 Mach number profiles of the Crown (top), Side (middle) and keel (bottom) sections of the nacelle of a Highlight diameter of -6.0 % change with respect to the reference nacelle. ... 157
Figure A. 6 Mach number profiles of the Crown (top), Side (middle) and keel (bottom) sections of the nacelle of a Highlight diameter of - 2.0 % change with respect to the reference nacelle. ... 158
Figure A. 7 Mach number profiles of the Crown (top), Side (middle) and keel (bottom) sections of the nacelle of a Highlight diameter of + 2.0 % change with respect to the reference nacelle. ... 159
Figure A. 8 Mach number profiles of the Crown (top), Side (middle) and keel (bottom) sections of the nacelle of a Highlight diameter of + 6.0 % change with respect to the reference nacelle. ... 160
Figure A. 9 Mach number profiles of the Crown (top), Side (middle) and keel (bottom) sections of the nacelle of a length of - 6.0 % change with respect to the reference nacelle. ... 161
Figure A. 10 Mach number profiles of the Crown (top), Side (middle) and keel (bottom) sections of the nacelle of a length of - 2.0 % change with respect to the reference nacelle. ... 162
Figure A. 11 Mach number profiles of the Crown (top), Side (middle) and keel (bottom) sections of the nacelle of a length of + 2.0 % change with respect to the reference nacelle. ... 163
Figure A. 12 Mach number profiles of the Crown (top), Side (middle) and keel (bottom) sections of the nacelle of a length of + 6.0 % change with respect to the reference nacelle. ... 164
Figure B. 1 Cp profiles of 3D Isolated nacelle simulations with Dmax variations ... 165
Figure B. 2 Ma profiles of 3D Isolated nacelle simulations with Dmax variations ... 166
Figure B. 3 Cp profiles of 3D Isolated nacelle simulations with Dhigh variations ... 167
Figure B. 5 Cp profiles of 3D Isolated nacelle simulations with length variations ... 169 Figure B. 6 Ma profiles of 3D Isolated nacelle simulations with length variations ... 170 Figure C. 1 (a) h/Dmax= 0.547, x/l=0.7223 (Base value); (b) h/Dmax= 0.5, x/l=0.8; (d) h/Dmax=0.55 , x/l=0.75; (e) h/Dmax=0.6, x/l=0.7 ... 171 Figure C. 2 (a) h/Dmax=0.6 , x/l=0.75; (b) h/Dmax=0.6 , x/l=0.8; (d) h/Dmax= 0.65, x/l=0.65; (e) h/Dmax=0.65 , x/l=0.7 ... 172
v.
List of Tables
Table 1 Afterbody mesh dependency Cf and Cp comparison ... 60 Table 2 Values to be analyzed for the 2D Afterbody simulations (relative to a reference value) ... 62 Table 3 Afterbody pressure, viscous and drag coefficients for different maximum diameters ... 65 Table 4 Afterbody pressure, viscous and drag forces for different exhaust angles ... 65 Table 5 Relation of the NPR and ideal post-exit force taken from Aircraft Engine Integration Notes of Mr. D. Williams (2006). ... 66 Table 6 Change of Maximum Diameter and Highlight Diameters for the different geometries ... 75 Table 7 Change of Throat Diameter and Total Nacelle Length ... 76 Table 8 Forebody force changes (the bold figures are the data from the base geometry) .... 79 Table 9 Parameter values for the analysis and their variation with respect to the base values(Shaded cells are the base values) ... 125 Table 10 Combination of the parameters. ... 126
vi.
List of Symbols and abbreviations
2D Two dimension
3D Three dimension
AB After-Body
AIAA American Institute of Aeronautics and Astronautics
BPR Bypass Ratio
CAD Computer Aided Design
Cf Force Coefficient
CFD Computational Fluid Dynamics
Cp Pressure Coefficient
CRTF Contra Rotational Fan
Cμ Viscous Force Coefficient
D Diameter
DDTF Direct Drive Turbo Fan
DLR German Aerospace Centre
DPW Drag Prediction Workshop
EU European Union
FB Fore-Body
FEM Finite Element Method
FG Gross Thrust
Fint Intrinsic Thrust
FN Net Thrust
FPR Fan Pressure Ratio
GTE Gas Turbine Engine
GTF Geared Turbofan
h Up/Down position for an integrated nacelle
HBR High Bypass Ratio
k turbulent kinetic energy
k – ε k – ε turbulence model
k – ω k – ω turbulence model
L length
LES Large Eddy Simulation
LPC Low Pressure Compressor
LPT Low Pressure Turbine
m Mass
MB Mid-Body
NASA National Aeronautics and Space Administration
NOx Nitrogen Oxides
NPF Net Propulsive Force
ONERA National Office of Aerospatiale Studies and Research
OPR Overall Pressure Ratio
RSM Reynolds Stress Model
S-A Spalart Allmaras turbulence model
SFC Specific Fuel Consuption
SS Steady State
TD Time Dependent
TET Turbine Entry Temperature
UHBR Ultra-High Bypass Ratio
uτ Friction coefficient
v velocity
VHBR Very-High Bypass Ratio
VITAL Environment Friendly Aero-Engine
w Mass flow
WB Wing Body
WBN Wing Body Nacelle
WBPN Wing Body Pylon Nacelle
x abscise
Greek Symbols
α angle
ν Viscosity
ε Dissipation per unit mass
ρ density
τ Shear stress
φ Force
vii.
Subscripts
AB After-Body FB Fore-Body high highlight insc inscidence int intrinsick turbulent kinetic energy
max Maximum
Plug Plug (Exhaust cone)
pot potential
Pre Pre-entry
ref reference
rel relative
1
Introduction
The design of a new engine for a subsonic civil transportation aircraft has to be done taking into consideration several points of view. Every aspect considered will have an impact on the final user. For airline companies, fuel economy is one of the most important issues to consider for the selection of a new aircraft. For this reason, aircraft manufacturers present different options of engine suitable for the final aircraft system. Each engine manufacturer offers different options of performance, not only for structural and flight requirements, but also economical issues. Environmental issues are other important aspects to consider in the aeronautic industry because the regulations of noise and emission levels are becoming very demanding.
Gas turbine engines are commonly used to power aircraft. There are four variants of gas turbine engines used for this task; turbo-jet used mostly for military combat aircraft, turbo-shaft used mainly in helicopters, turbo-props for low velocity transport aircraft, and turbo-fan, being the one most used in the civil transportation industry. In a turbofan engine the low pressure compressor, usually called fan, delivers part of the air to the next compressor of the engine and the other part by-passes the core of the engine going to a nozzle to produce thrust.
The amount of air by-passing the core is one of the most important design parameters of a turbofan engine. The Bypass Ratio (BPR) is a variable used to measure the ratio of flow going around the core to that through the core. The bypass flow was conceived as a method of improving the propulsive efficiency of the engine by reducing the jet velocity. Also, noise is reduced due to the jet velocity diminution.
The BPR is a very important parameter due to its effect in the Specific Fuel Consumption (SFC) and the Specific thrust. The effect of an increase of BPR would be the decrease of the optimum SFC. The optimum SFC with a higher BPR is at a lower Fan Pressure Ratio (FPR). These two diminutions have a direct influence in the weight of the aircraft (including the loads) due to the amount of fuel required to complete the mission. The pressure ratio reduction also influences the technology required (and the cost) of the design and fabrication of the fan. Therefore the increase of a turbofan BPR decreases the cost and complexity of the fan.
Unfortunately, there are some disadvantages of increasing the BPR of an engine. The size of the fan grows. There is a minimum SFC attainable by increasing the BPR due to the increase of the installed drag produced by the increase of the fan size (Rudnik, 2002). There are many other problems regarding the increased size of a VHBR engine like the ground clearance limitations and the weight increase, amongst many others. These make it more difficult to continue to improve the engine performance by increasing the BPR. Many difficulties need to be worked out to continue the development of aircraft technologies. This is where projects like VITAL take the stage, to make a breakthrough in the available knowledge that will allow the technology to continue improving.
1.1
EnVIronmenTALly Friendly Aero Engine (VITAL)
VITAL will provide a breakthrough in noise and emissions engine architecture. This breakthrough will be achieved by the development of new commercial engines taking advantage of the novel lightweight and low noise technologies. With this improvement the SFC is going to be reduced without having an impact on noise and emissions.
VITAL will design, manufacture and rig test three novel fan architectures of turbofan engines for commercial aircraft. These new technologies (Direct Drive Turbofan, Geared Fan Turbofan and Contra-Rotating Turbofan) will provide a breakthrough in noise and emission reduction.
VITAL will provide a major advance in developing the next generation of commercial aircraft engines. The aim of VITAL is the development and validation of engine technologies that alone will provide the following:
1. 6 dB noise reduction
2. 7% reduction in CO2 emissions
These objectives will be achieved by the design, manufacture and rig scale testing of the following new technologies:
1. Three novel fan architectures
a. Low speed Direct Drive Turbofan (DDTF) b. Geared Turbofan (GTF)
c. Contra Rotating Turbofan (CRTF)
2. Low-pressure compressor concepts and technologies 3. Lightweight structures
4. Shaft technologies
5. Low pressure turbine technologies 6. Optimal installation of VHBR engines
Combining these technologies, noise reduction will be attained without any combustion penalties. In VITAL two different paths will be taken to achieve the main objectives; the first is the increase of BPR to between 9 and 12, considered VHBR values. The second is decreasing the fan tip speed by using new fan technologies, e.g. the Contra Rotating Turbofan (CRTF).
1.1.1 Integration of the Engine into the Airframe
The engines will be installed under the wing. The noise levels will be diminished by the use of innovative technologies in the integration of the engine to the airframe, e.g. chevron nozzles and new concepts of thrust reverser.
For VITAL the most important aspects of the engine/airframe integration is the reduction of emissions and noise with the least number of penalties possible for the performance of the engine. Also the thrust loss due to the installed drag has to be as low as possible in order to avoid extra fuel burning.
1.2
Objectives of the project
The main objectives of the project are the following:
1. Create a methodology for modelling the behaviour of the drag produced by an installed VHBR engine.
2. Create a model of the drag produced by a VHBR engine using the results obtained from CFD calculations. The model could be used in the optimization of a VHBR engine. This model should save time resources because it could be used instead of CFD calculations.
3. To simulate the behaviour of the flow around a nacelle for a VHBR engine at different flight stages and using different geometries for each of the nacelle components.
4. To link drag force with the different parameters considered in the project. These parameters are divided in two categories: nacelle geometry parameters (including Dmax, Dhigh, length, Forebody length and scarf angle) and distance to the wing (including nacelle penetration and vertical distance to the wing). This relationship will allow modelling a correlation of the drag with some parameters related to the installation.
1.3
Contribution to knowledge
The concept of VHBR is currently under development and different issues arise from the research being carried out. One of the main difficulties of this concept is the size of the fan. Some of the most important variables involved in the overall design are the weight and the frontal area of the fan. The integration of the engine to the airframe is essential to take advantage of the benefits obtained from the VHBR concept.
The integration of a VHBR engine requires a highly coupled Wing-Body-Nacelle-Pylon system to avoid the production of undesirable effects. Also, when on the ground, the space available to install the engine is very limited making integration of big engines, like a VHBR engine, a very complex task. For a detailed analysis of a VHBR integration methodology see the work carried out by Berry (1994).
This novel project consists of a study about the influence of the installation of a VHBR engine on the installed thrust by evaluating the drag produced by the engine.
1.3.1 Achievements
Achievement is defined in the Oxford Dictionary (2000) as “a thing that somebody had done successfully, especially using their own effort and skill”. For this project several achievements were reached, not only related to the VITAL project but personal improvement and knowledge. The achievements for the project can be divided in three different groups: 1) project, 2) knowledge and 3) personal achievements.
The project VITAL was not directly linked to the integration of the engine. The large size of the fan required extra activities to be performed in order to include the effect on the performance as was required from the initial objectives of VITAL.
1. The CFD calculations carried out in this project helped to generate the basis for the parametric study required for the optimization analysis of the installed performance of a VHBR engine in the design process.
2. Achievements were made in the improvement of knowledge and ability of the use of Computational Fluid Dynamics, aerodynamics and their application to aircraft propulsion. Before starting the project CFD was seen by the author just as software to obtain data about the fluid dynamics involved in a flow. Now, CFD is understood in detail. Although the codes involved in Fluent (the CFD software used) unknown, the user now knows the calculations involved in it, the models used, the way some approximations are taken, and how to diagnose faults.
3. In the physics area knowledge of aerodynamics has improved, as well as understanding of nacelle design.
4. Analysis of some of the parameters involved in the project highlighted the importance of the small variations in these.
5. The intake as a section of the nacelle and the engine itself were proven to be two of the most important parts of the integration process, a computational error could generate problems with several aspects of the engine like pressure recovery, spillage drag, and structural issues among others.
6. Generated performance data related to drag caused by fore and after body of VHBR turbofan engines by relating various geometric parameters to drag using CFD analysis.
2
Contribution to knowledge
The demand for oil fuels is increasing in the world. One of the biggest goals of engineering and science for the 21st century is to supply energy and reduce the rate of increase of consumption of oil fuels. The optimal use of fuels has become a critical part of engineering in the world. Aeronautics is not the exception, novel concepts of airplanes and engines are appearing in order to reduce the demand of fuels and also make the aeronautical industry more environmentally friendly.
This project was created to complement the VITAL project. VITAL was about creating a VHBR engine with the capabilities of decreasing noise and emissions without compromising fuel consumption (see section 1.1.) The dimensions of the fan proposed by VITAL engineers required a very large fan. A fan of those proportions requires extra research into airframe/engine integration. The research done in this project has never been done before and is a step forward in the research of optimization of VHBR engine integration.
In this project there are two contributions to knowledge. The first and most important is the research into the creation of a methodology for CFD parametric analysis of the nacelle and integration of a VHBR engine. The second contribution to knowledge is taking the first steps to performing parametric drag analysis of VHBR engines.
The VHBR engines are still being developed therefore several aspects of the research are still going in progress. The nacelle is a crucial aspect to allow the engine to be useful in the aeronautic industry. A proper methodology for the analysis of the nacelle and its interactions with the airframe is required in order to get suitable results and the uniform values that allow engineers to compare them. With the methodology planned and used in this project, an analysis was carried out gradually to identify the parameters that have more impact on the drag. The methodology is explained in more detail in section 3. By using CFD a detailed analysis was made on the drag produced by the nacelle of a VHBR engine. The first stages were based on making variations to some of the variables of the geometry of the nacelle (see sections 5 and 6 for more details.) After considering the geometry of the nacelle, the research focused on changing the position with respect to the wing (see section 7 for more details.) This kind of analysis is not available in the public domain. The results are the first steps to comparing the drag which is produced by
VHBR engines. 2D and 3D analysis are required for identifying the main parameters to be analysed in order to get the optimum geometry of the nacelle and its position with respect to the wing.
The two main contributions to knowledge are regarding the VHBR turbofans and aircraft/engine integration. This project also adds more knowledge about CFD applied to aeronautics by evaluating the use of different methods, models and procedures in the simulation and meshing. Drag, as a very crucial part of aeronautics, is analyzed in a detailed way by using CFD.
3
Methodology
The way of evaluating the drag produced by a VHBR nacelle was divided into three stages, each one of them further subdivided in order to get an integrated analysis. The basic structure of the project is as follows:
1. Literature review A. VHBR engines B. Aircraft/Engine integration C. Aerodynamics D. CFD I. Meshing II. Modelling E. Software information I. Fluent II. CATIA 2. 2D analysis A. AB analysis I. Geometry design II. Meshing a. Mesh independence III. Simulation setup
IV. Running Simulation V. Results analysis B. FB analysis
I. Geometry design II. Meshing
a. Mesh independence III. Simulation setup
IV. Running Simulation V. Results analysis 3. 3D isolated nacelle
A. Geometry design B. Meshing
I. Mesh independence C. Simulation setup
D. Running Simulation E. Results analysis
F. Integration of 2D and 3D results 4. 3D integrated nacelle
A. WB analysis
I. Geometry design II. Meshing
a. Mesh independence III. Simulation setup
IV. Running Simulation V. Results analysis B. WBN analysis
I. Geometry design II. Meshing
a. Mesh independence III. Simulation setup
IV. Running Simulation V. Results analysis
5. Evaluation and analysis of all of the results of the project
3.1
Literature review
The first stage of every research project is to know “where we stand.” Researching what is the current position of science and engineering is crucial to avoid repeating work done by other people. Getting the most information about all of the subjects that could be involved about the project is very important.
The main subjects involved are VHBR engines Aircraft/Engine integration, Aerodynamics, CFD, and Software information.
3.2
2D Analysis
The first simulations carried out are 2D simulations of the nacelle divided into two sections, the afterbody (AB) and forebody (FB.) For each one of them an independent
parametric analysis was carried out. The methodology of the analysis for each section, although similar, is described below.
3.2.1 Choosing parameters to be analyzed
Before any computational work could be done the parameters for each section were decided. First some research was carried out looking for the most influential parameters that could influence the drag produced by an isolated engine. Then, based on the information found and the geometry of the engine, which would remain invariable, the parameters were set (for more details see section 5.1.)
3.2.2 Afterbody methodology
The first stage of the afterbody analysis was to generate a geometry based on the dimensions provided by VITAL. As there was no geometry provided by VITAL (just the basic dimensions) several decisions were taken about the profiles to be used.
After having the CAD model of the geometry of the AB, the domain of the simulation was set for the base geometry. To set the domain several options were tried in order to use the most appropriate for the CFD simulations for all of the analysis. Different combinations of mesh structures and domain geometries were tried. For the final structure the mesh independency analysis was done.
After choosing the mesh and domain structure for the base geometry, the geometry of the AB was changed according to the parameter variations previously established. The mesh for all of the geometries was generated using the same meshing structure and dimensions used for the base geometry.
The simulation setup was done with the most basic simulation methods in Fluent. Most of the decisions were based on the models used. The decisions taken were based on trial and error methods looking for the best results and those which consume the least resources. The simulations were run in a parallel solving method. The method was carried out automatically by the software Fluent. For more information see Chapter 31, “Parallel Processing” of Fluent manual (Fluent 6.2 documentation, 2007.)
3.2.3 Forebody methodology
Methodology for the FB was similar to that for the AB. The main difference is the geometry used and the parameters required for its design. Comparing the AB and FB, there are more ways to change the geometry of the intake; therefore there are more available parameters to be analyzed and more possible combinations in the FB than in the AB.
The geometry was generated with CATIA software. The main geometry was created by using the dimensions given by VITAL. The intake profiles are described in section 5.1.1. The profiles were parameterized to allow quick geometry generation. Different geometries were created. A matrix of the geometries to be generated was decided according to the parameters.
The domain for the simulation was generated in a similar way as for the AB. For the FB the mesh generation was more focused on a C-type mesh. Based on this, the shape and size of the mesh blocks for the intake were changed to get the best and fastest results. With the domain and mesh structure already created for the base geometry, the other geometries‟ domains and grids were created using the same structure as the base geometry.
CFD setup was done in a very similar way to the AB so that the results are based on the very similar parameters, models and variables used for running the simulation. Running was also done in a parallel solving method.
3.2.4 Results Analysis
The results were analyzed separately for AB and FB. For each one of them parametric analysis was carried out in order to set the more important parameters influencing the drag. By doing this the parametric analysis for the 3D models would be restricted to the parameters that were found to be more significant for the drag generation.
3.3
3D Isolated Nacelle Analysis
3D parametric analysis was started on the results of the 2D analysis then more parameters were used for designing the entire nacelle. The geometries were created in CATIA. The
mesh for most of the geometries was created in Gambit. CFD simulations were run in Fluent.
3.3.1 CAD geometry generation
One of the major difficulties of the 3D analysis was the geometry generation. There were no CAD models available to work with, therefore, time had to be invested in generating the 3D models.
The main difficulty of creating the 3D geometric models is to link the borders of the curved shapes. Several surfaces are to be joined together and at the borders most of them are to be tangent. The parameterization of the dimensions of the model is an extra issue. By using parameters to create the geometric model the geometries required for the project were able to be created without the necessity of investing time in creating the geometry from scratch. The different geometries were created just by changing one (or two) of the parameter values. Then the software (CATIA) would re-generate all of the geometry. Individual attention had to be paid to the borders of each of the surfaces for all of the geometries. Special care on the border‟s fit and tangency should be taken.
3.3.2 Mesh generation
The mesh was decided to be a symmetric grid to allow a larger mesh and reducing the running time.
Several domain shapes were tried. Also several mesh structures were used to run the simulations. At the end the grid that converged and gave the best results was used. The base geometry was used to design the mesh. The mesh for all of the other geometries was created in the same way as that for the base geometry.
3.3.3 Parametric calculations
The parameters used for the 3D analysis were chosen from the analysis of the results obtained from the 2D simulations. Each of the values of the parameters was based on the base geometry and varied in a percentage set previously. If the resulting drag changed by a large amount then more simulations were to be carried out with different values for the parameter analyzed.
3.3.4 Results analysis
The analysis of every parameter was done individually. Each analysis is performed in several ways. The influence of the each of the parameters in the variations of pressure and viscous forces was analyzed separately. The impact in the different sections of the nacelle and the difference of the crown and keel sections were also considered in the analysis. Drag considerations are very important in engines of the size considered in this project. Individual analysis of the AB, FB and MB as well as separate analysis of the viscous and pressure drag were carried out. To evaluate the drag over the different sections of the nacelle when the nacelle design stage is focusing on one of the design parameters.
3.4
3D Integrated Nacelle Analysis
The Integrated nacelle analysis requires an examination of the airframe to be integrated with the nacelle. Therefore, the first steps in the study of the WBN system is the study of the airframe (WB) it will be working with.
3.4.1 WB Analysis
The analysis of the WB system in this project is a basic CFD study to get the necessary values for comparison with the results of the WBN system. By comparing the CFD results of the WB and WBN conclusions can be taken about the influence of the nacelle on the total drag of the airplane and to calculate the interaction drag.
The airframe geometry required was not available therefore an alternative option was required. The geometry was generously provided by the School of Aeronautics of Cranfield University. The airframe geometry and capabilities of the aircraft were analyzed to evaluate the suitability for this project. The analysis was based on the range, payload and dimensions that the aircraft was designed for.
After evaluating the suitability of the aircraft the geometry was to be simplified in order to be used in a CFD analysis. All of the details of the aircraft as well as many aerodynamic and structural components were removed. The geometry left for the analysis was just the fuselage and the wing. For more details refer to section 7.3.
3.4.1.1 Mesh generation
The simulation is symmetric with respect to the airframe symmetry plane. The domain for the simulation was based on the length of the fuselage. The inlet and outlet of the domain were set far from the wing. The WBN system was also considered for generating the domain because both the WB and WBN meshes were created using similar methodologies.
The meshing of the airframe is based on the wing mesh. The meshing of the leading and trailing edges of the wing generated the mesh for the rest of the wing. Special care was taken in avoiding coarsening of the mesh at the mid sections of the wings to avoid reducing the accuracy in the results. Also, the cell size was set to be fine close to the airframe surfaces to evaluate the small changes close to the airframe and avoid losing accuracy by coarse cells near the airframe surfaces.
3.4.1.2 Simulation running
As there was no information available the flow conditions for the airframe, the conditions for the inflow were the same as the free flow conditions for the VITAL engine. The direction of the flow was set to be coaxial with the fuselage.
3.4.1.3 Results
The results were not analyzed at this stage. At this stage the results of the airframe simulation were just taken in order to be compared with the results of the simulations with the integrated nacelle.
The data obtained from the results are the pressure, viscous and total forces of the top of the wing and under the wing. The wing is divided into top-wing and under-wing by the leading and trailing edges.
3.4.2 WBN Analysis
The methodology for the WBN analysis is based on the isolated nacelle and the WB methodologies combined.
3.4.2.1 Geometry Generation
The geometry required for this stage was already available. The fuselage and wing system was the one used for the WB analysis and the nacelle would be the base geometry used for the isolated nacelle analysis.
The only variations here were not the dimensions of the geometries involved but the relative position of the nacelle from the wing.
3.4.2.2 Mesh Generation
The domain used was the same as the one used for the WB. The mesh was generated in the same way it was for the WB system. The only difference was a finer meshing under the wing near the nacelle.
The meshing on the nacelle surface was considered to be similar to the mesh of the isolated nacelle. The entire geometry of the nacelle would be simulated and not like the isolated nacelle analysis where only one half of the nacelle was required. Working with all of the nacelle would generate a much bigger mesh if the same meshing conditions as for the isolated analysis were used. Unfortunately the resources were not able to handle a mesh with the resulting size. The size of the nacelle surface meshing would be approximately 75% coarser than the mesh of the isolated nacelle.
The meshing of the under-wing and the leading edge near the nacelle would also change from geometry to geometry depending on the closeness of the nacelle. If the nacelle were close to the wing then it would generate a much finer mesh than a nacelle positioned further from the wing.
3.4.2.3 Parameter analysis
The parameters as mentioned previously were not changing the geometry but the positioning of the nacelle. There are five parameters defining the position of an under-wing nacelle. Few of them could be taken into account for the analysis required in this project. Some of these parameters were not able to be used in the parametric analysis and were set as constants.
Due to limitations in computational resources and time, the analysis was not as extensive as in the previous stages of the project. Only two of the five possible parameters were
analyzed because of these limitations. For this reason the parametric analysis was done using a different approach.
After choosing the parameters, the set of possible parameter combinations was made. It was not possible to generate a simulation for every combination. The approach was a follows:
1. Set the values for the parameters to be constant.
2. Set the base geometry. The base geometry was considered to be the VITAL nacelle positioned at the same place as that of the original engine of the aircraft given by the School of Aeronautics.
3. Eliminate the combinations that would be of no use or impossible to run. The geometries with the nacelle too far away from the wing were not run because those positions would be unsuitable due to inadequate ground clearance, structural problems and other issues.
Some of the geometries did not fit under the wing therefore were not considered to be included in the research. Alternative installation architecture would be required in order to analyze the unsuitable positions, such as an embedded engine, unfortunately this analysis is out of the scope of this project.
4. Run the simulations for the base geometry until satisfactory results are obtained. 5. With the same CFD set-up of the base geometry, the geometries with extreme
positioning, the closest and farthest away from the wing, were run. Depending on the result variations other parameter combinations were run. If the variation of the drag result was not significantly changed no more simulations would be done for geometries in that direction.1 After some simulations there would be a good overview of the drag change produced by the positioning of the engine.
3.4.2.4 Simulation set-up
The set-up of the simulation parameters was done using the same models and solvers as for the WB simulation.
1
The significance variation was considered after being compared with the drag variation of the other simulations.
For the engine the cruise conditions were used for setting up the boundary conditions of the engine.
3.4.2.5 Results analysis
The results are analyzed in three different aspects. 1. Total drag at the nacelle
a. Pressure b. Viscous drag 2. Wing drag
a. Pressure distribution 3. Interference drag
The analysis of these aspects enables an overall view of the impact of the engine positioning to be gained.
All of the analyses were done by comparing the results of each simulation with the one obtained from the base geometry. The final results are comparisons of the rate of change of drag with respect to the parameter changed.
The drag of the nacelle just takes into consideration the drag produced on the nacelle surfaces. The forces on the nacelle can be divided into pressure and viscous drag. It is assumed the pre-entry drag would be equal for all of the simulations (the geometry of the nacelle and the operating conditions are the same) therefore the difference of drag would cancel the pre-entry drag value.
The wing drag is calculated including the lift drag (pressure) and viscous drag. Only the forces on the wing surfaces are taken into account. The fuselage is not considered in the analysis.
For the interference drag three different simulations have to be taken into account: the isolated nacelle (base geometry), WB system, and WBN. From the results of each of the simulations some calculations were made. The final results will give an overview of the impact of the positioning of the engine on the interference drag at cruise conditions. For more details about the WB and WBN simulations and results refer to section 7.
4
Literature Review
4.1
VHBR Engine
One of the most important advantages of the Gas Turbine Engine over other power sources is the high power/weight ratio. This is one of the main reasons why in 1929 Sir Frank Whittle submitted to his superiors his idea of using a gas turbine engine instead of piston engines to power aircraft (The Jet engine, 1986). He built his first experimental engine in 1937. From that point on the technologies used in Gas Turbine Engines have been improving to get a better performance.
The performance requirements of the engines vary depending on the type of mission the aircraft will be designed for. For a civil aircraft engine design thrust and fuel consumption are two of the most important parameters to be considered from the performance point of view. The range of an aircraft is defined by the fuel consumption and fuel capacity. Specific Fuel Consumption in turbofan engines is lower than in turbojet engines. (Cohen, 1987)
The optimization of a turbojet is based on two variables mainly; overall pressure ratio (OPR) and turbine inlet temperature (TET). In a turbofan two more variables are included for the optimization, the bypass ratio (BPR) and fan pressure ratio (FPR). Assuming the optimization is done based on getting the lowest SFC possible, there is an optimum FPR value for every BPR. Therefore there are only three performance optimization parameters, Overall Pressure Ratio, Turbine Entry Temperature and Bypass Ratio as can be seen in Figure 4.1 (Cohen, 1987).
The SFC, being one of the most important values due to its direct impact on the cost of using an engine, is constantly being reduced. An important factor for the SFC reduction of the engines used in commercial transports is the BPR. The trend has been toward increasing the BPR to reduce the SFC. As the BPR increases the name given to the engine changes from high bypass ratio (HBR) to very high bypass ratio (VHBR) to ultra high bypass ratio (UHBR) engines. It is not very well established as to what are the boundaries in considering a turbofan as a VHBR engine. Some authors like Hoheisel (1997) do not use the term UHBR turbofans, in his work a geared fan engine is called an Advanced Ducted Propfan. Zimbrick (1990) works with two engines, one with a BPR of 9.6 and the other 17.5 and calls both of them VHBR. On the other hand, Burgsmüller (2000) uses a
HBR, a VHBR and UHBR engines each with a BPR of 5, 9.2 and 16 respectively. Generally Very High Bypass Ratio engines are considered to have a BPR above 9.0 because of the novel technologies required (Lecordix, 1992).
Figure 4.1 Optimization of fan pressure ratio (Cohen, 1987, p. 99)
The VHBR engines certainly lower the fuel consumed by the engine. Colmenares (2007) worked in a model that calculated the feasibility of a geared VHBR engine. His results show an improvement of the levels of SFC, CO2 and noise with a penalty on the NOx
emissions and direct operating cost.
One of the big issues of increasing the BPR above 9.0 is the reduction of the thrust. A VHBR needs a larger amount of airflow going through the fan in order to produce the thrust required to overcome the drag generated by the airframe, therefore the fan diameter is increased. This size increase creates more problems, e.g. larger weight load, drag generated, integration issues2. The major drawback for using Very High Bypass Ratio (VHBR) engines is their size. A VHBR fan produces much more drag than a HBR engine
2The installed performance parameters take into account the effects of the installation of the power
therefore the drag produced has a strong impact on the installed SFC and turning an increase in BPR to be counterproductive in terms of the installed engine performance.
Figure 4.2 Relation between Efficiency and Bypass Ratio (Lecordix, 1992)
The trend to improve the SFC by increasing the BPR will no longer be suitable using the technology available because the installation effects will be unacceptable. There is a value of BPR that will produce a minimum to the SFC; any other value would make the engine consume more fuel. With the current turbofan technology available, an engine with a BPR value close to 9.0 would consume the minimum possible fuel amount (Zimbrick, 1988). Novel technologies for improving the engine performance by increasing the BPR will also increase the size of the entire engine therefore, very high engine/nacelle/airframe integration will be required.
One of the big issues of the VHBR engines is the coupling of the fan and the low pressure turbine (LPT). The size of the fan requires a very large amount of energy extracted from the LPT. This requires more turbine stages or a larger rotational speed of the shaft. A geared fan is a new technology used for large BPR turbofans. Although the gear drive can reduce the efficiency by a small amount it allows the low pressure turbomachinery to operate at higher rotational speeds reducing the stages of the turbine (Koff, 2004).
Another method of increasing the power extracted from the core engine without increasing the airflow is to increase the turbine entry temperature. Unfortunately a higher
TET increases the NOx emissions. High levels of NOx do not comply with environmental regulations (Koff, 2004).
Figure 4.3 Fuel consumption improvements (Burgsmueller, 1996)
4.2
Installation of the propulsion system
There is a distinction between two types of performance of an engine. One is called uninstalled performance which is the ideal performance without taking into account the effects of the nacelle, pylon or wing. The uninstalled performance is the main concern of engine manufacturers and is the data given to aircraft manufacturers. Unfortunately the installation of engines will produce external forces making the total drag increase and consequently decreasing the Net Propulsive Force and increasing the SFC without producing any benefit to the overall performance of the aircraft (Williams, 2006.)
The analysis for the integration of the engine can be done in three separate parts, the forebody, afterbody and midbody (See Figure 4.4). The use of midbody in the design of a nacelle has the advantage of separating the forebody and afterbody, allowing analysing each one of them separately with very little influence. Most modern nacelles are designed without a midbody because the high BPR of the engine requires very large fan diameters; consequently the area of the midbody would be very large and produce high drag.
F u el con sum p tion imp ro ve m ent Performance installed
Without large midbody cowl the interaction between the forebody and afterbody increases, this requires the integration analysis to be for the entire nacelle.
The nacelle forebody is composed mainly of the intake. The primary purpose of the inlet is to change the free stream air to the conditions required for the Low Pressure Compressor (LPC) to work. The cruise speed for a commercial carrier is approximately a Mach number of 0.8. At this speed the fan would not work at its best, because usually the compressors require air flowing at a Mach number of about 0.5. According to Mattingly (2002), the performance of an inlet can be evaluated according to the following characteristics:
Total pressure ratio
Flow matching
Uniformity of flow Installation drag Starting and stability
Signatures (acoustic, radar and infrared)
Weight and cost
Life and reliability
Some of the improvements of these characteristics would be at the expense of others therefore the design process requires a balance of the variables depending on the requirements of the whole system.
The design of the afterbody is focused on the nozzle. For subsonic aircraft the nozzle used is a convergent nozzle due to the low pressure ratio across it. Convergent-divergent nozzle is a very expensive technology due to the extra weight added to the nacelle and the low benefit obtained from it for a subsonic commercial aircraft (Cohen, 1987). The main concern of nozzle designers is thrust, but the boundary layer separation and noise production are also very important. A bad design would produce an early separation of the boundary layer decreasing the pressure behind the nacelle and deliver more drag.
4.2.1Drag
In the work of the Aeronautical Research Council (1958) to set the definitions used in the description and analysis on drag, they have defined the following:
“The Total Drag associated with the external flow is given by the rate of decrease of momentum of the external flow in a direction parallel to the undisturbed stream, this decrease being calculated between stations at infinite distances upstream and downstream of the body” (Aeronautical Research Council, 1958)
In this work other very useful concepts are defined. The forces acting normally and tangential to a surface can be called Normal-Pressure Drag and Surface Friction Drag respectively and the adding of these two results into Total Drag previously defined. Also other definitions are set, Boundary-Layer Drag, Wave Drag, Intrinsic Drag, Pre-entry and Post-exit drag, Spillage drag and Lift Dependent Drag.
In a short cowl nacelle with an exhaust cone, the Drag must be calculated in a different way from a simple exhaust nacelle. The pre-entry forces are calculated by using the stream force theorem. The post-exit forces must be calculated taking into account the forces on the core cowl for the bypass stream tube and the exhaust cone forces in the core stream tube (Williams, 2006).
The spillage drag is the force difference between pre-entry force and the cowl pressure force. At subsonic speeds, when the flow is smooth around the nacelle the pre-entry force and the cowl pressure force are considered to be the same, this makes the spillage drag to
be equal to zero (Seddon, Goldsmith, 1999). What produces spillage drag is the effect of boundary layer separation and shock waves at the intake making the cowl suction force lose its effect.
The drag over a well designed nacelle with the absence of boundary layer separations and shockwaves will be produced almost entirely by viscous forces (Covert, 1985).
4.2.1.1 Drag calculations
Mr. Darrell Williams was a great support to the understanding of the meaning of Drag and the calculation procedure. Drag is not a force for a ducted body. The drag of an engine must be calculated in a different way from the way it is calculated for an airframe. Also depends on the way the force book keeping system is chosen. In Figure 4.5 all of the forces acting on a short cowl nacelle are shown and all of these must be taken into account, either for the thrust or drag. The Net Propulsive Force (NPF) is the most important parameter for an aircraft manufacturer because it is the sum of all of the forces acting on the engine, and depending on the throttle state it will speed up or slow down the airplane. The NPF must be the same for every book keeping system.
The NPF will be chosen based on the Standard Net Thrust (FN) or the Intrinsic Thrust
(Fint) depending what suits the best and makes the calculations easier.
The formulas for thrust and drag calculations are the following:
Standard Net Thrust FN = FG,9 + FG,19 – FG,0 (1)
Intrinsic Thrust Fint = FG,9 + FG,19 – FG,1 (2)
Modified Standard Gross Thrusts F*G,9 = FG,9 – φplug (3)
F*G,19 = FG,19 - φAB (4)
Modified Standard Net Thrust F*N = F*G,9 + F*G,19 – FG,0 (5)
Modified Intrinsic Thrust F*int = F*G,9 + F*G,19 – FG,1 (6)