R E S E A R C H
Open Access
Effect of disturbance on biomass,
production and carbon dynamics in moist
tropical forest of eastern Nepal
Tilak Prasad Gautam
1*and Tej Narayan Mandal
2Abstract
Background:Forest biomass is helpful to assess its productivity and carbon (C) sequestration capacity. Several disturbance activities in tropical forests have reduced the biomass and net primary production (NPP) leading to climate change. Therefore, an accurate estimation of forest biomass and C cycling in context of disturbances is required for implementing REDD (Reducing Emissions from Deforestation and Forest Degradation) policy.
Methods:Biomass and NPP of trees and shrubs were estimated by using allometric equations while herbaceous
biomass was estimated by harvest method. Fine root biomass was determined from soil monolith. The C stock in vegetation was calculated by multiplying C concentration to dry weight.
Results:Total stand biomass (Mg∙ha–1) in undisturbed forest stand (US) was 960.4 while in disturbed forest stand (DS) it was 449.1. The biomass (Mg∙ha–1) of trees, shrubs and herbs in US was 948.0, 4.4 and 1.4, respectively, while in DS they were 438.4, 6.1 and 1.2, respectively. Total NPP (Mg∙ha–1∙yr–1) was 26.58 (equivalent to 12.26 Mg C∙ha–1∙yr–1) in US and 14.91 (6.88 Mg C∙ha–1∙yr–1) in DS. Total C input into soil through litter plus root turnover was 6.78 and 3.35 Mg∙ha–1∙yr–1 in US and DS, respectively.
Conclusions: Several disturbance activities resulted in the significant loss in stand biomass (53 %), NPP (44 %), and C sequestration capacity of tropical forest in eastern Nepal. The net uptake of carbon by the vegetation is far greater than that returned to the soil by the turnover of fine root and litter. Therefore, both stands of present forest act as carbon accumulating systems. Moreover, disturbance reflects higher C
emissions which can be reduced by better management.
Keywords: Tropical forest, Disturbance, Biomass, Production, Carbon cycling, Nepal
Background
Tropical forests play an important role in the global C cycle. They contain about 55 % of global forest C (Pan et al. 2011) and account for 34 % of terrestrial gross primary production (Beer et al. 2010). Carbon is stored in forests mainly in biomass and soils. The C dynamics of a forest reflects environmental condi-tions such as climate, soil, structure, nutrient avail-ability and disturbance (Chave et al. 2001). Forest disturbances often lead to the changes in species composition, structure, stand biomass, productivity
and C cycling. Therefore, a small disruption in trop-ical forests might result in a significant change in the global C cycle.
Biomass and production are important parameters for understanding the functioning of a forest ecosys-tem. Studies on biomass help to assess the effect of disturbances on productivity, C dynamics, nutrient cycling and stability of forest stands. Primary produc-tion is usually regulated by the availability of nutri-ents. Decomposed fine roots and aboveground litter are the sources of nutrients in the soil. The contribu-tion of fine roots in the C and nutrients input to soil is equivalent or even higher to that from leaf litter in tropical moist forests (Roderstein et al. 2005).
* Correspondence:[email protected]
1Department of Botany, Mahendra Morang Adarsha Multiple Campus,
Tribhuvan University, Biratnagar, Nepal
Full list of author information is available at the end of the article
Precise quantification of forest biomass, produc-tion, and C stock demands the careful estimation of both the aboveground and belowground aspects. Despite this requirement, most of the past studies in tropical forests are found to be limited to analyzing the aboveground systems (Chave et al. 2008; Djomo et al. 2011; Malhi et al. 2011; Doughty et al. 2013; Ngo et al. 2013; Girardin et al. 2014; Malhi et al. 2014) and only a few studies concern to the below-ground aspects (Ibrahima et al. 2010; Powers and Perez-Aviles 2013; Noguchi et al. 2014).
In Nepal, only few studies have been conducted re-garding the biomass, production, and C sequestra-tion in tropical forests (Mandal 1999; Baral et al. 2009). More information is required to understand the structure and functioning of the forests. Present study was designed in tropical forest of eastern Nepal with the following specific objectives: a) to es-timate the biomass and production of herb, shrub and tree species; b) to find out the effect of disturb-ance on biomass, production and C dynamics.
Methods
Study area
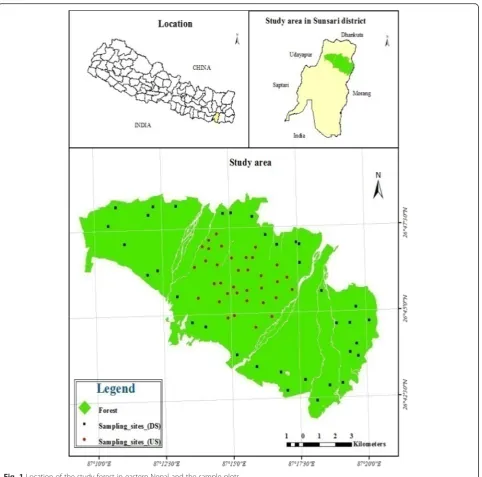
The study was conducted in a Sal (Shorea robusta) dominated moist tropical forest of Sunsari District, eastern Nepal (latitude 26°41’N to 26°50’N and longi-tude 87°09’E to 87°21’E), within the altitude range of 220 to 370 m above msl (Fig. 1). The forest lies in the catchment area of Koshi River, one of the largest rivers in Nepal. The total area occupied by the forest is 11394 ha.
The central part (core area) of the forest is rela-tively undisturbed, while the peripheral part is af-fected by disturbance activities as removal of timber, livestock grazing, fuel-wood and litter collection, tree lopping, removal of poles for house-hold construc-tions and forest fires. These disturbances have caused deforestation, forest fragmentation and degradation and subsequent invasion of exotic species like Mika-nia micrantha, Lantana camara, and Chromolaena odorata, which adversely affect the native plant diver-sity in the forest.
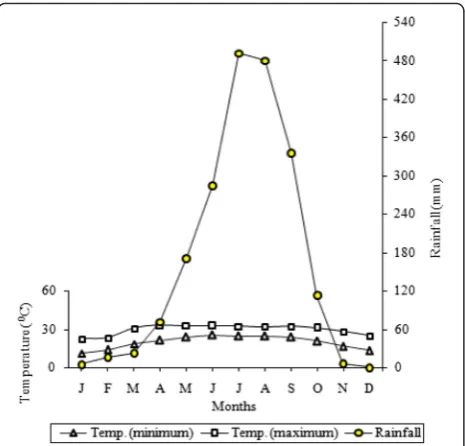
The climate is tropical and monsoon type with three distinct seasons: dry and warm summer (March to May), wet and warm rainy (June to October), and dry and cool winter (November to February). The mean monthly mini-mum and maximini-mum air temperature during 2005–2014 ranged from 10.9 °C to 25.3 °C and 22.6 °C to 33.2 °C, re-spectively. The average annual rainfall for the period was 1998.6 mm (Fig. 2). Relative humidity was higher in rainy season with highest value in August (92 %).
The forest is bordered by the Siwalikhill in the north and the Gangetic alluvial plains in the south. The area
has been formed from soft erodible sediments of the
Siwaliks and is characterized by the presence of boulder beds mixed with sand, silt, clay imparting a porous na-ture. The soil mainly consists of deep alfisols.
The forest tree layer is dominated by Sal. Other main associates are Haldina cordifolia, Lagerstroemia parviflora, and Terminalia alata. Clerodendron visco-sum and Murraya koenigii are some of the main shrub species while Chromolaena odorata and Achyr-anthes aspera are dominant herbs.
Plant biomass estimation
The forest was divided into 2 parts: i) the relatively undisturbed core area (treated as undisturbed stand; US), and ii) the disturbed peripheral area (treated as disturbed stand; DS). Because of the following char-acters the core area was considered as US: canopy
area ranged between 153.8 and 226.9 m2, crown
cover ranged from 70–80 %, density of the tree was 466.4 individuals∙ha−1 and tree stumps were absent. The peripheral part of the forest is disturbed be-cause of following characters: canopy area ranged between 28.3 and 77.5 m2, crown cover ranged from 30–40 %, tree density was 234.3 individuals∙ha−1 and tree stump density was 70 stumps∙ha−1.
The tree biomass contained within US was esti-mated using 35 randomly established sample plots of 20 m × 20 m size determined by species-area curve method. Same size was applied for DS as well. For the estimation of shrub and herb biomass nested quadrats of 5 m × 5 m and 1 m × 1 m were used, re-spectively. Girths of all the trees (>10 cm gbh) at breast height (1.37 cm above the soil) and of shrubs (10 cm above the ground level) present in each of the sample plots were measured. Density (individual per hectare) and basal area (girth2∙(4π)−1) of the trees within plots were determined. Biomass of trees was estimated by using girth:biomass allometric equations (Singh and Singh 1992; Mandal 1999). For estimating coarse root biomass, root:shoot ratio of 0.21 proposed for lowland tropical forests was used (Malhi et al. 2009; Malhi et al. 2014).
The aboveground herbaceous biomass present in the sampling plots was harvested twice, in summer (May 2012) and at the end of rainy season (Septem-ber 2012). Summer and rainy season values were av-eraged to obtain annual mean herbaceous biomass.
Fine roots (<5 mm diameter) were collected from seventy randomly established sample plots, thirty five each in US and DS. Fine root biomass (FRB) was determined from soil monolith (10 cm × 10 cm ×
30 cm), divided into two depth ranges (upper: 0–
winter (January 2012) seasons. Summer, rainy and winter season values were averaged to obtain annual mean FRB.
Litterfall and litter mass
For the estimation of litterfall one litter trap (1 m × 1 m) was fixed on the forest floor at each of the
sev-enty sampling plots. Litterfall was collected at
monthly intervals from April 2011 to March 2012 and categorized into leaf and non-leaf components. Litter mass accumulated at each sampling plot was collected once every season from one 1 m × 1 m plot.
The turnover rate of litter was calculated according to Jenny et al. (1949).
Net production
Using the allometric equations, the aboveground biomass (AGB) of different components of marked trees/shrubs in permanent sampling plots was computed for 2011 (B1) and 2012 (B2) from respective girth measurements. The net changes in biomass (ΔB=B2 – B1) of components yielded annual biomass increments which were summed to get the net AGB accretion in the trees/shrubs. Above-ground herbaceous net production was estimated as the
differences between maximum and minimum biomass values through the year.
The annual leaf fall was added to the foliage bio-mass accumulation to represent leaf production, and wood and miscellaneous litterfall values were added to the biomass accumulation in twigs (Singh et al. 1994). Coarse root production was estimated as a fraction of stem production (Malhi et al. 2009; Malhi et al. 2014). Fine root production (FRP) was esti-mated as the differences between maximum (rainy season values) and minimum (summer season values) biomass values. The fine root turnover was calcu-lated as a ratio of its production and annual mean biomass (Srivastava et al. 1986).
Carbon estimation in vegetation and litter
Samples of different tree, shrub and herb (above-ground) components of all species were collected from each sampling plot. The litter (leaf and non-leaf ) and fine root (< 2 and 2–5 mm diameter) sam-ples were also collected. All the samsam-ples were oven dried at 80 °C to constant weight, powdered and used separately for C analyses.
Carbon present in plant materials was estimated by ash content method. Carbon concentrations were as-sumed to be approximately 50 % of ash free weight (McBrayer and Cromack 1980). In this method oven dried plant components (stem, branch, root, leaf, and litter) were burnt separately in electric furnace at 400 °C. Ash content (inorganic elements in the form of oxides) left after burning was weighed and
carbon concentration was calculated by using the following equation:
%Carbon ¼ðInitial weight–Ash weightÞ
100=2 ð1Þ
The C stock in vegetation was calculated by multiply-ing C concentration (a conversion factor) to dry weight. A conversion factor of 0.470 was used to convert above-ground and coarse root biomass to C. To obtain C stock in fine roots a conversion factor of 0.430 and 0.455 was used for < 2 and 2–5 mm size class, respectively. The conversion factors of 0.453 and 0.468 were used for leaf and non-leaf litter, respectively.
Soil sampling and carbon estimation
Soil samples were collected from 70 randomly se-lected pots (35 each in US and DS). Soil was col-lected from three pits (10 cm × 10 cm × 30 cm each) from each plot. The soils of three pits were mixed and pooled as one replicate (Singh et al. 2001). Bulk density (BD) was determined by using a metallic tube while soil organic carbon (SOC) by dichromate oxida-tion method (Kalembasa and Jenkinson 1973). Carbon content in soil (Mg C∙ha−1 soil) was calculated using the formula:
C ¼ SOC soil depth BD ð2Þ
where SOC is soil organic carbon in % and BD is bulk density (g∙cm−3).
Statistical analysis
Statistical tests were carried out in MS excel 2007 and SPSS (IBM Statistics, ver. 20) packages. All the data were normally distributed except that of basal area of trees which were log transformed before ana-lysis. Pearson’s correlation coefficients were obtained between normal and linear data of biomass, net pro-duction, stand density and basal area of trees.
Stu-dents T-test was performed to compare the mean
biomass and production of trees between US and DS.
Results
Plant biomass
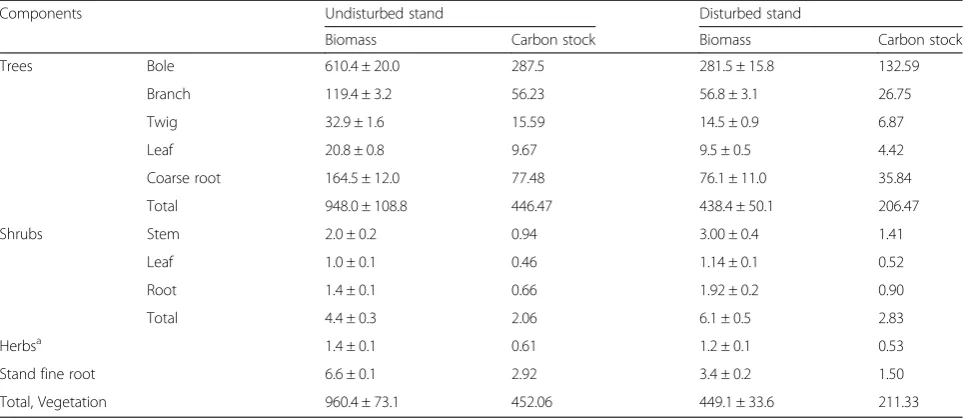
The biomass and C stocks of trees, shrubs, herbs and fine roots are summarized in Tables 1 and 2. The es-timated total biomass for the US was 960.4 Mg∙ha–1 (equivalent to 452.06 Mg C∙ha–1), while for DS it was 449.1 Mg∙ha–1(equivalent to 211.33 Mg C∙ha–1).
The total biomass (Mg∙ha–1) of the tree layer in US and DS was found to be 948.0 and 438.4, respectively. The tree biomass in the US and DS was significantly differ-ent (P< 0.001 at 95 % confidence level). Of the total tree biomass, 83 % was aboveground and 17 % belowground
Fig. 2Ombrothermic representation of the climate in tropical moist forest region of eastern Nepal. The data pertain to the
(excluding fine root) in both the stands. The maximum contribution to tree AGB was made by bole in both stands (64 % each) and minimum by foliage (2 % each in both stands).
The shrub biomass (Mg∙ha–1) showed increasing trend from 4.4 at US to 6.1 at DS. Contribution of shrub bio-mass to the total stand biobio-mass was higher in DS (1.4 %) than US (0.5 %). The aboveground herbaceous biomass contributed 0.1 % in US and 0.3 % in DS. The fine roots shared 0.7–0.8 % to total stand biomass. The annual FRB was lower in DS by 49.5 %.
Litterfall
The total annual litterfall (Mg∙ha−1∙yr−1) was 11.8 in US and 5.4 in DS. Leaves accounted for 69 % (US) to 76 % (DS) of total litterfall while non-leaf litter formed the rest. The total litter mass (Mg∙ha−1) comprised 6.7 in US and 3.6 in DS. The turnover rate (per yr) of the total litter ranged from 0.79 in DS to 0.83 in US.
Net production
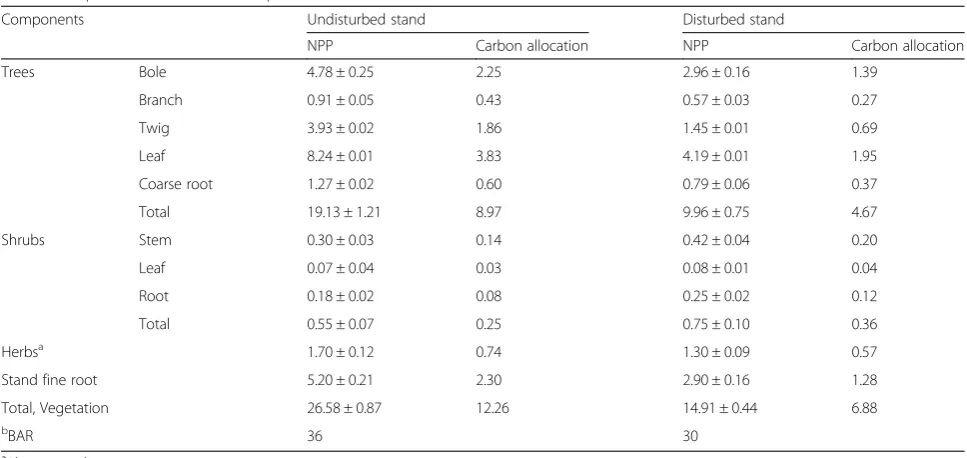
The total NPP (Mg∙ha–1∙yr–1) of the forest was 26.6 (equivalent to an annual C sequestration of 12.26 Mg
C∙ha–1∙yr–1) in US and 14.9 (i.e. 6.88 Mg C∙ha–1∙yr–1) in DS (Table 3). Among the different life forms: tree, shrub, and herb comprised 72 %, 2 %, and 6 % of NPP in US and 67 %, 5 %, and 9 % in DS, respectively; while rest 20 % NPP in US and 19 % in DS were contributed by stand fine root.
The contribution in NPP by different components of trees was in the order leaf > bole > twig > coarse root > branch, in both stands (Table 4). The most prominent C sink was found to be leaf that accounted for 42–43 % of the total NPP. For shrub, maximum contribution to NPP was made by stem in both stands and minimum by foliage. The NPP of herbs (aboveground) ranged be-tween 1.3 and 1.7 Mg∙ha–1∙yr–1 in DS and US, respect-ively (Table 3).
Total aboveground NPP (Mg∙ha–1∙yr–1) combining tree, shrub and herb were 19.93 in US and 10.97 in DS. In belowground parts, percentage allocation of NPP was up to 25 % of total NPP (26.58 Mg∙ha–1∙yr–1) in US and 26 % (3.94 Mg∙ha–1∙yr–1) in DS (Table 5). Of this, both tree and shrub’s coarse root contributed about 21 and 26 % to total belowground NPP in US and DS, respect-ively; whereas fine root comprised nearly 79 % of below-ground NPP in US and 74 % in DS.
Table 1Oven-dried stand biomass (Mg∙ha−1) and carbon stock (Mg C∙ha−1) in moist tropical forest of eastern Nepal
Components Undisturbed stand Disturbed stand
Biomass Carbon stock Biomass Carbon stock
Trees Bole 610.4 ± 20.0 287.5 281.5 ± 15.8 132.59
Branch 119.4 ± 3.2 56.23 56.8 ± 3.1 26.75
Twig 32.9 ± 1.6 15.59 14.5 ± 0.9 6.87
Leaf 20.8 ± 0.8 9.67 9.5 ± 0.5 4.42
Coarse root 164.5 ± 12.0 77.48 76.1 ± 11.0 35.84
Total 948.0 ± 108.8 446.47 438.4 ± 50.1 206.47
Shrubs Stem 2.0 ± 0.2 0.94 3.00 ± 0.4 1.41
Leaf 1.0 ± 0.1 0.46 1.14 ± 0.1 0.52
Root 1.4 ± 0.1 0.66 1.92 ± 0.2 0.90
Total 4.4 ± 0.3 2.06 6.1 ± 0.5 2.83
Herbsa 1.4 ± 0.1 0.61 1.2 ± 0.1 0.53
Stand fine root 6.6 ± 0.1 2.92 3.4 ± 0.2 1.50
Total, Vegetation 960.4 ± 73.1 452.06 449.1 ± 33.6 211.33
a
Aboveground parts
Table 2Carbon stock (Mg C∙ha−1) estimates for undisturbed and disturbed stands of moist tropical forest of eastern Nepal
Component Undisturbed stand Disturbed stand
Carbon stocks % of total Carbon stocks % of total
Aboveground biomass 371.0 68.7 173.1 64.0
Coarse roots 78.1 14.5 36.7 13.6
Fine roots 2.9 0.5 1.5 0.5
Soil (to 30 cm depth) 88.1 16.3 59.3 21.9
Considering both depths, average turnover rate (per yr) of smaller fine roots (0–2 mm diameter) was 0.75 in US and 0.86 in DS, whereas it was 0.74 and 0.76 for larger size class (2–5 mm) in US and DS, respectively. The biomass accumulation ratio (biomass/net production) decreased to 30 due to the consequences of forest disturbance in DS, while this value was higher (36) in US. Net production of trees was significantly higher in US than DS (P< 0.001). Positive correlations were found between stand dens-ity, basal area, biomass and NPP of trees in both stands (Table 5).
Carbon budget and flux
The dry matter values for standing crops, net produc-tion, litterfall etc. of both undisturbed and disturbed stands were converted to C (Figs. 3 and 4). Aboveground C storage in both stands was 82 % of the total C in vege-tation and 64–69 % of that stored in stand (vegetation plus soil). The forest received a C input through NPP of 12.26 Mg∙ha–1∙yr–1 in US and 6.88 Mg∙ha–1∙yr–1in DS. Of this, 69 % was associated with aboveground and 31 % with root NPP in US while in DS, contributions from aboveground and root parts to total NPP was 67 and 33 %, respectively.
Wood (bole plus branch) and roots accounted for 47 % (in US) to 53 % (in DS) of the total C input, the remaining 53 % in US and 47 % in DS being utilized for Table 3Net primary production (NPP; Mg∙ha−1∙yr−1) and carbon allocation (Mg C∙ha−1∙yr−1) in different components of vegetation in moist tropical forest of eastern Nepal
Components Undisturbed stand Disturbed stand
NPP Carbon allocation NPP Carbon allocation
Trees Bole 4.78 ± 0.25 2.25 2.96 ± 0.16 1.39
Branch 0.91 ± 0.05 0.43 0.57 ± 0.03 0.27
Twig 3.93 ± 0.02 1.86 1.45 ± 0.01 0.69
Leaf 8.24 ± 0.01 3.83 4.19 ± 0.01 1.95
Coarse root 1.27 ± 0.02 0.60 0.79 ± 0.06 0.37
Total 19.13 ± 1.21 8.97 9.96 ± 0.75 4.67
Shrubs Stem 0.30 ± 0.03 0.14 0.42 ± 0.04 0.20
Leaf 0.07 ± 0.04 0.03 0.08 ± 0.01 0.04
Root 0.18 ± 0.02 0.08 0.25 ± 0.02 0.12
Total 0.55 ± 0.07 0.25 0.75 ± 0.10 0.36
Herbsa 1.70 ± 0.12 0.74 1.30 ± 0.09 0.57
Stand fine root 5.20 ± 0.21 2.30 2.90 ± 0.16 1.28
Total, Vegetation 26.58 ± 0.87 12.26 14.91 ± 0.44 6.88
b
BAR 36 30
a
Aboveground parts b
BAR: Biomass accumulation ratio (biomass/annual net production)
Table 4Net production (Mg∙ha−1∙yr−1) of trees and shrubs and their distribution (%) in different components in moist tropical forest of eastern Nepal
Components Forest stands
Undisturbed Disturbed
Trees 19.13 ± 1.21 9.96 ± 0.75
Bole (%) 25 30
Branch (%) 5 6
Twig (%) 20 14
Leaf (%) 43 42
Coarse root (%) 7 8
Shrubs 0.55 ± 0.07 0.75 ± 0.10
Stem (%) 54 56
Leaf (%) 13 11
Root (%) 33 33
Table 5Pearson’s correlations between stand density, basal area, biomass and net production of trees in undisturbed and disturbed stands of moist tropical forest in eastern Nepal
Density Basal area Biomass
Undisturbed stand
Basal area 0.293
Biomass 0.251 0.902b
Net production 0.725b 0.210 0.279
Disturbed stand
Basal area 0.116
Biomass 0.221 0.926b
Net production 0.788b 0.347a 0.525b
b
Correlation is significant at the 0.01 level (2-tailed) anda
the extension of the photosynthetic parts (tree and shrub foliage plus herbaceous shoots). The input from the foliage compartment to the litter compartment was 3.90 Mg∙ha–1∙yr–1 (equivalent to 100 % of herbaceous aboveground production plus 86 % of foliage production) in US while it was 2.17 Mg∙ha–1∙yr–1for DS. About 14 % (0.51 Mg∙ha–1∙yr–1in US and 0.26 Mg∙ha–1∙yr–1in DS) of foliage production did not find its way into leaf litterfall.
Carbon addition to the soil through the turnover of roots and aboveground litter amounted to 1.98 and 4.80 Mg∙ha–1∙yr–1, respectively in US (fine root and litter turnover were 86 and 83 % per yr, respectively). Similarly, C input due to the turnover of roots and aboveground litter was 1.05 and 2.30 Mg∙ha–1∙yr–1, respectively in DS (fine root and litter turnover were 82 and 79 % per yr, respectively). Evidently, contribu-tion of belowground plant parts to soil C is substan-tial, representing 29 and 32 % of the total input in US and DS, respectively.
Discussion
Biomass and production
The average biomass of the vegetation in both US and DS was 704.8 Mg∙ha–1(331.7 Mg C∙ha–1). More than double biomass in US as compared to DS may be related to the presence of more trees of larger girth classes. The lower biomass in DS may be the result of lower density of trees (234 individuals∙ha–1) compared to US (466 individuals∙ha– 1
). It may also be associated with disturbance activities like tree felling and removing for timber, firewood collection, lopping, grazing, and selective logging.
Biomass allocated to shrub was higher in DS than US. It may be the result of their ability to utilize the space and resource created by disturbances. The higher biomass of herbs in US as compared to DS may be due to the nutri-ent rich soil at this stand (Gautam and Mandal 2013). The different causes are put forward by different workers re-garding the accumulation of biomass in the forest. Mean annual precipitation explains 55 % of the variation in bio-mass in seasonally dry tropical forests (Becknell et al. 2012). The available nutrients, soil, land use history, spe-cies composition and stand age are also responsible for the remaining variations (Powers et al. 2009).
Most of the C stock in the forest was associated with AGB (64–69 %). Belowground biomass and soil up to the depth of 30 cm contained 31 to 36 % C stock. Past study also found 33 % C in top soil of 1 m in primary tropical forest of Singapore (Ngo et al. 2013). Globally, tropical forests store about 50 % C in AGB and next 50 % within 1 m soil (Dixon et al. 1994). The contribu-tion of these pools to the total C stocks varies among the sites. For example, an African moist tropical forest had more than three times as much C in AGB as in soil to 1 m depth (Djomo et al. 2011), while a Peruvian mon-tane forest had twice as much C in soil as in AGB (Gib-bon et al. 2010). Two Asian forests, a tropical seasonal forest in China (Lü et al. 2010) and a lowland diptero-carp forest in Malaysia (Saner et al. 2012) store twice as much C in biomass as in soil. The contribution of leaf fall to total litterfall in the present study (69 % at US and 76 % at DS) is in the range of past studies in tropical for-ests (72–74 %) (Girardin et al. 2014; Malhi et al. 2014).
Fig. 3Compartment model showing annual carbon budget for the undisturbed stand of the moist tropical forest of eastern Nepal. Values in ‘tanks’represent average carbon content (Mg∙ha–1). The foliage compartment also includes aboveground standing crop of herbs, and the root compartment includes coarse roots as well as fine roots. Net annual fluxes between the compartments are given on
arrows (Mg∙ha–1∙yr–1)
Fig. 4Compartment model showing annual carbon budget for the disturbed stand of the moist tropical forest of eastern Nepal. Values in ‘tanks’represent average carbon content (Mg∙ha–1). The foliage
compartment also includes aboveground standing crop of herbs, and the root compartment includes coarse roots as well as fine roots. Net annual fluxes between the compartments are given on
The data obtained for NPP are comparable with the different tropical forests of world (Table 6). Al-though having higher biomass, the NPP of present forest is relatively low indicating its maturity. Gener-ally, in old growth tropical forests the NPP remains either stationary or decreases with age. The higher NPP of some old tropical forests may be linked to forest dynamics. The more dynamic forests favor fas-ter growing trees and species with lower biomass and maintenance costs (Malhi et al. 2009).
Aboveground NPP of US (8.54 Mg C∙ha−1∙yr–1, ex-cluding herbs) is comparable with the tropical forests of world while quite low than the eastern Amazonian forest (Doughty et al. 2013). Moreover, aboveground NPP of DS (4.54 Mg C∙ha−1∙yr–1, excluding herb) is near to paleotropical forests, and mean of the world tropical forests. As far as the belowground NPP is concerned (1.77–2.98 Mg C∙ha−1∙yr–1), it is compar-able to the Amazonian tropical forest (Tcompar-able 6).
Disturbance affects the NPP either by increasing re-source availability or through the changes in functional properties of community. The disturbance results in canopy opening, which increases availability of light, favor new leaf production, and finally above-ground allo-cation increases (Aragão et al. 2009). But in the present study, percentage allocation to aboveground parts was almost same in both US and DS. It may be the result of severe lopping activities in DS, which is also indicated by less percentage of NPP allocation to twig and leaf, and higher percentage allocation to bole and branch in DS. Relatively higher percentage of NPP in coarse root of DS indicated higher allocation to root to collect more water and nutrients from nutrient deficient soil.
Among different components of trees, leaf accounted highest percentage (43 % in US and 42 % in DS) of tree NPP. It was almost similar to the earlier findings for tropical forests (Hertel et al. 2009; Doughty et al. 2013). A global dataset of NPP allocation in tropical forests re-ported 34 % in canopy, 39 % in wood, and 27 % in fine roots (Malhi et al. 2011). Present data of US, excluding herb NPP, also showed almost same pattern of allocation
(33 % canopy, 46 % woody tissue including coarse root, and 21 % fine roots).
Higher allocation of NPP in shrubs of DS as compared to that of US may be due to open canopy created as a result of logging and lopping of trees. The higher NPP of herbs in US might be associated with higher moisture and nutrients due to accumulation of more litter on the soil. Fine root, although sharing a very small percentage to total plant biomass, is one of the major belowground components of the NPP. In present study, FRB shared less than 1 % to total biomass but contributed 19–20 % to total NPP. The estimated FRP in this study was within the ranges of 1.1–6.2 Mg∙ha−1∙yr–1 for global tropical forests (Vogt et al. 1986).
Carbon budget and flux
Aboveground C storage in both stands was 82 % of the total stored in vegetation and 64–69 % of that stored in the stand (vegetation plus soil). These values compare with the aboveground storage of 83 % vege-tation C and 51 % stand C in a dry tropical forest in India (Singh and Singh 1991). As in other tropical forests, relatively higher contribution of aboveground parts to the stand C in present case may be due to the presence of large sized trees with wide canopy.
The contribution of aboveground (74–75 %) and
root (25–26 %) parts to stand NPP in both forest stands is comparable to 72 % NPP for aboveground parts (Singh and Singh 1991). The higher contribution of wood parts to the total C input as compared to fo-liage in DS may be due to the lopping of branches and twigs. On the other hand, closed canopy of trees in US accounted for higher input of foliage C com-pared to wood.
The transfer of C from foliage compartment to the litter compartment involved 100 % of herbaceous aboveground production plus 86 % of foliage produc-tion while the remaining amount, i.e., about 14 % of foliage production did not find its way into leaf litter-fall. It happens due to the losses during senescence (Singh and Singh 1991).
Table 6Net primary production (NPP) of different forests of the World
Locality and forest types NPP (Mg C∙ha−1∙yr−1) References
Aboveground Belowground Total
Amazonia – – 10.0–14.4 (Malhi et al.2009)
Peru (W. Amazonia) – – 14.2–15.1 (Malhi et al.2014)
Global (Old tropical) – – 3.1–21.7 (Chave et al.2001)
Central French Guiana (Lowland tropical rain) 8.81 – – (Chave et al.2008)
Africa (Tropical) – – 11.51 (Bombelli et al.2009)
Nepal (Moist tropical Plateau Sal) 14.89 7.21 22.1 ± 1.4 (Mandal1999)
Litterfall and FRB are important vectors of nutrient recycling in forest ecosystems. Their turnover is usu-ally determined by species, age groups, canopy cover, weather conditions and biotic factors. Total C input into soil through litter plus root turnover was 6.78 and 3.35 Mg∙ha–1∙yr–1 in US and DS, respectively, suggesting substantial retention of C in the vegetation over in annual cycle (45 % in US and 51 % in DS). It indicates that the present forest is C-accumulating system, acting as a significant global C sink, as other wet tropical forests (Pan et al. 2011).
Conclusions
The present study indicated that various types of an-thropogenic disturbances have altered the structure and functioning of the economically important Sal-dominated forest. Although in having higher bio-mass, the NPP of present forest is relatively low in-dicating its maturity. Several disturbance activities like lopping, fodder collection, litter removal, grazing etc. result in the significant loss in stand biomass (53 %) and net production (44 %). Due to forest dis-turbance C stock and C sequestration capacity are reduced which reflects the higher C emissions. From the management point of view, better policy to re-duce the C emission through vegetation should be formulated as per the objective of REDD+. In spite of this, both stands of this forest appear to act as C-accumulating system, an important global C sink.
Abbreviations
AGB:aboveground biomass; DS: disturbed forest stand; NPP: net primary production; US: undisturbed forest stand.
Competing interests
The authors declare that they have no competing interests.
Authors’contributions
TP carried out field and laboratory works, analyzed data, designed and drafted the manuscript. TN designed and supervised the research. Both authors read and approved the final manuscript.
Authors’information
1) TP participated in this research as a doctoral student. At present, he is working as Associate Professor in the Department of Botany, Mahendra Morang Adarsha Multiple Campus, Tribhuvan University, Biratnagar, Nepal. 2) TN is a professor of Botany in Post Graduate Campus, Tribhuvan University, Biratnagar, Nepal.
Acknowledgements
The authors are grateful to the Head, Department of Botany, Post Graduate Campus, Tribhuvan University, Biratnagar, Nepal for providing laboratory and library facilities. First author is thankful to the University Grants Commission, Nepal for Scholarship. Our heartfelt thanks go to Mr. KP Bhattarai who helped in data collection and laboratory analysis.
Author details
1Department of Botany, Mahendra Morang Adarsha Multiple Campus,
Tribhuvan University, Biratnagar, Nepal.2Department of Botany, Post
Graduate Campus, Tribhuvan University, Biratnagar, Nepal.
Received: 10 February 2016 Accepted: 18 April 2016
References
Aragão LEOC, Malhi Y, Metcalfe DB, Silva-Espejo JE, Jiménez E, Navarrete D, Almeida S, Costa ACL, Salinas N, Phillips OL, Anderson LO, Alvarez E, Baker TR, Goncalvez PH, Huamán-Ovalle J, Mamani-Solórzano M, Meir P, Monteagudo A, Patiño S, Peñuela MC, Prieto A, Quesada CA, Rozas-Dávila A, Rudas A, Silva JA Jr, Vásquez R (2009) Above- and below-ground net primary productivity across ten Amazonian forests on contrasting soils.
Biogeosciences 6:2759–2778
Baral SK, Malla R, Ranabhat S (2009) Above-ground carbon stock assessment in different forest types of Nepal. Banko Jankari 19:10–14
Becknell JM, Kissing Kucek L, Powers JS (2012) Aboveground biomass in mature and secondary seasonally dry tropical forests: A literature review and global synthesis. For Ecol Manag 276:88–95
Beer C, Reichstein M, Tomelleri E, Ciais P, Jung M, Carvalhais N, Rodenbeck C, Altaf Arain M, Baldocchi D, Bonan GB, Bondeau A, Cescatti A, Lasslop G, Lindroth A, Lomas M, Luyssaert S, Margolis H, Oleson KW, Roupsard O, Veenendaal E, Viovy N, Williams C, Woodward FI, Papale D (2010) Terrestrial gross carbon dioxide uptake: global distribution and covariation with climate. Science 329:834–838
Bombelli A, Henry M, Castaldi S, Adu-Bredu S, Arneth A, de Grandcourt A, Grieco E, Kutsch WL, Lehsten V, Rasile A, Reichstein M, Tansey K, Weber U, Valentini R (2009) The sub-Saharan Africa carbon balance, an overview. Biogeosci. Discuss 6:2085–2123.
Chave J, Olivier J, Bongers F, Châtelet P, Forget P-M, van der Meer P, Norden N, Riera B, Charles-Dominique P (2008) Above-ground biomass and productivity in a rain forest of eastern South America. J Trop Ecol 24:355–366
Chave J, Riera B, Dubois MA (2001) Estimation of biomass in a Neotropical forest of French Guiana: Spatial and temporal variability. J Trop Ecol 17:79–96 Dixon RK, Solomon AM, Brown S, Houghton RA, Trexler MC, Wisniewski J (1994)
Carbon pools and flux of global forest ecosystems. Science 263:185–190 Djomo AN, Knohl A, Gravenhorst G (2011) Estimations of total ecosystem carbon
pools distribution and carbon biomass current annual increment of a moist tropical forest. For Ecol Manag 261:1448–1459
Doughty CE, Metcalfe DB, da Costa MC, de Oliveira AAR, Neto GFC, Silva JA, Aragão LEOC, Almeida SS, Quesada CA, Girardin CAJ, Halladay K, da Costa AC, Malhi Y (2013) The production, allocation and cycling of carbon in a forest on fertile terra preta soil in eastern Amazonia compared with a forest on adjacent infertile soil. Plant Ecol Diversity 7:41–53
Gautam TP, Mandal TN (2013) Soil characteristics in moist tropical forest of Sunsari district, Nepal. Nepal J Sci Tech 14:35–40
Gibbon A, Silman MR, Malhi Y, Fisher JB, Meir P, Zimmermann M, Dargie GC, Farfan WR, Garcia KC (2010) Ecosystem carbon storage across the grassland– forest transition in the high Andes of Manu National Park, Peru. Ecosystems 13:1097–1111
Girardin CAJ, Espejob JES, Doughty CE, Huasco WH, Metcalfe DB, Durand-Baca L, Marthews TR, Aragao LEOC, Farfán-Rios W, García-Cabrera K, Halladay K, Fisher JB, Galiano-Cabrera DF, Huaraca-Quispe LP, Alzamora-Taype I, Eguiluz-Mora L, Salinas-Revilla N, Silman MR, Meir P, Malhi Y (2014) Productivity and carbon allocation in a tropical montane cloud forest in the Peruvian Andes. Plant Ecol Diversity 7:107–123
Hertel D, Moser G, Culmsee H, Erasmi S, Horna V, Schuldt B, Leuschner C (2009) Below- and above-ground biomass and net primary production in a paleotropical natural forest (Sulawesi, Indonesia) as compared to neotropical forests. For Ecol Manag 258:1904–1912
Ibrahima A, Mvondo ZEA, Ntonga JC (2010) Fine root production and distribution in the tropical rainforests of south-western Cameroon: effects of soil type and selective logging. iForest: Biogeosc For 3:130–136
Jenny H, Gessel SP, Bingham FT (1949) Comparative study of decomposition rates of organic matter in temperate and tropical region. Soil Sci 68:419–432 Kalembasa SJ, Jenkinson DS (1973) A comparative study of titremetric and
gravimetric methods for the determination of organic carbon in soil. J Sci Food Agri 24:1085–1090
Lü XT, Yin JX, Jepsen MR, Tang JW (2010) Ecosystem carbon storage and partitioning in a tropical seasonal forest in Southwestern China. For Ecol Manag 260:1798–1803
productivity, allocation and storage in three Amazonian forests. Glob Change Biol 15:1255–1274
Malhi Y, Doughty C, Galbraith D (2011) The allocation of ecosystem net primary productivity in tropical forests. Philos Trans R Soc B: Biol Sci 366:3225–3245 Malhi Y, Farfán Amézquita F, Doughty CE, Silva-Espejo JE, Girardin CAJ, Metcalfe
DB, Aragão LEOC, Huaraca-Quispe LP, Alzamora-Taype I, Eguiluz-Mora L, Marthews TR, Halladay K, Quesada CA, Robertson AL, Fisher JB, Zaragoza-Castells J, Rojas-Villagra CM, Pelaez-Tapia Y, Salinas N, Meir P, Phillips OL (2014) The productivity, metabolism and carbon cycle of two lowland tropical forest plots in south-western Amazonia, Peru. Plant Ecol Diversity 7: 85–105
Mandal T (1999) Ecological analysis of recovery of landslide damaged Sal forest ecosystem in Nepal Himalaya. Dissertation, Banaras Hindu University, Varanasi McBrayer JF, Cromack KJ (1980) Effect of snowpack on oak- litter breakdown and
nutrient release in a Minnesota forest. Pedobiologia 20:47–54
Ngo KM, Turner BL, Muller-Landau HC, Davies SJ, Larjavaara M, Nik Hassan NF, Lum S (2013) Carbon stocks in primary and secondary tropical forests in Singapore. For Ecol Manag 296:81–89
Noguchi H, Suwa R, de Souza CAS, da Silva RP, dos Santos J, Higuchi N, Kajimoto T, Ishizuka M (2014) Examination of vertical distribution of fine root biomass in a tropical moist forest of the Central Amazon, Brazil. Japan Agri Res Quarterly 48:231–235
Pan Y, Birdsey RA, Fang J, Houghton R, Kauppi PE, Kurz WA, Phillips OL, Shvidenko A, Lewis SL, Canadell JG, Ciais P, Jackson RB, Pacala SW, McGuire AD, Piao S, Rautiainen A, Sitch S, Hayes D (2011) A large and persistent carbon sink in the world’s forests. Science 333:988–993
Powers JS, Becknell JM, Irving J, Pèrez-Aviles D (2009) Diversity and structure of regenerating tropical dry forests in Costa Rica: Geographic patterns and environmental drivers. For Ecol Manag 258:959–970
Powers JS, Perez-Aviles D (2013) Edaphic factors are a more important control on surface fine roots than stand age in secondary tropical dry forests. Biotropica 45:1–9
Roderstein M, Hertel D, Leuschner C (2005) Above and below-ground litter production in three tropical montane forests in southern Ecuador. J Trop Ecol 21:483–492
Saner P, Loh YY, Ong RC, Hector A (2012) Carbon stocks and fluxes in tropical lowland dipterocarp rainforests in Sabah, Malaysian Borneo. PloS One 7. doi: 10.1371/journal.pone.0029642
Singh JS, Singh SP (1992) Forests of Himalaya. Gyanodaya Prakashan, Nainital Singh KP, Mandal TN, Tripathi SK (2001) Patterns of restoration of soil
physciochemical properties and microbial biomass in different landslide sites in the sal forest ecosystem of Nepal Himalaya. Ecol Eng 17:385–401 Singh L, Singh JS (1991) Storage and flux of nutrients in a dry tropical forest in
India. Ann Botany 68:275–284
Singh SP, Adhikari BS, Zobel DB (1994) Biomass, productivity, leaf longevity, and forest structure in the Central Himalaya. Ecol Monogr 64:401–421 Srivastava SK, Singh KP, Upadhyay RS (1986) Fine root growth dynamics in teak
(Tectona grandisLinn. F.). Can J For Res 16:1360–1364
Vogt KA, Grier CC, Vogt DJ (1986) Production, turnover and nutrient dynamics of above and belowground detritus of world forests. Adv Ecol Res 15:303–377
Submit your manuscript to a
journal and benefi t from:
7 Convenient online submission
7 Rigorous peer review
7 Immediate publication on acceptance
7 Open access: articles freely available online
7 High visibility within the fi eld
7 Retaining the copyright to your article