e-ISSN: 2278-067X, p-ISSN: 2278-800X, www.ijerd.com Volume 7, Issue 11 (July 2013), PP. 10-17
Weather Forecasting Using Soft Computing: Minimum
Temperature, Maximum Temperature & Pressure
1
Govind Kumar Rahul,
2Madhu Khurana,
3A.K.Sinha
1
M.Tech Student, ABES Engineering College Ghaziabad, MTU Noida, Uttar Pradesh, India 2
ABES Engineering College Ghaziabad, MTU Noida, Uttar Pradesh, India 3
ABES Engineering College Ghaziabad, MTU Noida, Uttar Pradesh, India
Abstract:- In a developing country, like India where agriculture is the base for national economy, the weather conditions including Minimum Temperature, Maximum Temperature and Pressure play a leading role. Therefore having accurate weather forecasting information may allow farmers to make their better decisions on managing their farms. Similar statement can be made for industries where accurate weather condition prediction may help them in their proper development as these are the factors that affect them directly or indirectly. Soft computing using ANN is an effective approach to construct a computationally intelligent system that is able to process non-linear weather conditions within a specific domain, and make predictions. The proposed work focus on modeling of such an intelligent system that can forecast with minimum error rate in term of MSE with a better Architecture.
Keywords:- Soft Computing, Artificial Neural Network (ANN), Back Propagation Algorithms. Multi layer Feed Forward Neural Network (MLFFNN).
I. INTRODUCTION
The weather is a continuous, data-intensive, multidimensional, dynamic and chaotic process [2] and these Properties make weather forecasting a formidable challenge. . A number of researches have been done focusing on the usefulness of soft computing approach in forecasting area. In this project, the main purpose is to find out how well the proposed soft computing models ANN & Back Propagation Algorithm are suited. This would help one to anticipate with some degree of confidence the Min. Temp, Max. Temp & pressure to be expected next day. In this project data of previous three years (i.e. 2009, 2010 & 2011) about DELHI/NCR is collected from Government of India, India Meteorological Department, Regional Meteorological Centre (IMD-RMC), to be used in the proposed weather forecasting project. For local scale & short term weather forecasting the approach of artificial neural networks (ANNs) is so efficient. ANN provides a methodology for solving many types of non-linear problems that are difficult to solve by traditional techniques. Most meteorological processes often exhibit temporal and spatial variability and are further plagued by issues of non-linearity of physical processes, conflicting spatial and temporal scale and uncertainty in parameter estimates. With ANN, there exists the capability to extract the relationship between the inputs and outputs of a process, without the physics being explicitly provided [11]. Thus, these properties of ANN are well suited to the problem of weather forecasting under consideration.
II. RELATED WORKS
Many works have done in forecasting of Temperature & Pressure. Some of them are presented here. This will lead us to make better understanding of project work. Some basic concepts, findings & facts will be extracted to make some conventions for our project.
Mohsen Hayati & Zahra Mohebi [1] utilizes ANN for one day ahead prediction of temperature. They used MLP to train & test ten years (1996-2006) meteorological data. For accuracy of prediction they split data into four seasons and then for each seasons one network is presented. Two random unseen days in each season are selected to test the performance. The error in result varies between 0 to 2 MSE.
Dr.S.Santhosh Baboo & I.Kadar Shereef [2], used BPN for doing prediction and tested as the best algorithms for training the ANN. The ANN is trained & tested using complete one year weather data including Temperature, Due Point, Humidity, SLP, Visibility & wind speed etc.ANN is trained with 200 data and tested for unseen data the result varies with 2.16% errors.The research shows Min error 0.0079 & Max. Error 1.2916 RMSE. And the epoch taken are between 1000 to 5000.
Ch.Jyosthna Devi, B.Syam Prasad Reddy, K.Vagdhan Kumar, B.Musala Reddy, N.Raja Nayak [4] they used to show how ANN & BPA are useful in forecasting.A 3-layered neural network is designed and trained. So many parameters are taken, like temperature, humidity, dew point, visibility, atmospheric pressure, sea level, wind speed, wind direction etc. Basically the work is done to check two deferent ANN architecture to check which is better. These are Back Propagation (BPN) feed forward network and Radial basis function network (RBN). And BPN is found the best
Y.Radhika & M.Shashi [5] presents an application of Support Vector Machine for weather prediction. Time series data of daily max temperature at location is studied to predict the max temp of next day.
Arvind Sharma [6 utilizes the usefulness of ANN & Fuzzy system for the next day weather condition prediction like Rain, thunderstorm, sunshine & dry day etc. They deeply analyzed the data record and their inter-relationship. And found the inter-dependencies among these data.
C.N. Schizas'BJ S. Michaelides' C.S. Pattichis3 R.R. Livesay [7] have introduced so many ANN model based on several different architecture to forecast the minimum temperature and compare the results. They took previous year data in so many parameters and train different architecture based ANN with different data set. They found the ANN with BPN is the best suited for forecasting.
Brian A. Smith, Ronald W. McClendon, and Gerrit Hoogenboom [8] focused on developing ANN models with reduced average prediction error by increasing the number of distinct observations used in training. Arvind Sharma et.al, [9] briefly explains how the different connectionist paradigms could be formulated using different learning methods and then investigates whether they can provide the required level of performance, which are sufficiently good and robust so as to provide a reliable forecast model for stock market indices. Experiment results exposes that all the connectionist paradigms considered could represent the stock indices behavior very accurately.
Mike O'Neill [10] focus on two major practical considerations: the relationship between the amounts of training data and error rate and the transferability of models expertise between different datasets.
2.1 Conclusion
After going through the above detailed study we find Applying soft computing could be one of the best alternatives for local and short scale weather forecasting. The Study says any forecasting system using Artificial Neural Network & Back propagation Algorithms depends on the data that should be valid, Authentic and in proper format. The numbers of Variables are dependent on each other so it should be chosen so carefully and according to need.Many the variables, better the result
The amount of data that we acquire for training of our model plays a vital role in forecasting accuracy. The training set is one the most considerable entity of our research work, which contains the collection of unit input & unit output for the ANN. The better the training set, better the result. The architecture of any artificial neural network is defined by the layers, numbers of neuron etc. Different forecasting models requires different forecasting architecture. The best suited ANN architecture for any forecasting model is the subject of research for a researcher.
Figure 2.1.Architecture of an ANN based model
Conversion also depends on the number of epochs we take for the training. Less no. of epochs may not converse better (better fitting of network) and high no. of epochs may leads network to produce repeated fitting.
III. METHODOLOGY
were collected every day at 8:30 AM & 17:30 PM everyday
Figure 3.0 The Proposed Model
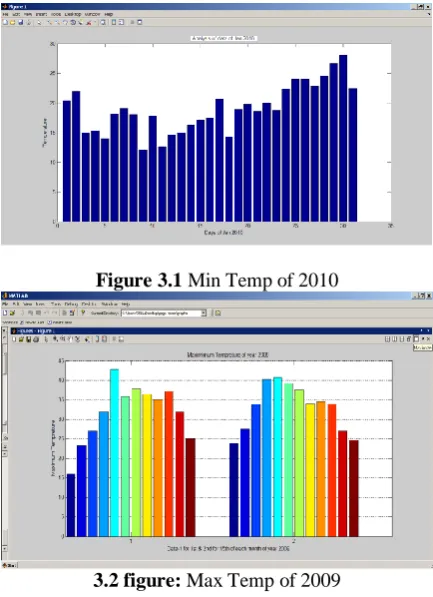
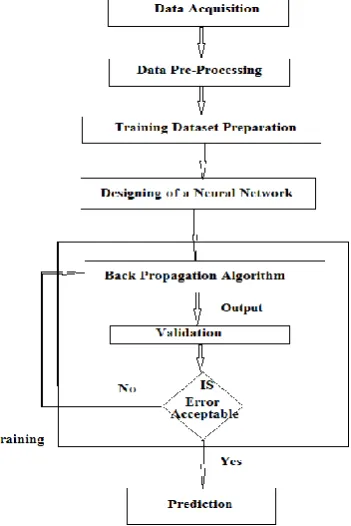
After that processing of data is done to find out the relevant information that is ranges of values, inter-relationship, dependencies etc. Some of examples are give bellow as figure.3.1 & figure 3.2
Figure 3.1 Min Temp of 2010
3.2 figure: Max Temp of 2009
Spring March 20 to May 20
Summer May 20 to July 20
Monsoon July 20 to September20
Autumn September 20 to
November 20
Winter November 20 to January
20
Winter & Fall January 20 to March 20
Table 3.1 Seasons in Indian
Once the data modeling is done we used Matlab programming to formulate a database and then to formulate Input dataset and output dataset said input_data & target correspondingly. Here we use input function as-
Input = f (t, t-1, t-2)
And Output function is-
Output = f (t+1)
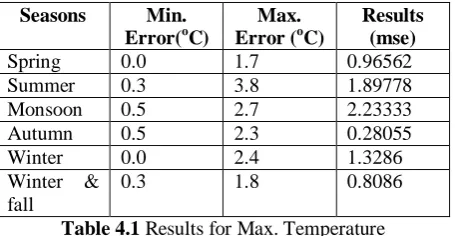
For all three parameters i.e. Min. Temperature, Max. Temperature & Pressure. The appropriate architecture of the neural network will lead to fast fitting and good results. Initially we took a neural network with single hidden layer with 8 neurons. We applied a number of iteration to decide the optimum architecture and we reached the architecture of ANN with 3 hidden layers with 8-10-12 numbers of neurons correspondingly. BPA is used to train the network that said earlier the best suited algorithm for training of network. We applied the training set prepared in the form of input_data & target to the decided neural network model and performed training of the network. Once the training is done, the network can be tested and validated. The network itself divided the training set into two parts. I.e. Some 75% of data if reserved for training & some 25 % is preserved for testing & validation. The trained network is used to verify and analyze the results so obtained by using the network. The accuracy of prediction will be analyzed and compared with other results. After verification if the result is not accurate the network needs to be retrained unless the required accuracy is achieved.
Figure 3.3 Flowchart of Methodology
IV. EXPERIMENTAL RESULTS
Error (MSE).
As we know we are having four parameters to forecast that are- Maximum Temperature, Minimum Temperature & Mean See Level Pressure (MSLP) and we have divided the yearly data into 6 seasons as discussed in Table 2.1 above, this leads to module
A global architecture is developed and an instance of that ANN architecture is called for each & every module. Each network is used to train & test for each parameter with corresponding seasonal training set containing input_data & target, means we obtained 6*3=18 seasonal results. Once these neural networks are trained with 2009 & 2010 seasonal training set, we used to test the network performance with 2011 seasonal data to check the performance. Here the results are checked for each 10 days at 5 days interval in each season. For forecasting of Maximum Temperature for all 6 seasons the developed neural network results as-
Seasons Min. Error(oC)
Max. Error (oC)
Results (mse)
Spring 0.0 1.7 0.96562
Summer 0.3 3.8 1.89778
Monsoon 0.5 2.7 2.23333
Autumn 0.5 2.3 0.28055
Winter 0.0 2.4 1.3286
Winter & fall
0.3 1.8 0.8086
Table 4.1 Results for Max. Temperature
Here we see in above Table-4.1 that the Minimum error occurs in all 6 seasons i.e. in whole year is 0.0
o
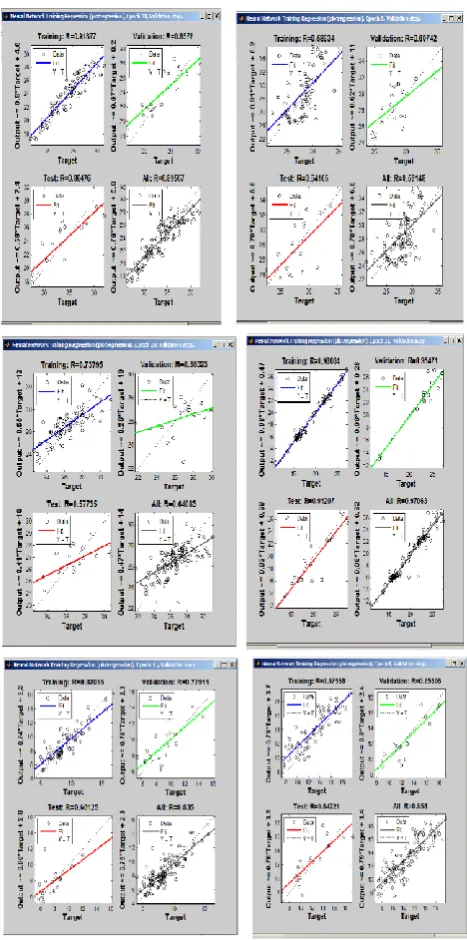
C & Maximum error is 3.0 oC.exept summer season. The Mean Square Error (mse) ranges between 0.28055 to 2.23333 in all the 6 seasons. Means the developed model works well in Max. Temp. Prediction with a good confidence that it can be taken in real time prediction. We can refer to figure 4.1 for regression plots of Max. Temp prediction.
Similarly we can take the results of Minimum Temperature for analysis as-
Seasons Min. Error( oC)
Max. Error (oC)
Results (mse)
Spring 0.5 3.2 1.8849
Summer 0.1 2.3 1.5043
Monsoon 0.1 2.0 1.0496
Autumn 0.0 2.2 1.06743
Winter 0.0 2.2 1.01835
Winter & fall
0.3 2.2 3.47333
Table 4.2 Results for Min. Temperature
Here we can see in above Table-4.2 that the Minimum error occurs in all 6 seasons i.e. in whole year is 0.0 oC& Maximum error is 3.2 oC.The Mean Square Error (mse) ranges between 1.0496 oC to 3.47333 oC in all the 6 seasons. And the module also represents a good confidence into real time prediction.
If we talk about Mean See Level Pressure (MSLP). We find the results as follows-
Seasons Min. Error (mbar) Max. Error (mbar) Results (mse)
Spring 0.3 2.9 2.4776
Summer 0.3 2.3 1.95653
Monsoon 0.0 3.7 3.9649
Autumn 0.2 2.6 1.5424
Winter 0.0 2.6 1.11354
Winter & fall
0.2 3.0 2.738
Table 4.3 Results for MSLP
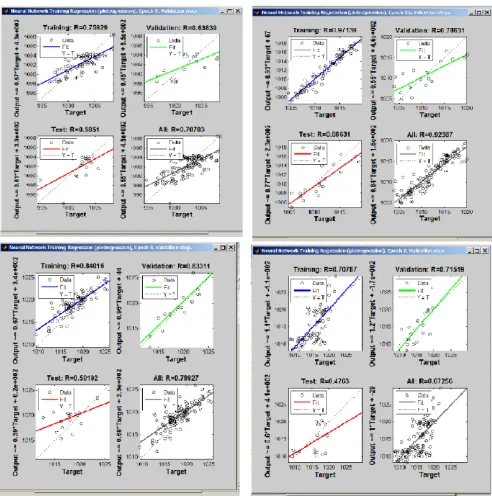
Here we can see that the Minimum error occurs in all 6 seasons i.e. in whole year is 0.0 mbar & Maximum error is 3.7 mbar.The Mean Square Error (mse) ranges between 1.11354 mbar to 3.9649 mbar in all the 6 seasons. This module best predict for winter season & worst for Monsoon Season.The regression plots for MSLP forecasting could be seen in figure
In India weather is so variable in nature & it changes its state in each two months called Ritu/seasons. Due to some errors presented in given data by IMD, the results sometimes produced unexpected results in all seasons at two or three times.
V. CONCLUSION
From the above study & discussion we see that applying soft computing approach for weather modeling to forecast Minimum Temperature, Maximum Temperature & MSLP is most feasible rather than any other short term weather forecasting approach. The study also says that MLFFNN with BPA algorithms is the better combination for weather forecasting..The valid & authentic dataset selection, input variable selection, the proper training set and the proper ANN architecture are most vital for the best prediction results.
In the project work the Conclusion shows a good confidence in the range of overall 0.0 to 2.33 oC mse for max. Temp. , 0.0 to 2.0 oC for min. temp. except winter + Fall and 0.0 to 2.73 for MSLP except monsoon that it can be taken into real time forecasting of these parameters. And that fulfills the hypothesis & objective of our project.
This research work also support the result of Mohsen Hayati & Zahra Mohebi[1] who suggest to forecast the weather condition seasonally .
Figure 4.3 Regression plots for MSLP forecasting in all six (6) seasons from upper-left to right and down-left to right
REFERENCES
[1]. Mohsen Hayati & Zahra Mohebi, Temperature Forecasting Based on Neural Network Approch, World Applied Science Journal 2(6) 613-620, 2007, ISSN 818-4952 ©IDOSI Publications 2007
[2]. Dr.S.Santhosh Baboo & I.Kadar Shereef, An efficient weather forecasting system using Artificial Neural network, International Journal of Environment Science & Development, W1.1, No.4, October-2010,ISSN: 2010-0264
[3]. S.S. De, University of Kolkata, Artificial Neural Network Based Prediction of Max. & Min. Temperature in the Summer-Monsoon month over India, Applied Physics Research,Vol.1,No.2,Nov-2009
[4]. Ch.Jyosthna Devi #1, B.Syam Prasad Reddy#2, K.Vagdhan Kumar#3,B.Musala Reddy#4,N.Raja Nayak#5, ANN Approach for Weather Prediction using Back propagation, International Journal of Engineering Trends and Technology- Volume3Issue1- 2012,ISSN: 2231-5381 Page 19
[5]. 5.Y.Radhika & M.Shashi, Atmospheric Temperature prediction using Support Vector Machine.,International Journal of Computer Theory & Engineering ,Vol.1.No.1.April 2009 1793-8209
[6]. Arvind Sharma,PG Research Group (M.Tech. CSE), A Weather Forecasting System using concept of Soft Computing: A new approach, SATI, Vidisha (MP) India,1-4244-0716-8/06/$20.00 ©2006 IEEE. 353-356
[7]. C.N. Schizas'BJ S. Michaelides' C.S. Pattichis3 R.R. Livesay', Artificial Neural Network in Forecasting MinimumTemparature, ‘University of Indianapolis, U.S.A *, IEEE Paper.
[8]. Brian A. Smith, Ronald W. McClendon, and Gerrit Hoogenboom, Improving Air Temperature Prediction with Artificial Neural Networks, International Journal of Computational Intelligence 3;3 2007.
[9]. Arvind Sharma, Prof. Manish Manoria, A Weather Forecasting System using concept of Soft Computing, pp.12-20 (2006)
[10]. Mike O'Neill, Neural Network for Recognition of Handwritten Digits, Standard Reference Data Program National Institute of Standards and Technology.
[11]. Yen Wee Khun, A Study on Soft Computing Approach in Weather Forecasting, Faculty of Computer Science and Information Systems University Teknologi Malaysia, April 2010.
Govind Kumar Rahul
M.Tech (CSE), ABES Engg. College, Ghaziabad.
Associate Professor Mrs. Madhu Khurana