Published online November 27, 2014 (http://www.sciencepublishinggroup.com/j/ijepe) doi: 10.11648/j.ijepe.s.2014030602.14
ISSN: 2326-957X (Print); ISSN: 2326-960X (Online)
Comparative Analysis between IG and DFIG for Wind
Energy Conversion Systems using STATCOM
Vishvaneeta Patel
1, *, Ashutosh Kashiv
1, Kulsum Aslam
1, H. K. Verma
21
Electrical & Electronics Engineering Department, Oriental University, Indore, India 2
Electrical Engineering Department, S.G.S.I.T.S. Indore, India
Email address:
[email protected] (V. Patel), [email protected] (A. Kashiv), [email protected] (K. Aslam), [email protected] (H. K. Verma)
To cite this article:
Vishvaneeta Patel, Ashutosh Kashiv, Kulsum Aslam, H. K. Verma. Comparative Analysis between IG and DFIG for Wind Energy Conversion Systems using STATCOM. International Journal of Energy and Power Engineering. Special Issue: Distributed Energy Generation and Smart Grid. Vol. 3, No. 6-2, 2014, pp. 21-26. doi: 10.11648/j.ijepe.s.2014030602.14
Abstract:
In the grid new renewable resources are added to extract more power. This increases power quality issues to grid connection. Power quality problem occur mainly due to Unbalance voltage, current or frequency that results in a failure or a Mis-operation of end user equipment. Injection of the wind power into an electric grid affects the power quality. The impact of the wind turbine in the grid system concerning the power quality measurements are the active power, reactive power, variation of voltage, and switching operation and these are measured according to national/international guidelines.This paper investigates the implementation and comparison of DFIG based wind farm connected to a grid and load and IG based wind farm connected to a grid and load. The steady state behaviour of an interconnected IG based wind farm with STATCOM and DFIG based wind farm with STATCOM is studied and compared for performance evaluation of the two Generators. The power system model is simulated in MATLAB / SIMULINK. Superiority of DFIG over IG have been analysed in this paper.Keywords:
IG (Induction Generator), DFIG (Doubly Fed Induction Generator), FACTs, Wind Power Plant, Matlab/Simulink, Power Quality, Reactive Power Compensation1. Introduction
Growing energy demands and environmental concerns have increased interest in the use of wind energy.[2] Although considerable research has been done in this area, numerous problems and limitations still exist that need to be resolved before wind energy can become a major source of energy. One such problem is that the connection of wind turbine (WT) generators to the grid can be constrained by power quality considerations such as possible deterioration of voltage and power quality of the network. The voltage and power generated by a WT fluctuate more than those produced by conventional generators.
The increasing number of renewable energy sources and distributed generator requires new strategies for operation and management of electric grid, in order to improve the power quality norms. International standards are developed by the working groups of Technical Committee-88 of the International Electro Technical Commission (1EC); IEC 61400-21 describes the -procedure of determining the power
quality characteristics of wind turbine. Today in wind turbine generating system pulse controlled inverters are used.[11] Due to the improvement in switching techniques, the voltage and current at the point of common connection can be made in sinusoidal form and at unity power factor so as to improve the power quality at PCC. Power Quality (PQ) related issues [7] are of most concern now a days. The widespread use of electronic equipment, such as information technology equipment, power electronics such as adjustable speed drives (ASD), [12] programmable logic controllers (PLC), energy-efficient lighting, led to a complete change of electric loads nature. These loads are simultaneously the major causers and the major victims of power quality problems. Due to their non-linearity, all these loads cause disturbances in the voltage waveform.
In this paper Static Synchronous Compensator (STATCOM) is connected at a point of common coupling with a battery energy storage system (BESS) to mitigate the power quality issues. [11]
known as a “Static- Synchronous Condenser” is a regulating device used on alternating current electricity transmission network. It is based on a power electronics voltage-source converter and can act as either a source or sink of reactive AC power to an electricity network. If connected to a source of power it can also provide active AC power. It is a member of FACTS family of devices Usually a STATCOM is installed to support electricity network that have a poor power factor and often poor voltage regulation.[3]
There are however, other uses, the most common use is for voltage stability. A STATCOM is a voltage source converter (VSC) - Based device with the voltage source behind a reactor. [3]The voltage source is created from a DC capacitor and therefore a STATCOM has very little active power capability. However, its active power capability can be increased if a suitable energy storage device is connected across the DC capacitor[5]
STATCOM uses self commutating devices like GTOs and is an advanced form of SVC. The operating and functional characteristics of STATCOM are however different from those obtained using SVC. The major advantages of STATCOM over the conventional SVC are, significant size reduction due to reduced number of passive elements, and ability to supply required reactive power even at low bus voltages.[3]
2. Model Description
2.1. IG Based Wind Farm Connected to a Grid and Load
Two pairs of 1.5 MW wind-turbines has been used. Wind turbines use squirrel-cage induction generators (SCIG). The
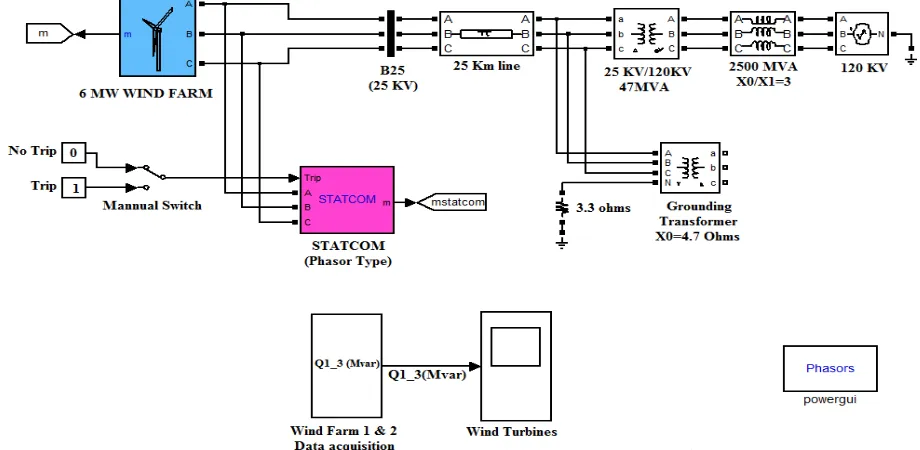
stator winding is connected directly to distributed network. A wind farm consisting of four 1.5-MW wind turbines is connected to a 25-kV distribution system exports power to a 120-kV grid through a 25-km 25-kV feeder. The 6-MW wind farm is simulated by to the 50 Hz grid and the rotor is driven by a variable-pitch wind turbine. The pitch angle is controlled in order to limit the generator output power at its nominal value for winds exceeding the nominal speed (9 m/s). In order to generate power the IG speed must be slightly above the synchronous speed. Speed varies approximately between 1pu at no load and 1.005 pu at full load. Each wind turbine has a protection system monitoring voltage, current and machine speed. Reactive power absorbed by the SCIGs is partly compensated by capacitor banks connected at each wind turbine low voltage bus (400 kvar for each pair of 1.5 MW turbine). The rest of reactive power required to maintain the 25-kV voltage at B25 bus close to 1pu is provided by a 3-Mvar STATCOM with a 3% droop setting. The turbine mechanical power as function of turbine speed is displayed for wind speeds ranging from 8 m/s to 11 m/s. The nominal wind speed yielding the nominal mechanical power (1pu=3 MW) is 9 m/s. In this paper, the system is observed during 2 s.
2.2. DFIG Based Wind Farm Connected to a Grid and Load
A 6-MW wind farm consisting of four 1.5 MW wind turbines connected to a 25-kV distribution system exports power to a 120-kV grid through a 25-km, 25-kV feeder. wind turbine have a protection system monitoring voltage, current and machine speed. The DC link voltage of the DFIG is also monitored.
Figure 1. Simulink Model (Test Model).
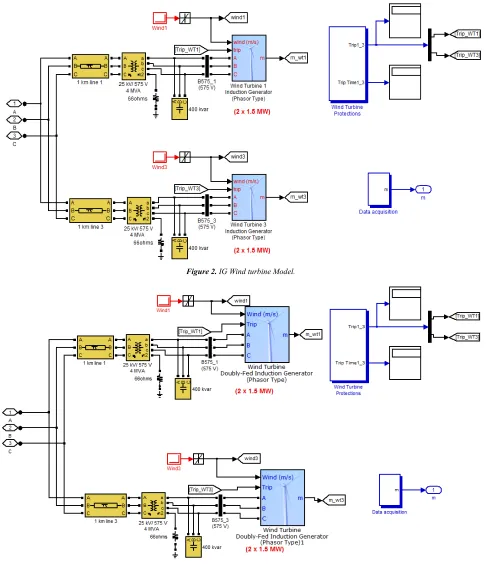
Wind turbines use a doubly-fed induction generator (DFIG) consisting of a wound rotor induction generator and an AC/DC/AC IGBT-based PWM converter. The stator winding is connected directly to the 60 Hz grid while the rotor is fed at
gusts of wind. The optimum turbine speed producing maximum mechanical energy for a given wind speed is proportional to the wind speed. For wind speeds lower than 10 m/s the rotor is running at sub synchronous speed. At high wind speed it is running at hyper synchronous speed.
3. Simulation of Model
Simulation model is simulated in MATLAB/Simulink.
Fig.1 shows the Simulink model of the test system. Phasor simulation is used to simulate the test system; so as to make it valid for intended purpose. The simulation time is 2 sec. The simulation is run in four different modes, as follows
A. IG Wind Farm without STATCOM B. IG Wind Farm with STATCOM C. DFIG Wind Farm without STATCOM D. DFIG Wind Farm with STATCOM
Figure 2. IG Wind turbine Model.
4. Simulation Results
Figure 4. IG Reactive power without STATCOM.
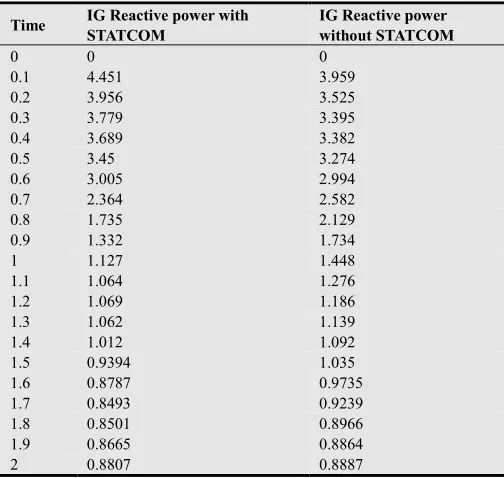
Figure.4 shows the Reactive power of induction generator wind farm without STATCOM (in Mvar) under normal condition. The Reactive power has decrease from 3.959 Mvar to 0.8887 Mvar in and reached the final value of 0.8887 Mvar.
Figure 5. IG Reactive power with STATCOM.
Fig.5. shows the Reactive power of induction generator wind farm with STATCOM (in Mvar) under normal condition. The Reactive power has decrease from 4.451 Mvar to 0.8807 Mvar and reached the final value of 0.8807 Mvar.
Table 1. Comparison of Reactive power of IG wind farm with and Without STATCOM with respect to time.
Time IG Reactive power with STATCOM
IG Reactive power without STATCOM
0 0 0
0.1 4.451 3.959
0.2 3.956 3.525
0.3 3.779 3.395
0.4 3.689 3.382
0.5 3.45 3.274
0.6 3.005 2.994
0.7 2.364 2.582
0.8 1.735 2.129
0.9 1.332 1.734
1 1.127 1.448
1.1 1.064 1.276
1.2 1.069 1.186
1.3 1.062 1.139
1.4 1.012 1.092
1.5 0.9394 1.035
1.6 0.8787 0.9735
1.7 0.8493 0.9239
1.8 0.8501 0.8966
1.9 0.8665 0.8864
2 0.8807 0.8887
Figure 6. Comparison of IG wind Farm Reactive power with and without STATCOM.
Fig. 6 shows the comparative results of Reactive power of IG wind farm with STATCOM in Mvar (Shown by blue line) and Reactive power of IG wind farm without STATCOM in Mvar (Shown by red line). It can be concluded from the graph that the Reactive power is now reduced and power quality is now improved with the present wind turbine system. Before operation of STATCOM the fluctuating power is obtained by the wind farm. After the switching on the STATCOM constant power output is given by the wind farm.
Figure 7. DFIG Reactive power without STATCOM.
Fig.7. shows the Reactive power of DFIG wind farm without STATCOM (in Mvar) under normal condition. The Reactive
Figure 8. DFIG Reactive power with STATCOM.
reached the final value of 0.4323 Mvar.
Table 2. Comparison of Reactive power of DFIG wind farm with and Without STATCOM with respect to time.
Time DFIG Reactive power with STATCOM
DFIG Reactive power without STATCOM
0 0 0
0.1 0.5515 0.521
0.2 0.4356 0.4956
0.3 0.4204 0.4939
0.4 0.419 0.4949
0.5 0.4196 0.4962
0.6 0.4204 0.4974
0.7 0.4213 0.4987
0.8 0.4222 0.4999
0.9 0.423 0.5012
1 0.4239 0.5025
1.1 0.4247 0.5037
1.2 0.4256 0.5049
1.3 0.4264 0.5062
1.4 0.4273 0.5074
1.5 0.4281 0.5086
1.6 0.429 0.5099
1.7 0.4298 0.5111
1.8 0.4306 0.5123
1.9 0.4314 0.5135
2 0.4323 0.5147
Figure 9. Comparison of DFIG wind Farm Reactive power With and without STATCOM.
Fig. 9 shows the comparative results of Reactive power of DFIG wind farm with STATCOM in Mvar (Shown by blue line) and Reactive power of DFIG wind farm without STATCOM in Mvar (Shown by red line). It can be concluded from the graph that the Reactive power is now reduce and power quality is now improved with the present wind turbine system. Before operation of STATCOM the fluctuating power is obtained by the wind farm. After the switching on the STATCOM constant power output is given by the wind farm.
After comparing the results of IG based Wind farm with and Without STATCOM. It can be conclude that the With STATCOM results are better as compare to without STATCOM. Similarly In DFIG based Wind Farm with STATCOM result is better as compare to the Without STATCOM. Now compare Reactive power of IG wind farm
and DFIG wind farm With STATCOM.
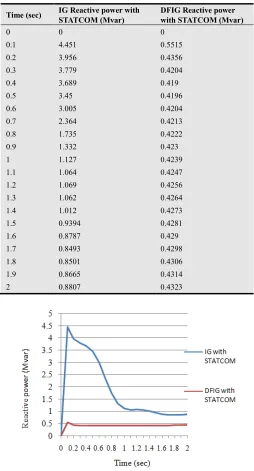
Table 3. Comparison of Reactive power of DFIG wind farm with STATCOM and IG wind farm With STATCOM with respect to time.
Time (sec) IG Reactive power with STATCOM (Mvar)
DFIG Reactive power with STATCOM (Mvar)
0 0 0
0.1 4.451 0.5515
0.2 3.956 0.4356
0.3 3.779 0.4204
0.4 3.689 0.419
0.5 3.45 0.4196
0.6 3.005 0.4204
0.7 2.364 0.4213
0.8 1.735 0.4222
0.9 1.332 0.423
1 1.127 0.4239
1.1 1.064 0.4247
1.2 1.069 0.4256
1.3 1.062 0.4264
1.4 1.012 0.4273
1.5 0.9394 0.4281
1.6 0.8787 0.429
1.7 0.8493 0.4298
1.8 0.8501 0.4306
1.9 0.8665 0.4314
2 0.8807 0.4323
Figure 10. Comparison of Reactive power of DFIG wind Farm and IG wind farm with STATCOM.
Fig. 10 shows the comparison graph between IG based wind farm Reactive power with STATCOM and DFIG Based Wind farm reactive power With STATCOM.
In the above Figure it is clear that the variation in reactive power flow in the IG based wind farm is high as compare to the DFIG based wind farm
of reactive power as compare to the IG based wind farm with STATCOM
5. Conclusions
Results mentioned in the previous section shows that DFIG Based wind farm With STATCOM better compensate the reactive power and gives the minimum value of reactive power as compare to the IG based wind farm with STATCOM In the IG based wind farm the steady state value occurred after a long time of process but in DFIG base wind farm it occurred in couple of seconds and hence DFIG provide better results than IG based wind farm.
The study in this paper implicates that DFIG based wind farm is better than IG based wind farm for the stable operation of wind turbine generator system.
References
[1] Nicholas P. W. Strachan, and Dragan Jovcic “Improving Wind Power Quality using an Integrated Wind Energy Conversion and Storage System (WECSS)” Power and Energy Society General Meeting - Conversion and Delivery of Electrical Energy in the 21st Century, 2008 IEEE
[2] S. Rahman, “Going green: The growth of renewable energy,” IEEE Power Energy Mag., vol. 1, no. 6, pp. 16–18, Nov./Dec. 2003.
[3] Amit Garg, Ravindra Pratap Singh “Dynamic Performance Analysis of IG based Wind Farm with STATCOM and SVC in MATLAB / SIMULINK” International Journal of Computer Applications (0975 – 8887) Volume 71– No.23, June 2013.
[4] Kappala Shanmukha Rao, Manda vijay Kumar “Analysis of Doubly Fed Induction Generator under Varies Fault Conditions” Journal of Engineering Research and Applications ISSN : 2248-9622, Vol. 3, Issue 6, Nov-Dec 2013, pp.2102-2106
[5] Amit Kumar Chourasia, Abhishek Mishra, Durga Sharma “A
Simulation of a STATCOM-Control for Grid Connected Wind Energy System for Power Quality Improvement” International Journal of Engineering Research and Applications (IJERA) ISSN: 2248-9622 Vol. 3, Issue 4, Jul-Aug 2013, pp.1207-1214
[6] L. Changling, H. Banakar, S. Baike, O. Boon-Teck, “Strategies to smooth wind power fluctuations of wind turbine generator,” IEEE Trans. Energy Conv., vol. 22, no. 2, pp. 341- 349, June 2007.
[7] Z. Chen, E. Spooner, Grid power quality with variable speed wind turbines”, IEEE Trans on Energy Conversion, 162148156June 2001
[8] Naimul Hasan, Ibraheem, Shuaib Farooq “Dynamic Performance Analysis of DFIG based Wind Farm with STATCOM and SVC” International Journal of Emerging Technology and Advanced Engineering (ISSN 2250-2459, Volume 2, Issue 7, July 2012)
[9] Harish shenigarapu, Ramesh Lakavath, Sridhar Panthangi, Mallela Kishore “ Improving the Stability and Reliability of Wind Power Grid-Connected System” Journal of Engineering Research and Applications ISSN : 2248-9622, Vol. 3, Issue 6, Nov-Dec 2013, pp.1734-1739
[10] Ramadoni Syahputra , Imam Robandi, and Mochamad Ashari “ Performance Analysis Of Wind Turbine As A Distributed Generation Unit In Distribution System” International Journal of Computer Science & Information Technology (IJCSIT) Vol 6, No 3, June 2014
M.CHIRANJEEVI O.VENKATANATHA REDDY “A
BESS-STATCOM Based Control Scheme for Grid Connected Wind Energy System for Power Quality Improvement” International Journal of Engineering Research and Applications(IJERA)ISSN: 2248-9622 Vol. 2, Issue 2,Mar-Apr 2012, pp.1224-1228