http://www.sciencepublishinggroup.com/j/ajese doi: 10.11648/j.ajese.20170104.12
Determination of Cover-Crop Management Factor (C) for
Selected Sites in Imo State Using Remote Sensing
Technique and (GIS)
Okore Okay Okorafor
1, *, Christopher Oluwakunmi Akinbile
1, Adebayo Jonathan Adeyemo
21
Department of Agricultural and Environmental Engineering, Faculty of Engineering and Engineering Technology, Federal University of Technology, Akure, Nigeria
2
Department of Crop Storage and Pest Management, Faculty of Agriculture and Agricultural Technology, Federal University of Technology, Akure, Nigeria
Email address:
[email protected] (O. O. Okorafor), [email protected] (C. O. Akinbile), [email protected] (A. J. Adeyemo)
*
Corresponding author
To cite this article:
Okore Okay Okorafor, Christopher Oluwakunmi Akinbile, Adebayo Jonathan Adeyemo. Determination of Cover-Crop Management Factor (C) for Selected Sites in Imo State Using Remote Sensing Technique and (GIS). American Journal of Environmental Science and
Engineering. Vol. 1, No. 4, 2017 pp. 110-116. doi: 10.11648/j.ajese.20170104.12
Received: June 19, 2017; Accepted: July 3, 2017; Published: August 1, 2017
Abstract:
Human interference through various activities such as road construction, mineral exploration, lumbering, excavation and rural-urban migration has placed a high demand on the availability of land for agriculture and exposed croplands to extensive degradation and erosion. This study therefore aims at determining the cover-crop management factor (C) for selected sites in Imo State representing different soil groups by the use of remote sensing (RS) and geographical information system (GIS) tools. Satellite Images of the study area were analyzed using ArcGIS 10.1 software on a raster distribution array to generate maps for normalized differential vegetative index (NDVI), Land use land cover (LULC) and crop-cover management factor (C). From the maps generated for NDVI values for the sites were between -0.1035-0.386 and the C-factor values were between 0.33-1.34, thus placing the study area within a region of medium vegetative cover. The location with the lowest NDVI was Okigwe while the highest NDVI value was observed in Ohaji. Though the area lies within the tropical rainforest zone, the vegetation is unevenly distributed thereby creating an enabling environment for soil detachment and sediment transport through runoff from heavy downpours resulting from absence of soil surface resistance. The C-factor values obtained therefore encourages tree planting exercises, forest regeneration activities, shrub development and balanced vegetation maintenance so as to create limited soil surface to encourage soil erodibility and runoff so as to allow agricultural activities which will guarantee food security and sustainable environmental management.Keywords:
C-Factor, NDVI, Soils, Soil Erosion, RS, GIS1. Introduction
Soil erosion is considered to be a major environmental problem that threatens natural resources, agriculture and the environment [1]. Soils which are non-renewable on the other hand require approximately 500 years to replenish 25 millimeters (1 inch) of top soil lost to soil erosion [2]. According to [3], the productivity of soils has declined by 50% due to erosion and desertification. Soils are the richest supplies of minerals, organic matter, moisture, air and microbes that support plant growth and enhance agricultural
management process, overgrazing, desertification and deforestation related activities. The main factors affecting the rates of soil erosion by water are precipitation, soil type, topography, land use and land management [16]; according to [7]; [8]; the potential for erosion is based on soil type, slope and energy or force of precipitation expected during the period of surface disturbance. Considering all the factors contributing to erosive activities the major factor affected by man is vegetation, and this is affected greatly by human interference through exploration, mining, construction and other land use activities. Consequent upon environmental and soil distortion by human activities best agricultural management and conservation practices are required to minimize soil loss due to erosion. According to [26], agronomic practices combined with good soil management practices provide better influence on detachment and transportation of soil particles in the process of soil erosion. In order to conserve existing soil against further degradation and loss due to erosion, it is expedient to estimate soil loss and predict soil erosion risks based on existing catchment/environmental conditions so that conservation strategies are enacted to mitigate and reduce further soil loss. Estimation of soil loss are achieved through the use of erosion prediction models which help address long range land management and planning under natural and agricultural conditions. Over the years many erosion prediction models have been developed to estimate soil loss which include; Water Erosion Prediction Project (WEPP), [22], Kinematic Runoff and Erosion (KINEROS), [31], Groundwater Loading Effects of Agricultural Management Systems (GLEAMS) [11], Universal Soil Loss Equation (USLE) [30], Revised Universal Soil Loss Equation (RUSLE) [23] and so many other models. Conventionally, the RUSLE is a widely accepted model which works both for the temperate and tropical zones of the world. The RUSLE is an empirically based model founded on the USLE, but is more diverse and includes databases unavailable when the USLE was developed, [19] [22]. The RUSLE computes average annual erosion by multiplying several factors together which are rainfall erosivity (R), soil erodibility (K), slope length and steepness (LS) cover management (C) and support practice (P). One of the most important parameters in USLE and RUSLE is the cover management factor (C) that represents effects of vegetation and other land covers [21]. According to [30], the C-factor is the ratio of soil loss from certain kinds of land surface cover conditions. The crop cover management factor (C), presents the effects of plants, vegetation and soil cover on soil loss within a catchment [17]. The main objective of this study is to make use of geographical Information system (GIS) and remote sensing (RS) technique through the use of ArcGIS 10.1 software to analyze satellite imagery of Imo State to generate the normalized differential vegetation index (NDVI) and land use land cover (LULC) maps to obtain the crop cover management factor (C) for selected sites in Imo State. The selected sites in Imo State include Ehime Mbano, Ideato North, Ikeduru, Oguta, Ohaji, Okigwe, Orlu and Owerri West Local Government Areas
respectively and they represent different soil groups with different variations in soil composition.
2. Materials and Method
2.1. Position and Geological Description of Study Area
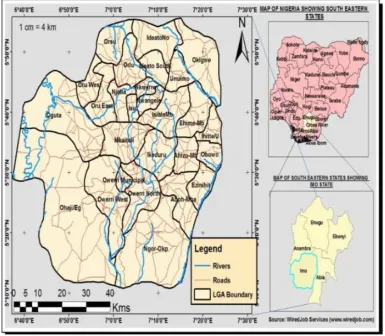
Imo State lies within latitude 4°45’’N and 7°15’’N and longitude 6°50”E and 7°15”E and covers an area of about 5100km2. The climate of the state is considered humid with mean annual temperature of 20°C, relative humidity of 75% and mean rainfall range of between 1800-2500mm [14] [15]. The rainfall pattern experienced in the area is oscillatory, bimodal and usually has two peaks within the year which is around June, July and September; also in addition the area falls within the tropical rainforest region, thus resulting in luxuriant grass lands, rich vegetation and hard-wood trees draped with under-brushes and creeping stems/undergrowths [13] [25]. The soil within the area is predominantly sandy with little percentages of clay, shale, silt and loam; the soil profile is remarkably uniform with varied percentages of nitrogen and carbon [12]. There are two different formations underlying the Imo basin area, about 80% consists of coastal plain sand which is composed of non-indurated sediments represented by the Benin and Ogwashi-Asaba formations, with alluvial deposits at the estuary of the southern end of the river basin; the remaining 20% is underlain by series of sedimentary rock units which are parallel to the regional dip of the formations [9]. The state lies mainly on the Benin formation of coastal plain sands which is made up of deep, porous, infertile and highly leached soil; this predominantly translates into having sandy soils as being predominant in Imo State [15]. Furthermore, the formation of the study area consists of sands (fine, medium, coarse grained and poorly sorted), sandstones and gravels with intercalations of clay and sandy-clay [5]. Figures 1 and 2 represent the maps of the study area and geology.
2.2. Normalized Differential Vegetation Index (NDVI) and Cover Management Factor (C) Determination
NDVI = [ − + ] (1)
Where NIR is the near infrared band value and RED is the red band value, which reflects the fraction of absorbed photosynthetic active radiation. The NDVI values obtained for the various locations within the study area are used to obtain the NDVI map which reflects the land cover management. The values for NDVI ranges between -1.0 to 1.0, where higher values reflect green vegetation and lower values represent common surfaces materials or water bodies. The C-factor can be estimated by applying the relationship used in [32] [10] as follows;
= exp (− ∗ [ ] − (2)
Where C is the calculated crop-cover management factor; NDVI is the normalized differential vegetation index, α and β are two scaling factors. [28], suggests that by applying this relationship, better results are obtained than using a linear relationship, the values for the two scaling factors α and β are 2 and 1 respectively.
The Landsat image of the study area was obtained on 12/17/2016 from Landsat 8 bandwidth 3, 4 and 5 at 0.3%
cloud cover; then the image was inserted into ERDAS Imaging 2014, ENVI 4.8 and Arc MAP 10.1 interchangeably for geo-referencing, image enhancement and false color composite analysis using ArcGIS 10.1 software to obtain the defined maps of the study area. The application of this procedure conforms to the near infrared (NIR), red (R) and green (G) planes which accounts for proper specification and attribute definition for the generation of the required maps to represent the existing conditions of the study area. From the thematic analysis carried out on the satellite images of the study area and the above expressions translated into the raster calculator of the ArcGIS 10.1 interface in cross reference with the Arc Mapper tool the maps for land use land cover (LULC), normalized differential vegetation index (NDVI), and Cover management factor (C) were generated under supervised classification.
3. Results and Discussion
The maps generated from the analysis carried out on the Landsat image of the study area are shown in the figures 3, 4 and 5;
Figure 2. Geological map of Imo State [27].
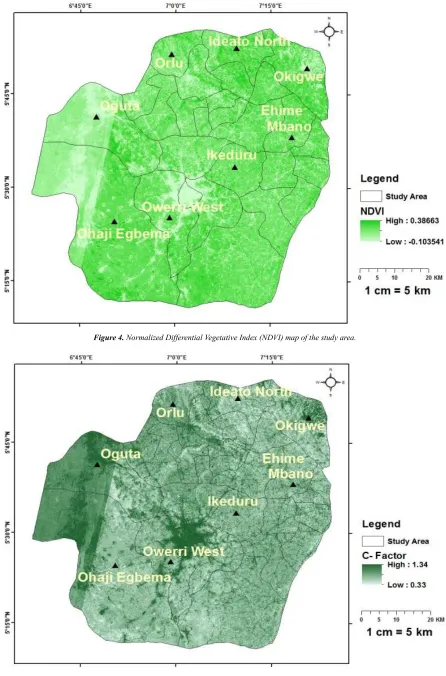
Figure 4. Normalized Differential Vegetative Index (NDVI) map of the study area.
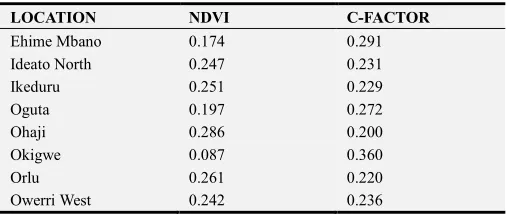
The maps presented a range of values for the NDVI and the C-factor respectively. The NDVI map presented a range of values falling between -0.1035-0.386, thus reflecting the varied nature of vegetation within the study area. Areas which reflected poor or absence of green activity had very low to negative NDVI values whereas areas having green activity had values above 0.1. The C-factor map in response to the NDVI values also presented a range of values falling between 0.33-1.34, where values approaching 0 are well protected and those closest to 1 and above are either water bodies or unprotected land surfaces. The table 1 shows the NDVI and C-factor values extracted for the selected sites within the study area
Table 1. Value for NDVI and C-Factor.
LOCATION NDVI C-FACTOR
Ehime Mbano 0.174 0.291
Ideato North 0.247 0.231
Ikeduru 0.251 0.229
Oguta 0.197 0.272
Ohaji 0.286 0.200
Okigwe 0.087 0.360
Orlu 0.261 0.220
Owerri West 0.242 0.236
The NDVI values for all the locations considered were between 0.087-0.286, with Okigwe having the lowest value of 0.087 and Ohaji having the highest value of 0.286. An NDVI value of between 0.025-0.090 represents bare ground while NDVI values of range 0.140-0.5 represent medium vegetative cover [4]. Apart from Okigwe which reveals open ground all the other locations under consideration fall within regions of medium vegetative cover. The C-factor for all the locations fell within 0.20-0.36, with Okigwe having the highest values of 0.36, which shows a greater ratio of soil loss in absence of conservative measures when compared to other locations. A C-factor value of 0.20 represents built up areas while areas having C-factor values between 0.2-0.49 represents an intermediate blend of agricultural lands/fields, partial shrub distribution and scattered forests with settlements and villages [29].
4. Conclusion
The NDVI values and C-factor generated from maps for the locations under consideration places the study area within a zone of medium vegetative cover. This implies that although the study area falls within the tropical rainforest, the vegetative cover is not sufficient enough to reduce the rate of soil erosion by water because the soil is exposed to detachment and sediment transport through runoff. The uneven distribution of vegetation caused due to human interference on the environment through building/road construction, mining/exploration and rural-urban migration exposes the study area to recurrent erosion attacks thus reducing the availability of cultivable land for agriculture to sustain food security. It is therefore imperative that forest
regeneration activities, tree-planting exercises and shrub growth schemes be encouraged so as to ensure proper cover for soil management.
Acknowledgements
The authors would like to acknowledge the assistance of Tertiary Education Trust Fund (TETFUND) for sponsoring this research.
References
[1] E. L. Rahman, M. A. Abd, Ali, R. R, Hussain, M. A and M. A. El-Semey. Remote Sensing and GIS based physiography and soils mapping of the Idku-Brullus Area, North Delta, Egypt: Egyptian Journal of Soil Science 49 (3): 209-432, 2009. [2] D. Pimentel, P. Hepperly, J. Hanson and R. Seidel.
Environmental, energetic, and economic comparisons of organic and conventional farming systems. BioScience 55, 573-582, 2005.
[3] H. Eswaram, R. Lal and P. F. Reich. Land degradation: an overview. In Response to Land Degradation, eds. E. M. Bridges, I. D., 2001.
[4] N. R. Dalezious, A. Loukas and D. Bampzelis. Spatial Variability of reference Evapotranspiration in Greece. Physics and Chemistry of the earth parts A/B/C 2 (23:24):1031-1038, 2002.
[5] A. C. Ekwe, N. N. Onu and K. M. Onuoha. Estimation of Hydraulic Characteristics from Electric Sounding data: the case of middle Imo River Basin Aquifers, South-eastern Nigeria. Journal of Spatial Hydrology 6 (2):121-132, 2009. [6] G. E. Ashiagor, K. Forkuo, P. Laari and R. Aabeyor,.
Modelling Soil Erosion using RUSLE and GIS tools. International Journal of remote sensing and Geosciences; Vol. 2 (4):7-17, 2013.
[7] M. N. Ezemonye and C. N Emeribe, Rainfall Erosivity in southeastern Nigeria, Ethiopian Journal of Environmental Studies and Management 5 (2), 2012: 112-122.
[8] B. Humberto and R. Lal. Principles of Soil Conservation and Management, first edition Springer publishers, 4-6pp. 2008. [9] B. I. Ijeh, B. I., and N. N Onu. Assessment of Pollution Levels
of Groundwater In Parts of Imo River Basin, South-Eastern Nigeria. International Journal of Water Resources and Environmental Engineering 5 (4):194-202, 2013.
[10] M. Kouli, P. Soupios and F. Vallianatos. Soil Erosion prediction using the Revised Universal Soil Loss Equation (RUSLE) in a GIS framework, Chania, Northwestern Crete, Greece. Environmental Geology 57 (1): 483-497, 2009. [11] R. A. Leonard, W. G. Knisel, and D. A. Still. GLEAMS:
Groundwater Loading Effects of Agricultural Management Systems. Transactions of the American Society of Agricultural Engineers 30:1403-1418, 1987.
[13] Okorafor, N. A. A Okereke, and C. C. Egwuonwu. Evaluation of the hydropower potential of Otamiri river for Electric power generation. Research Journal of Applied Sciences, Engineering and Technology 6 (24):4541-4547, 2013. [14] Okorafor, C. O Akinbile, A. J Adeyemo and C. C. Egwuonwu,
C. C. Determination of Rainfall Erosivity Index (R) for Imo State. American Journal of Engineering Research 6 (2):13-16, 2017.
[15] B. C. Okoro, R. A. Uzoukwu and N. M Chiemezie. River Basins of Imo State for sustainable water resource management. Journal of Civil and Environmental Engineering 4 (1):1-8.2014.
[16] P. P Panagos, Borrelli, J. Poesen, C. Ballabio, E. Lugato, K. Meusburger, L. Montanarella and C. Alewell. The new assessment of soil loss by water erosion in Europe. Environmental Science and Policy 54 (2015):438- 447, 2015. [17] R. J Patil and S. K Sharma. Remote Sensing and GIS based
modeling of crop/cover management factor (C) of RUSLE in Shakkar river watershed. International Conference on Chemical, Agricultural and Medical Services, (CAMS-2013), Dec. 29-30, 2013 Kuala Lumpur, Malaysia, 2013.
[18] D. Pimentel. Soil erosion: a food and environmental threat. Environment, Development and Sustainability 8 (1):119-137, 2006.
[19] S. D. Angima, D. E Stott, M. K O’Neil, C. K Ong and G. A. Weesies. Soil erosion prediction using RUSLE for central Kenyan highland conditions for Agriculture, Ecosys and Environ 97: 295–308. 2003. http://dx.doi.org/10.1016/S0167-8809 (03) 00011-2
[20] V. Prasannakumar, H. Vijith., S. Abinod and N. Geetha. Estimation of soil erosion risk within a small mountainous sub-watershed in Kerala, India, using Revised Universal Soil Loss Equation (RUSLE) and geo-information technology. Geoscience Frontiers 3 (2), 209-215, 2012.
[21] K. Ahmet. Estimation of C factor for soil erosion modeling using NDVI in Buyukcekmece Watershed. Ozean Journal of Applied Science 3 (1):1-4, (2010).
[22] K. G. Renard, G. R. Foster, G. A. Weesies, D. McCool, D. C. Yoder, D. C. Predicting Soil Erosion by water: A guide to Conservation Planning with the Revised Universal Soil loss equation (RUSLE). USDA, Agriculture Handbook No. 703, Washington DC, 1997.
[23] K. G. Renard, G. R Foster, G. A. Weesis and D. K. McCool. Predicting soil erosion by water a guide to conservation planning with the RUSLE agricultural Handbook 703. US government Print Office Washington DC, 1996.
[24] J. C. Ritchie, D. E. Walling and J. Peters. Application of geographic information systems and remote sensing for quantifying patterns of erosion and water quality. Hydrological Processes 17: 885-886, 2003.
[25] A. O. Selemo, Ananaba, S. E, Nwagbara, J. O, Egejuru, V. E and V. Nwugha, Geostatistical Analysis of Rainfall Temperature and evaporation Data of Owerri for Ten years. Journal of Earth and Environmental Sciences, 2012 (2) 195-205, 2012.
[26] R. Suresh, Soil and Water Conservation Engineering, 4th Edition Standard Publishers Distributors: New Dehli 2012. [27] U. P. Udoka, G. I. Nwankwor, C. A. Ahiarakwem, A. I. Opara,
T. T. Emberga, G. E. Inyang. Morphometric Analysis of Sub- watersheds in Oguta and Environs, Southeastern Nigeria Using GIS and Remote Sensing Data. Journal of Geosciences and Geomatics. 2016, 4 (2), 21-28, 2016.
[28] J. M. Van der Knijff, R. J. A. Jones and L. Montanarella. Soil Erosion Risk Assessment in Europe. Office for Official publications of the European Communities, Luxembourg pp. 34-35, 2000.
[29] H. P. Vishvam, P. L Pradeep and P. Indra. Estimation of runoff and soil erosion for Vishwamitri River wastershed western India using RS and GIS. American Journal of Water Science and Engineering 1 (2):7-14, 2015.
[30] W. H. Wischmeier, and D. D Smith. Predicting rainfall erosion losses — A guide to conservation planning: United States Department of Agriculture Agricultural Handbook, 537. U. S. Government Printing Office, Washington D. C., USA, 1978. [31] D. A. Woolhiser, R. E. Smith, and D. C. Goodrich.
KINEROS, A kinematic runoff and erosion model: Documentation and User Manual. U. S. Department of Agriculture, Agricultural Research Service, ARS-77, 130, 1990.
![Figure 2. Geological map of Imo State [27].](https://thumb-us.123doks.com/thumbv2/123dok_us/8483830.1714682/4.595.113.483.76.733/figure-geological-map-of-imo-state.webp)