Misclassi
fi
cation of Newborns Due to Systematic
Error in Plotting Birth Weight Percentile Values
WHAT’S KNOWN ON THIS SUBJECT: Percentile charts for birth weight are used to assess the somatic development of neonates (small, appropriate, or large for gestational age).
WHAT THIS STUDY ADDS: A systematic error was identified in the majority of birth weight percentile charts. As a consequence, small for gestational age rates are overestimated and large for gestational age rates are underestimated;∼5% of neonates are misclassified.
abstract
OBJECTIVES: Higher than expected small for gestational age (SGA) rates and lower than expected large for gestational age (LGA) rates have been observed. A possible explanation is a leftward shift of per-centile curves for birth weight due to a systematic error in plotting birth weight values in charts (ie, plotting weekly mean birth weight data at the beginning of the weeks). Our objectives were to assess how common this plotting error is and to analyze the effect of this error on SGA and LGA classification based on data from the German perinatal survey.
METHODS:First, a systematic literature search for birth weight charts was performed, and the charts were analyzed for the plotting error. Second, percentile values (10th, 50th, and 90th) for 25 to 42 completed weeks of gestation were calculated from the data of 1 181 200 male singleton newborns (German perinatal survey, 1995–2000). Birth weight percentile curves were calculated with and without the plot-ting error, and the resulplot-ting SGA and LGA rates were analyzed.
RESULTS:Fourteen of the 16 identified publications contained the sys-tematic error in plotting. Using our calculated percentile curves, a left-ward shift caused by the plotting error led to an SGA rate of 12.5% and an LGA rate of 7.7%;∼5% of newborns were misclassified.
CONCLUSIONS: Percentile charts should be examined for the de-scribed systematic error and, if necessary, corrected. Pediatrics 2012;130:e347–e351
AUTHORS:Niels Rochow, MD,aPreeya Raja, BSc,a
Sebastian Straube, BM BCh, MA (Oxon), DPhil,band
Manfred Voigt, PhDc
aDivision of Neonatology, Department of Pediatrics, McMaster
University, Hamilton, Ontario, Canada;bDepartment of
Occupational, Social and Environmental Medicine, University Medical Center Göttingen, Göttingen, Germany; andcGerman
Center for Growth, Development and Health Encouragement During Childhood and Youth, Working Group Rostock– Sievershagen, Sievershagen, Germany
KEY WORDS
percentile charts, somatic classification of neonates ABBREVIATIONS
LGA—large for gestational age SGA—small for gestational age
Dr Rochow conceived of the study and was involved in literature searching and data analysis; P. Raja was involved in literature searching; and Dr Voigt was involved in data analysis. All authors were involved in writing the paper.
www.pediatrics.org/cgi/doi/10.1542/peds.2011-3884
doi:10.1542/peds.2011-3884
Accepted for publication Apr 16, 2012
Address correspondence to Niels Rochow, MD, Division of Neonatology, Department of Pediatrics, McMaster University, 1280 Main St West, HSC-4F5, Hamilton, ONT, Canada L8S 4K1. E-mail: [email protected]
PEDIATRICS (ISSN Numbers: Print, 0031-4005; Online, 1098-4275).
Copyright © 2012 by the American Academy of Pediatrics
FINANCIAL DISCLOSURE:The authors have indicated they have nofinancial relationships relevant to this article to disclose.
FUNDING:No external funding.
a recent neonatal survey reported an SGA rate of 16.1%.1
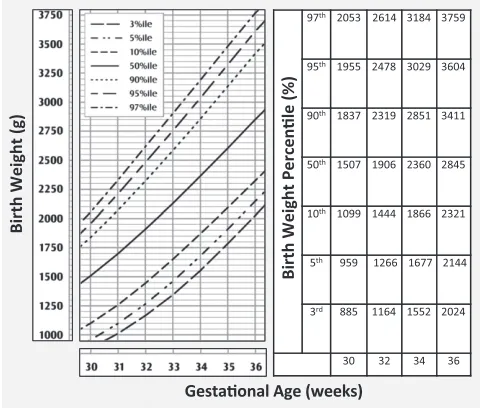
A systematic error may explain this variation in SGA and LGA rates. Percentile values of birth weight for gestational age are calculated for completed weeks. We observed that, instead of plotting these weekly average percentile values for birth weight at the mean gestational age for the completed week in question, values are commonly plotted at the start of the week (Fig 1). This leads to curves that are shifted leftward along the x-axis (gestational age). Thus, the cutoff values
Medline (via Ovid), PubMed, and Web of Science were searched for full-text articles published between January 1995 and November 2011 by using the search terms“birth weight percentile,”
“birth weight chart,” “growth chart,”and
“growth standard.” The references of the retrieved articles were screened for further relevant papers; publications citing the retrieved articles were also assessed (for the Web of Science search). Publications written in English or German that presented birth weight percentile values according to gestational
birth weight percentile values from the numerical data were not plotted at the average gestational age of each completed week but rather at the beginning of the week.
Analysis Based on Data From the German Perinatal Survey
Day-specific birth weight data of 1 181 200 male singleton infants with gestational ages of 25 to 42 completed weeks were obtained from the German perinatal sur-vey of 1995–1997 (when all German fed-eral states except Baden-Württemberg had kindly contributed data to our da-tabase) and of 1998–2000 (when the following German federal states had contributed data: Bavaria, Brandenburg, Hamburg, Lower Saxony, Mecklenburg-Western Pomerania, Saxony, Saxony-Anhalt, and Thuringia).
Weekly mean values for each completed week of gestation were calculated from the day-specific birth weight data. Per-centiles (10th, 50th, and 90th) were then computed with the SPSS EXAMINE com-mand by using the HAVERAGE distribution function (SPSS Inc, Chicago, IL). Percen-tile curves were constructed by using the calculated mean birth weight percentile values for each completed week as the y-coordinate and as the x-coordinate (Fig 2), the following: scenario 1, the mean gestational age (for that week of gestation); or scenario 2, the start of the completed week of gestation in question.
For these 2 scenarios, percentile values specified by the day were computed FIGURE 1
Systematic error in plotting percentile values of birth weight as seen in a published Canadian perinatal survey. Illustrated is part of a birth weight percentile chart (available at: http://www.phac-aspc.gc.ca) that was based on data published by Kramer et al.9Percentile values computed from birth weights for
from the weekly data for the 10th, 50th, and 90th percentiles of birth weight. Calculations were performed for the age range 25 weeks + 0 days (175 days) to 42 weeks + 6 days (300 days) by using the cubic spline method. The sample infant population from the German perinatal survey was then classified by computing day-specific 10th and 90th percentile values generated for the aforementioned scenarios. For an as-sessment of the effect of the plotting error, SGA and LGA rates obtained by using the 10th and 90th percentile values generated by using the 2 sce-narios were compared. The differences in birth weight between the percentiles that were generated by using scenarios 1 and 2 were then calculated for each week of gestation.
RESULTS
Literature Search
The search generated 832 Medline (via Ovid), 868 PubMed, and 59 Web of Science hits. Sixteen publications met our inclusion criteria.2–17The plotting
error was identified in 14 of these 16 publications.2–15
Analysis Based on Data From the German Perinatal Survey
In this simulation, percentile curves of birth weight for gestational age with the
systematic plotting error were shifted leftward compared with the percentile curves constructed“correctly”with the mean weekly birth weight plotted at the mean gestational age for each completed week. The average leftward shift of the percentile curves was 0.43 weeks (∼3 days).
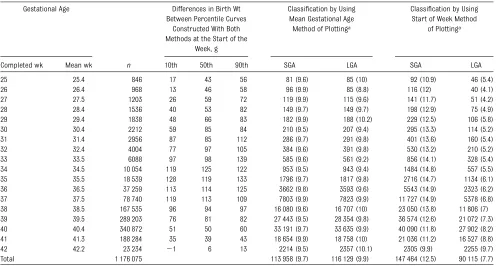
Newborn classification using the per-centile curves with the systematic plotting error yielded an SGA rate of 12.5% and an LGA rate of 7.7% (Table 1). In comparison, when using the curves generated correctly, the SGA rate was 9.7% and the LGA rate was 9.9%. Our analysis therefore revealed that 2.8% of the newborn population who were really appropriate for gestational age were incorrectly classified as SGA and 2.2% of the population who were really LGA were incorrectly classified as ap-propriate for gestational age.
The 10th, 50th, and 90th percentile curves of birth weight constructed with and without the systematic error differed by up to 139 g (Table 1).
DISCUSSION
In the current study, we have identified a systematic plotting error in percentile charts of birth weight for gestational age. In our analysis, plotting weekly per-centile values of birth weight at the start of the completed week of gestation
resulted in a leftward shift of cutoff values, causing∼5% of newborns to be misclassified. The percentile curves were displaced to the left by an average of ∼3 days, causing the curves to in-dicate a higher birth weight reference value for a given age. Leftward shifted percentile curves result in the over-estimation of SGA rates and under-estimation of LGA rates.
In our simulated birth weight per-centile charts, perper-centile curves that were computed without the system-atic error resulted in SGA and LGA rates of 9.7% and 9.9%, respectively, and were close to the expected 10% rate. The slightly lower than expected rates may be attributed to the defi -nition of SGA and LGA to not include infants whose birth weights fall di-rectly on the computed 10th and 90th percentile curves.
Classifying infants according to their birth weight by using completed weeks of gestation decreases the precision of classification to a weekly period. Voigt et al17demonstrated that with
percen-tile values based on weekly data rather than daily data and by using tabulated values (not charts), SGA rates were overestimated and LGA rates were underestimated on the first days of every week. Conversely, SGA rates were underestimated and LGA rates FIGURE 2
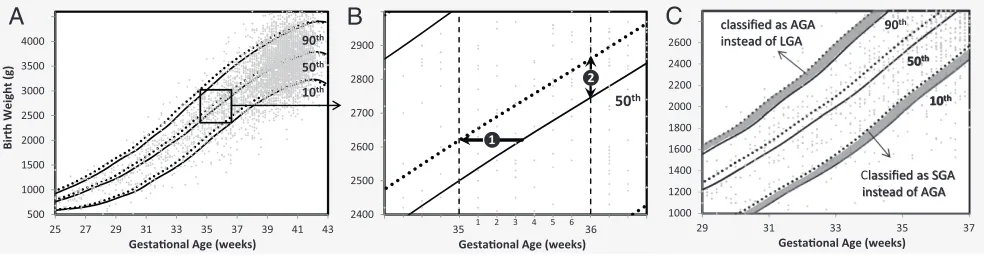
Comparison of percentile value plotting methods. In panels A-C, gray diamonds represent individual birth weight values. A, 10th, 50th, and 90th percentile curves computed from birth weight for gestational age data of male singletons are plotted at the start of each completed week (dotted lines) and at the mean age for that week (solid lines). B, A magnified portion of the birth weight chart presented in panel A: (1) represents the leftward shift that is produced by the described systematic plotting error; and (2) shows the difference in birth weight percentile values at 36 + 0/7 weeks of gestation for the 50th percentiles plotted with and without the systematic error. C, The gray areas represent the ranges of birth weight values in which infants are classified differently with both plotting methods.
overestimated on the last days of every week. This is because infants born at the beginning of a week have lower birth weights compared with infants born at the end of the same week. The effect on SGA and LGA rates described there differs from the phe-nomenon described in the current pa-per. In the study by Voigt et al, the overestimation and underestimation occurred when tabulated percentile values for completed weeks of gesta-tion were used to classify newborns and were due to using the same average weekly value for every day of the week. This does not occur in plotted growth charts because each day corresponds
to a different point on the birth weight percentile curve.
Newborn classification is used in clin-ical decision-making, rendering the systematic plotting error described here an issue of concern. SGA and LGA infants are at an increased risk for perinatal morbidity, associated health problems (such as neurodevelopmental disorders), and metabolic alterations in later life. Meaningful SGA and LGA clas-sification requires the following: (1) accurate knowledge of gestational age; (2) accurate measurement at birth of weight, length, or head circumference; and (3) cutoff values based on reference data from a relevant population.18
Because the described systematic plot-ting error causes a horizontal shift of the percentiles, the cutoff values for identifying SGA and LGA infants are af-fected, and newborn classification may be incorrect. Percentile charts used in clinical practice should be examined for the described error to ensure that weekly percentile values are plotted correctly (ie, at the mean gestational age of each completed week).
ACKNOWLEDGMENTS
We are grateful to the German federal states that contributed data to our peri-natal database and to the clinicians who were involved in data collection.
REFERENCES
1. Annual report 2009. Canadian Neonatal Network. Available at: www.canadianneonatalnetwork. org. Accessed October 10, 2011
2. Alexander GR, Himes JH, Kaufman RB, Mor J, Kogan M. A United States national ref-erence for fetal growth. Obstet Gynecol. 1996;87(2):163–168
3. Alshimmiri MM, Al-Saleh EA, Alsaeid K, Hammoud MS, Al-Harmi JA. Birthweight percentiles by gestational age in Kuwait.
Arch Gynecol Obstet. 2004;269(2):111– 116
4. Beeby PJ, Bhutap T, Taylor LK. New South Wales population-based birthweight percentile
charts.J Paediatr Child Health. 1996;32 (6):512–518
5. Bertino E, Spada E, Occhi L, et al. Neonatal anthropometric charts: the Italian neonatal study compared with other European stud-ies.J Pediatr Gastroenterol Nutr. 2010;51(3): 353–361
33 33.5 6088 97 98 139 585 (9.6) 561 (9.2) 856 (14.1) 328 (5.4) 34 34.5 10 054 119 125 122 953 (9.5) 943 (9.4) 1484 (14.8) 557 (5.5) 35 35.5 18 539 128 119 133 1796 (9.7) 1817 (9.8) 2716 (14.7) 1134 (6.1) 36 36.5 37 259 113 114 125 3662 (9.8) 3593 (9.6) 5543 (14.9) 2323 (6.2) 37 37.5 78 740 119 113 109 7803 (9.9) 7823 (9.9) 11 727 (14.9) 5378 (6.8) 38 38.5 167 535 96 94 97 16 080 (9.6) 16 707 (10) 23 050 (13.8) 11 806 (7) 39 39.5 289 203 76 81 82 27 443 (9.5) 28 354 (9.8) 36 574 (12.6) 21 072 (7.3) 40 40.4 340 872 51 50 60 33 191 (9.7) 33 635 (9.9) 40 090 (11.8) 27 902 (8.2) 41 41.3 188 284 35 39 43 18 654 (9.9) 18 758 (10) 21 036 (11.2) 16 527 (8.8) 42 42.2 23 234 21 6 13 2214 (9.5) 2357 (10.1) 2305 (9.9) 2255 (9.7) Total 1 176 075 113 958 (9.7) 116 129 (9.9) 147 464 (12.5) 90 115 (7.7)
6. Bonellie S, Chalmers J, Gray R, Greer I, Jarvis S, Williams C. Centile charts for birthweight for gestational age for Scottish singleton births. BMC Pregnancy Child-birth. 2008;8(1):5
7. Fenton TR. A new growth chart for preterm babies: Babson and Benda’s chart updated with recent data and a new format.BMC Pediatr. 2003;3:13
8. Fu J, Yu M. A hospital-based birth weight analysis using computerized perinatal data base for a Chinese population.J Matern Fetal Neonatal Med. 2011;24(4):614–618 9. Kramer MS, Platt RW, Wen SW, et al; Fetal/
Infant Health Study Group of the Canadian Perinatal Surveillance System. A new and improved population-based Canadian reference for birth weight for gestational age.Pediatrics. 2001;108(2). Available at: www.pediatrics.org/cgi/content/full/108/ 2/e35
10. Niklasson A, Albertsson-Wikland K. Con-tinuous growth reference from 24th week
of gestation to 24 months by gender.BMC Pediatr. 2008;8:8
11. Olsen IE, Groveman SA, Lawson ML, Clark RH, Zemel BS. New intrauterine growth curves based on United States data. Pedi-atrics. 2010;125(2). Available at: www.pedi-atrics.org/cgi/content/full/125/2/e214 12. Riddle WR, DonLevy SC, Lafleur BJ,
Rosenbloom ST, Shenai JP. Equations describing percentiles for birth weight, head circumference, and length of pre-term infants.J Perinatol. 2006;26(9):556– 561
13. Visser GH, Eilers PH, Elferink-Stinkens PM, Merkus HM, Wit JM. New Dutch reference curves for birthweight by gestational age.
Early Hum Dev. 2009;85(12):737–744 14. Voigt M, Fusch C, Olbertz D, et al. Analysis of
the neonatal collective in the Federal Re-public of Germany 12th report. Presentation of detailed percentiles for the body mea-surement of newborns [in German].
Geburtshilfe Frauenheilkd. 2006;66(10): 956–970
15. Voigt M, Rochow N, Hesse V, Olbertz D, Schneider KT, Jorch G. Short communication about percentile values of body measures of newborn babies [in German].Z Geburtshilfe Neonatol. 2010;214(1):24–29
16. Oken E, Kleinman KP, Rich-Edwards J, Gillman MW. A nearly continuous measure of birth weight for gestational age using a United States national reference.BMC Pediatr. 2003;3:6 17. Voigt M, Rochow N, Straube S, Briese V, Olbertz D, Jorch G. Birth weight percentile charts based on daily measurements for very preterm male and female infants at the age of 154-223 days. J Perinat Med. 2010;38(3):289–295
18. Clayton PE, Cianfarani S, Czernichow P, Johannsson G, Rapaport R, Rogol A. Man-agement of the child born small for gesta-tional age through to adulthood: a consensus statement of the International Societies of Pediatric Endocrinology and the Growth Hormone Research Society.J Clin Endocrinol Metab. 2007;92(3):804–810
sub
http://www.aappublications.org/cgi/collection/fetus:newborn_infant_ Fetus/Newborn Infant
following collection(s):
Permissions & Licensing
http://www.aappublications.org/site/misc/Permissions.xhtml
in its entirety can be found online at:
Information about reproducing this article in parts (figures, tables) or
Reprints
http://www.aappublications.org/site/misc/reprints.xhtml
DOI: 10.1542/peds.2011-3884 originally published online July 23, 2012;
2012;130;e347
Pediatrics
Niels Rochow, Preeya Raja, Sebastian Straube and Manfred Voigt
Percentile Values
Misclassification of Newborns Due to Systematic Error in Plotting Birth Weight
http://pediatrics.aappublications.org/content/130/2/e347
located on the World Wide Web at:
The online version of this article, along with updated information and services, is
by the American Academy of Pediatrics. All rights reserved. Print ISSN: 1073-0397.