3480 IJSTR©2020
A Comparative Study On Parameter Estimation
Methods For Big Data Analysis Based On
Random Sample
Abdul Alim, Diwakar ShuklaAbstract: The big data has tendency to grow drastically in digital platform in terms of volume, variety and velocity. Being such a huge data, the parameter estimation of whole big data setup is time and cost consuming. To cope up, the sampling methodologies could be used. Consider a digital platform (like a social media site) where large number of users is registered and they used to communication text messages, videos, pictures, songs etc. to each other. By virtue of that, the web-space at data-center increases in fast manner over time. The average size estimation of these messages is a problem which needs to be studied. This paper presents sampling-based methodology to compute the mean size of communication material among users over the digital platform. The computation helps to forecast about future need of web-space in data centers for better management and services to the users. Furthermore we have comparative studied three probabilistic sampling techniques and compare their results and the efficiency of method is tested using confidence interval.
Keywords: Big Data, Big Data Parameters, Estimation Method, Sampling Techniques, Internet of Things, Dataset. —————————— ——————————
1 INTRODUCTION
In big data environment, millions of files with different characteristics are frequently generating through different variety of software applications and the data is storing appropriate location or data centers. For example millions of people in a social media are analyzed to understand their sentiments on different policies in various social groups. Due to availability and growth of data rate through different user’s friendly devices, data volume goes beyond the available computing resources such as storage and processing problems. The data storage problem is a biggest problem in big data era. There is no specific idea that the users how much data will produce next day because there are lots of mobile applications are running in parallel mode. So in that situation if we want to know about users behaviors in respect to data produced in specific time interval like 𝑡, 𝑡 , 𝑡 , … 𝑡 ; and with the different feature of data. For example any user on social network can produce image data, video data, text data, etc. at any particular time. For analysis those data separately (text, image, video) then it is very difficult to do that because the data is so large with different features it is also known as unstructured data. If we only analyze some small dataset without considering the entire big dataset and use the results of each small units of dataset to estimate the result of entire big dataset, this process is known as sampling process. Through the sampling techniques the above problem can be solved. A statistical approach can be estimated and inferred from the results of random samples of big data. Therefore a new big data estimation method is required to predict the valuable information for current as well as future used in big data set-up [1].
At present the sampling-based methodology are spreading in different area as where the data is available in large size, although most study are performed using samples where the sample frame is the group of individuals that can be selected from the target dataset. The sampling methodology can be defined as the process through which individuals unit are selected from the target dataset. There are mainly two types of sampling techniques which are probabilistic and non-probabilistic sampling. In non-non-probabilistic sampling likelihood of selecting some individuals from the target dataset is null. These types of sampling techniques does not have equal chance to select each element in the population or dataset and in probabilistic sampling every element has equal chance to select as a sample [2]. This paper has focused three types of probabilistic sampling methods such as simple random sampling, stratified sampling and systematic sampling.
2
BIG
DATA
Big data can be defined with three characteristics volume, variety and velocity. In other words if any dataset will satisfy 3vs properties the it can say the data is big dataset. The 3vs is volume (large amount of data), variety (different types of data like text, image, video etc.) and velocity (high speed generation, capturing and consumption of data). Due to availability of unstructured data it becomes a challenging problem to process the whole data at a time. Data scientist are faced with many big data related challenges and one of the problem is to store the huge volume of data which generated from the different wide variety of digital devices. Some another problem also there, like extraction of valuable information from the huge dataset, data cleaning for reliability, privacy and security problem etc [3]. At present the big data is available everywhere like social media, health sectors, education sector, weather department, share market and many more but nowadays, Internet of Things (IoT) is very popular to generate lots of data using smart sensor devices. Those smart devices and internet to provide innovative solutions for various businesses, government and private industries across world. The following figure 1 shows the general working of IoT. The IoT is play important role in multidisciplinary vision and to provide its benefits into several areas like environmental, medical, transportation, industrial and many more [4].
______________________________________
• Abdul Alim Ph.D. Research Scholar, Department of Computer Science and Applications, Dr. Harisingh Gour Vishwavidyala Saga (MP), India, [email protected]
3481 IJSTR©2020
www.ijstr.org Fig. 1. The General Architecture of IoT
2.1 BIG DATA PARAMETERS
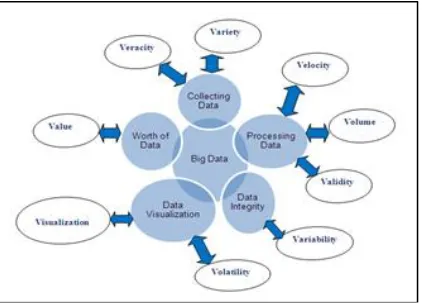
After 3Vs of big data, some authors have extended some other Vs also then now big data has 9Vs of big data. In big data, the different big data Vs are exploring different characteristics of big dataset. The following figure 2 has categorized of big data with their characteristics.
Fig. 2. The Deferent Parameters of Big Data
According to figure 2, the big data can be categorized into four different ways- collecting data, processing of data, integrity of data, worth of data and data visualization. The big data has basic three properties which is decide the given data is big or not and the properties or parameter are volume, variety and velocity. Now some authors have explored the big data using some extended Vs also which is shown in figure 2. The veracity tell us that the biases, noise and abnormality in collected dataset, variety referred to types of data like structured and unstructured, velocity (how fast data is to be produces), Volume is a size of data in the form of terabyte, petabyte, Exabyte, zettabyte, etc., validity is just tell us the correctness and accuracy of data for the intended, variability referred to that the data flow may be highly inconsistent, volatility (recall the retention policy of structured data that they implement every day in business), visualization makes all that large amount of data comprehensible and easy to understand and read, and value has low-value density as a result of extracting value from massive data [5].
3 PARAMETER
ESTIMATION
PROBLEMS
Parameter estimation method play an important role where the
data is available in large amount and find out target value of unknown parameter from those massive data with minimum time and cost. The sampling-based estimation methods help in building a reliable predictive model for a big data set-up and in which we can estimate the unknown parameter using small sample unit from the entire dataset with minimum cost and time. In big data era, there are different estimation problems like find out the mean average size of value in different time intervals, growth rate of data size in variety (text, video, and image) of data volume in different time interval. Due to huge volume the processing of these dataset it will take more cost and time so decrease the cost of data processing we have introduce sample-based parameter estimation method that is reliable to develop an efficient estimation model to solve the above problems [6].
4 SAMPLING
TECHNIQUES
Sampling techniques is used most frequently in our daily life in all kind of investigations. A sampling method is a scientific and objective procedure of selecting units from a dataset or population and provides a samples that is expected to be representative of population as whole. Sampling method are used in almost every sectors extensively in business and industry to increase operational efficiency. It is also play very important role in problems encountered in market research like estimating the size of readership of news-magazine. At present time it is frequently used in computer science because the technologies are growing very fast in day-to-day life. Through that technologies users are producing continuously data in different formats such as text, image, video, logs etc. for the big data visualization usually requires first generating a small and representative data sample that can be easily calculated and interpreted to generate insight. The data exploration is a very complex task for the data scientist because the data exploration includes the different acts like creating graphs and plot, finding anomalies, transforming the data, estimate mean size of data, etc. Sometimes it is not feasible for data scientist to perform that task on entire big dataset so in this situation we can apply sampling techniques on large dataset or big data. This paper has focused on three following sampling techniques [7, 8].
4.1 SIMPLE RANDOM SAMPLING
The simple random sampling method can be used where the entire dataset or population which accessible and the investigator have a list of all subjects in this dataset. The sample selection procedure in simple random sampling can be lottery method or using computer algorithms [9]. The list of all units in the dataset is called the sampling frame and it is identifies the sampling unit in the dataset and their locations. There are many ways in which the sample may draw, it is depending on nature of the dataset and the information desired through the sample. The simple random sampling is most basic sampling method where each and every member within dataset has the equal chance of being selected in the sample [10]. The probability of n all specified unit are selected in n drawn is-
.𝑛 − 1 𝑁 − 1.
𝑛 − 2 𝑁 − 2…
1 𝑁 − 𝑛 + 1=
𝑛! (𝑁 − 𝑛)!
𝑁! =
1
𝑁
3482 IJSTR©2020
population.
4.2 STRATIFIED SAMPLING
The stratified random sampling does not have guarantee that all the segments of the population will be represented in the sample; on the other hand the stratified sampling enables one to draw a sample representing different segments of the population to any desired extent. Stratified sampling assumes knowledge of strata sizes and the availability of a frame for draw a sample from each stratum.
4.3 SYSTEMATIC SAMPLING
Systematic sampling is a probability sampling technique in which only the first unit is randomly selected and the rest being automatically selected through a predetermined pattern or systematic sampling. It is more precise than simple random sampling and easier to draw a sample and execute without mistakes. Assume that there are N units in the given dataset with file size in KB in some order then for selecting a sample of n units, first we take a first unit at random from the k units and every 𝑘 unit thereafter. For example if k is 10 and if the
first unit draw is one user’s fill at id 7, the subsequent units are user id 17, 27, 37, and so on. The starting of the subsequent by a random number chosen between 1 and k, where k should be a complete integer and to compute 𝑘 = 𝑁 𝑛⁄ , where N is the dataset, n is number of sample and k is the sampling interval. For selection any 𝑖 unit of the given dataset by randomly
such that 1 ≤ 𝑖 ≤ 𝑘; and then the systematic sample of n unit is- *𝑖, 𝑖 + 𝑘, 𝑖 + 2𝑘, … , 𝑖 + (𝑛 − 1)𝑘+. The following table 3 has shown that steps which perform systematic sampling [11].
5 DATASET
The following table 4 has shown the artificial dataset. The dataset has stored image, text and video with three different time intervals t_1,t_2 and t_3 . We have considered each file size in Megabyte. In this paper we have used same dataset for all three sampling techniques. The given dataset have N=100 users and each user has generated three types of data such
TABLE 1
SIMPLE RANDOM SAMPLING ALGORITHM
Step1 (𝑋
𝑖)𝑠𝑟𝑠=
1
𝑁 𝑋𝑖
𝑁
𝑖=
Compute population mean(𝑌 )
Step2 (𝑥
𝑖)𝑠𝑟𝑠=
1 𝑛 𝑥𝑖
𝑛
𝑖=
Compute sample mean(𝑦 )
Step3 (𝑆 )
𝑠𝑟𝑠=
1
𝑛 − 1 (𝑥 − 𝑥 )
𝑛 𝑖= Compute Variance Step4 𝐶𝐼 = 𝑦 𝑠𝑡 ± 𝑍 𝑆 𝑛
Confidence interval at 95%, where Z is desired confidence probability (%), S is Variance
TABLE 2
STRATIFIED SAMPLING ALGORITHM
Step 1
Collect the data from different servers, there are K-1 server in the population (volume). 𝑁 + 𝑁 + 𝑁 + ⋯ + 𝑁𝑘
Step 2
Applying stratified sampling techniques and divide the entire population (N) into different strata (P,Q,L). P(text), Q(images), and L(Video)
Step 3 Draw sample (n) from the strata, the sample is 𝑛 + 𝑛 + 𝑛 + ⋯ + 𝑛𝑘
Step 4 general weight- 𝑊𝑖=
𝑁𝑖 𝑁
Step 5
Estimation of mean for the proposed method 𝑦 𝑠𝑡= 𝑚𝑖= 𝑊𝑖𝑦 𝑖 population mean 𝑌 = 𝑛𝑗=0𝑊𝑗𝑌 𝑗of the study parameter (Y)
Step 6 𝑉(𝑦 𝑠𝑡) = 1 𝑛𝑖 −1 𝑁𝑖 𝑊𝑖 𝑆𝑖 𝑚 𝑖=
Estimation of variance of 𝑦 𝑠𝑡 which is unbiased estimator of the population
where 𝑆𝑖 (𝑡) =𝑁
𝑖− 𝑌𝑖𝑗− 𝑦 𝑖 𝑁 𝑖=
Step 7
(𝑦 )𝑇 ± 1.96 𝑉 (𝑦 )𝑇
The pooling value of 𝑦 𝑠𝑡 on time T is (𝑦 𝑠𝑡)𝑇 = 𝜃(𝑦 𝑠𝑡)𝑡 + 𝜃(𝑦 𝑠𝑡)𝑡 + ⋯ + 𝜃𝑞(𝑦 𝑠𝑡)𝑡𝑞
where 𝜃 is weight and the confidence interval from the population strata on a different time is-
TABLE 3
SYSTEMATIC SAMPLING ALGORITHM
Step1 Input dataset (N) ; Step2 Input sample size (n); Step3 Compute k, 𝑘 = 𝑁 𝑛⁄ ;
Step4 Select the random number between 1-k; Step5 Select first unit whose user id is I;
Step6 Compute
𝑛 = *𝑖, 𝑖 + 𝑘, 𝑖 + 2𝑘, … , 𝑖 + (𝑛 − 1)𝑘+;
Step7 (𝑌 𝑖)𝑠𝑦𝑡= 1 𝑁 𝑌𝑖 𝑁 𝑖= Compute population mean(𝑌 )
Step8 (𝑦 𝑖)𝑠𝑦𝑡= 1 𝑛 𝑦𝑖 𝑛 𝑖= Compute sample mean(𝑦 )
Step9
(𝑆 )𝑠𝑦𝑡= 1
𝑛 − 1 (𝑦 − 𝑦 ) 𝑛 𝑖= Compute variance- Step10 𝐶𝐼 = 𝑦 𝑠𝑡 ± 𝑍 𝑆 𝑛
3483 IJSTR©2020
www.ijstr.org
as text, image and video within different time interval. From 100 users we have selected n=25 users at random as a sample and perform the calculation on these sample. In simple random sampling we have select n=25 users at random from entire dataset (N=900) as a sample, therefore total population size is N=900, and the total sample size n=225, after that we have selected the sample through randomly and applied sampling techniques on theses samples. In stratified random sampling first we divided entire dataset into three strata basis on time intervals t_1,t_2 and t_3 further again each t_1 dataset have divided into three strata such as text, image and video. Now we have total 9 strata then we have selected the
sample (n=225) from each strata then we have performed the stratified sampling algorithm. In the systematic sampling we have N=900 dataset and the sample drawn from the dataset is n=25 users then the first we should compute value k through the k=N⁄n so the k value is 4. Now we have a sampling interval is 1-4, after that we have selected random number is 2 from the interval 1-4. The our first value is i =2, then the sample (n=25) is- n={i,i+k,i+2k,…,i+(n-1)k} . the systematic
sample
(n=25)is-2,6,10,14,18,22,26,30,34,38,42,46,50,54,58,62,66,70,74, 78,82,86,90,94,98 , these are the user id number which has being selected as a sample.
TABLE 4
DYNAMIC DATASET
At Time 𝒕 (Size in KB) At Time 𝒕 (Size in KB) At Time 𝒕 (Size in KB)
User-ID Text Image Video Text Image Video Text Image Video
1 300 800 100 190 550 113 450 1270 218
2 400 750 120 290 500 133 550 1220 238
3 250 300 10 140 50 23 400 770 128
4 900 500 210 790 250 223 1050 970 328
5 100 300 320 0 50 333 250 770 438
6 400 200 600 290 78 613 550 798 718
7 800 1400 20 690 1150 33 950 1870 138
8 900 856 10 790 606 23 1050 1326 128
9 400 7856 40 290 7606 53 550 8326 158
10 500 822 12 390 572 25 650 1292 130
11 700 458 13 590 208 26 850 928 131
12 200 469 15 90 219 28 350 939 133
13 250 153 16 140 56 29 400 776 134
14 245 789 18 135 539 31 395 1259 136
15 265 4569 10 155 4319 23 415 5039 128
16 110 900 0 0 650 13 260 1370 118
17 200 7500 3 90 7250 16 350 7970 121
18 26 8100 6 0 7850 19 176 8570 124
19 895 6900 9 785 6650 22 1045 7370 127
20 600 458 42 490 208 55 750 928 160
21 722 120 56 612 80 69 872 800 174
22 366 125 82 256 70 95 516 790 200
23 589 136 700 479 45 713 739 765 818
24 542 35 456 432 50 469 692 770 574
25 589 864 852 479 614 865 739 1334 970
26 542 800 12 432 550 25 692 1270 130
27 999 700 256 889 450 269 1149 1170 374
28 654 500 36 544 250 49 804 970 154
29 100 600 98 -10 350 111 250 1070 216
30 288 950 78 178 700 91 438 1420 196
31 500 560 95 390 310 108 650 1030 213
32 563 895 45 453 645 58 713 1365 163
33 560 456 58 450 206 71 710 926 176
34 52 759 56 0 509 69 202 1229 174
35 900 425 59 790 175 72 1050 895 177
36 700 135 52 590 40 65 850 760 170
37 900 428 53 790 178 66 1050 898 171
38 500 452 54 390 202 67 650 922 172
39 766 268 88 656 18 101 916 738 206
40 666 55 77 556 20 90 816 740 195
41 369 540 53 259 290 66 519 1010 171
42 852 520 86 742 270 99 1002 990 204
43 123 456 92 13 206 105 273 926 210
44 159 258 27 49 8 40 309 728 145
45 423 452 46 313 202 59 573 922 164
46 756 856 38 646 606 51 906 1326 156
47 856 458 72 746 208 85 1006 928 190
48 987 789 46 877 539 59 1137 1259 164
49 654 4000 10 544 3750 23 804 4470 128
3484 IJSTR©2020
51 600 136 120 700 850 89 100 1000 77
52 722 35 10 236 894 80 125 250 21
53 366 864 210 354 86 87 210 287 31
54 589 800 320 36 85 42 310 196 62
55 542 700 600 32 86 57 99 897 24
56 589 500 20 35 84 22 5 483 100
57 542 600 10 432 458 20 23 761 489
58 999 950 40 889 869 56 12 173 785
59 654 560 12 544 456 24 70 182 12
60 100 895 13 10 872 28 14 487 0
61 288 456 15 0 458 29 13 888 14
62 500 759 42 390 457 89 22 827 78
63 563 425 56 453 258 42 713 978 147
64 560 135 82 450 115 56 710 835 161
65 666 428 700 556 178 23 816 898 128
66 369 452 456 259 202 85 519 922 190
67 852 268 852 742 18 26 1002 738 131
68 123 456 12 13 206 62 273 926 167
69 159 258 256 49 78 12 309 798 117
70 423 452 36 313 202 23 573 922 128
71 523 856 98 413 606 25 673 1326 130
72 860 1253 85 125 250 12 1010 970 117
73 420 8900 56 152 263 42 570 983 147
74 83 1002 12 200 452 44 233 1172 149
75 300 500 900 320 1234 15 450 1954 120
76 100 500 20 154 1258 16 250 1978 121
77 331 852 24 456 142 17 481 862 122
78 405 836 10 231 789 18 555 1509 123
79 600 200 0 700 125 10 750 845 115
80 400 100 5 600 500 23 550 1220 128
81 100 800 410 210 1052 89 250 1772 194
82 775 4000 210 231 459 123 925 1179 228
83 880 500 80 410 836 58 1030 1556 163
84 600 1024 110 23 7895 69 750 8615 174
85 620 520 210 14 8597 42 770 9317 147
86 45 360 10 452 985 75 195 1705 180
87 50 63 100 96 9756 69 200 10476 174
88 450 890 241 32 800 85 600 920 33
89 210 100 30 15 900 45 360 852 25
90 891 758 133 26 858 23 1041 951 12
91 20 800 10 33 632 52 170 759 48
92 89 890 35 654 589 10 239 743 89
93 75 500 31 862 745 20 225 843 42
94 50 450 12 700 897 30 200 257 87
95 89 528 43 600 489 45 239 167 12
96 89 67 25 642 759 60 239 456 10
97 56 458 89 635 852 62 206 183 13
98 51 440 71 152 758 53 201 892 33
99 78 862 62 163 956 68 228 933 25
100 56 412 20 425 658 99 206 966 82
6 RESULT
AND
DISCUSSION
We have compared three sampling methods and their results. We have applied same dataset on the three sampling methods for analyze the mean average size of given dataset. The following table 5 has shown the simple random sampling result.
In the given dataset there are 900 hundred observation in different time interval 𝑡, 𝑡 𝑎𝑛𝑑 𝑡 from each we selected 25
sample like 25 image, 25 text, and 25 video of each user then we have total sample n=225. Here the population mean is lies within the confidence interval mean this is the 95% chance the mean average of the entire dataset will be lie within this confidence interval. The following table 6 has shown the result of systematic sampling.
The systematic sampling is better than the simple random sampling because the standard error
TABLE 5
RESULT SIMPLE RANDOM SAMPLING
N n 𝒀 𝒚 𝝈 𝑺𝒊𝟐
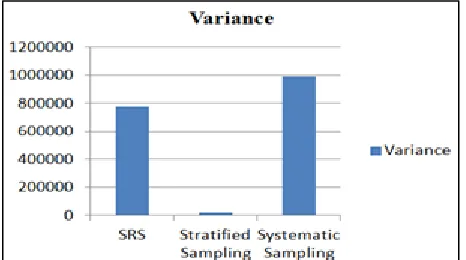
900 225 597.08 702.70 1528.54 779482.80 Confidence Interval 380 - 1026
TABLE 6
RESULT SYSTEMATIC SAMPLING
N n 𝒀 𝒚 𝝈 𝑺𝒊𝟐
900 225 597.08 545.59 993.94 990840.96
3485 IJSTR©2020
www.ijstr.org 𝜎 = 993.94 is less in comparison of simple random sampling. The following table 7 has shown the stratified random sampling.
In stratified random sampling first we have divided each
𝑡 into three strata like one is text second is image and third is video. Then we have total nine strata and each strata is calculated separately after that pooled the all value then we got final result for determine the confidence interval. In all three sampling methods we have calculated 95% confidence interval and the true value of population (𝑌 = 597.08) is lies between the confidence intervals with the 95% chances. The following figure 3, 4, and 5 has presented the graphical visualization of the above results.
Fig. 3. The Graphical Representation of Mean.
Fig. 4. The Graphical Representation of Variance.
Fig. 5. Graphical Representation of Standard Error.
7 CONCLUSION
This paper has presented the comparative analysis on three sampling methods such as simple random sampling, stratified random sampling and systematic sampling. Furthermore we have discussed the importance of sampling methods in big data era and have given demonstration of each method through using dynamic artificial dataset. We have also explained big data and their different parameters and need of sampling techniques in big data environment. This paper basically has calculated the mean size of population (dataset) on different time interval using sampling methods and compare the results to each other. The efficiency of each method has tested through confidence interval and we have found that the true value or target value which is known as population mean is lies within each method’s confidence interval.
8
REFERENCES
[1] Wei C., Salloum, S., Emara, T.Z., Zhang, X., Huang, J. Z., He, Y., ―A Two-Stage Data Processing Algorithm to Generate Random Sample Partitions for Big Data Analysis‖, In: Luo M., Zhang L., J. (eds) Cloud Computing – CLOUD 2018, CLOUD 2018. Lecture Notes in Computer Science, vol. 10967, Springer, Cham, 2018.
[2] Martínez-Mesa, Jeovany et al. ―Sampling: how to select participants in my research study?.‖ Anais brasileiros de dermatologia vol. 91, 3 , 2016. 326-30. doi:10.1590/abd1806-4841.20165254.
[3] Dheyab, S., A., Abdullah, M.N. and Abed, B.F. , ―A novel approach for big data processing using message passing interface based on memory mapping‖, J. Big Data 6, 112, 2019. DOI:10.1186/s40537-019-0275-3.
[4] Kumar, S., Tiwari, P. and Zymbler, M., ―Internet of Things is a revolutionary approach for future technology enhancement: a review:, J. Big Data 6, 111, 2019. DOI:10.1186/s40537-019-0268-2. [5] Alim, Abdul and Shukla, Diwakar, ―Big Data: Myth,
Reality and Parametric Relationship‖, International Journal of Advanced in Management, Technology and Engineering Sciences, 8(III), 1235-1244, 2018. [6] Aditya Tulsyan, Paul I., Barton, ―PERKS: Software for
Parameter Estimation in Reaction Kinetic Systems", Editor(s): Zdravko Kravanja, Miloš Bogataj,Computer
TABLE 7
RESULT STRATIFIED SAMPLING
T 𝒏𝒊 𝒚 𝝈 𝑺𝒊𝟐 (𝒚𝒔𝒕)𝑻 𝑽(𝒚𝒔𝒕)𝑻
𝑡
𝒏𝟏=25 643.87 921.6 3
59945.58
760.42 23315.39
𝒏𝟐=25 𝒏𝟑=25
𝑡
𝒏𝟏=25 737.73 1501. 40
90907.79
𝒏𝟐=25 𝒏𝟑=25
𝑡
𝒏𝟏=25 899.66 914.9 9
58985.13
𝒏𝟐=25 𝒏𝟑=25
3486 IJSTR©2020
Aided Chemical Engineering, Elsevier, Vol. 38, pp. 25-30, 2016. ISSN 1570-7946.
[7] Sukhatme, P., V., Sukhatme, B., V., Sukhatme, S., and Asok, C., ―sampling Theory of Surveys With Applications‖, third Ed., Lowa State University Press AMES, LOWA (USA), pp. 1-526, 1984.
[8] J. A. R. Rojas, M. Beth Kery, S. Rosenthal and A. Dey, "Sampling techniques to improve big data exploration," 2017 IEEE 7th Symposium on Large Data Analysis and Visualization (LDAV), Phoenix, AZ, 2017, pp. 26-35.
[9] Elfil, Mohamed, and Ahmed, Negida, ―Sampling methods in Clinical Research; an Educational Review.‖ Emergency (Tehran, Iran) vol. 5, 1 2017: e52.
[10]West, P.W., ―Simple random sampling of individual items in the absence of a sampling frame that lists the individuals‖, N.Z. j. of For. Sci. 46, 15 , 2016. doi:10.1186/s40490-016-0071-1.