(UDC: 624.075.2)
Determination of maximum deflection at cross bending parallelogram
plates using conformal radius ratio interpolation technique
V. I. Korobko1, A. V. Korobko1, A. A. Chernyaev1, S. Y. Savin1*
1
State University — Education-Science-Production Complex, Russia, 302020, Orel, Naugorskoe shosse, 29
*Corresponding author [email protected]
Abstract
In the article the task of cross bending of elastic isotropic plates with simply supported and clamped edge from the action of evenly distributed load is described. It is suggested to use form factor interpolation technique to determine the value of maximum plate deflection; and the ratio of inner conformal radius to the outer as a geometric argument is proposed to be used instead of form factor. Such replacement allows the increase of the technique accuracy.
Keywords: parallelogram plates, cross bending, maximum deflection, conformal radius ratio, form factor interpolation technique.
1. Introduction
Parallelogram plates are widely used in the building industry, machine construction, aircraft and shipbuilding as structural components accepting cross bending deformation (Harari et al. 2011; Marti 2013; Sadd 2014). The nowadays structural calculation is carried using numerical methods, particularly, the finite element method (FEM) (ANSYS; Zienkiewicz et al. 2014). The last one is the basis for many software packages, such as ANSYS. However, despite the high efficiency of numerical methods, such methods suffer from well-known significant drawbacks which assert in difficulty of analysis of calculating result, inability of estimating qualitative and quantitative assessment of the desired solution during variation of geometric parameters or design shape (plate in our case) (Korobko 1994; Polya, Szego 1951).
2. Method
The geometric entity of form factor interpolation technique is in choice of geometric transformation of prefixed plate in which family of plate forms contains at least two plates which solution is known or can be obtained by some methods (reference solutions). In case of parallelogram area, it is always possible to choose transformation (for instance, affine) in which the area is turned into a rectangle or rhomb. If solutions for rectangular and rhombic plate are known, then the solution for prefixed parallelogram plates can be found using the form factor interpolation. So, one needs to know all sets of solutions for rectangular and rhombic plate in case of using the form factor interpolation technique. Scientific and reference literature provides many task solution for rectangular plates under different boundary conditions; it can be possible to plot a curve F – Kf using these data. Not a lot of decisions are set out for rhombic plate, however, it is possible to plot a curve F – Kf using the finite element method.
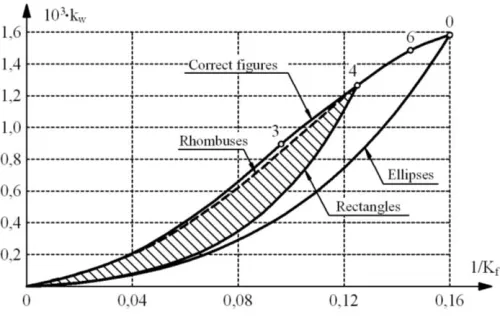
Fig. 1 shows the mentioned curves w0 – 1/Kf at evenly distributed action on a plate. In the
figure, along the abscissa axis value 1/Kf is plotted, while the ordinate axis - multiplied by 103 times represents the proportionality constant in bending form
, D qA k
w w
2
0 (1)
38
Fig. 1. Maximum deflection of plates in isoperimetric form
As shown in Fig. 1, points 3, 4, and 6 correspond to w0 values for plates in the form of a
regular shape – triangle, tetragon (square), hexagon; point 0 is in keeping with w0 values for
round plate. Ranges of values w0 that belong to parallelogram plates are shaded in the figure.
3. Results and discussion
In the present work it is suggested to use the ratio of inner r conformal radius to outer r – (Korobko, Chernyaev 2011) instead of the form factor of the region with convex outline. The value of parameters for area forming boundary curves was calculated, and corresponding to them values of kw proportionality constant were found using ANSYS software by the partition of area with grid 1/10 of side. For rectangles and rhombs, the exact analytic formulas for conform radius ratio value using gamma function are known. But these formulas are sufficiently cumbersome (Polya, Szego 1951). That is why in this article approximating polynomial functions are plotted with high accuracy based on the previously obtained solution set; these functions can be useful in creating computer programs.
For rhombs, the equation is known as (Polya, Szego 1951):
L G
G r
2 1 2
2 1
, L
G G
r
2 1 2 1 8
2 1
; (2)
where L is perimeter; G(x) is gamma function. The values of the inner (r) and outer (r) conformal radiuses to the different α were obtained (Table 1) using these formulas. According to Table 1 and using MS Excel, approximating function (3) was plotted:
4 3 2
a b c d e
r
r , (3)
where a = 7,0709·10-5; b = 0,02219; с = –0,0001678; d = 5,2896·10-7; e = –1,6694·10-9; [Alpha] – acute rhomb angle in degrees.
conformal mapping are the tops of the rectangle); (-1)!! = 1.
Using these formulas, the inner and outer conformal radius and its ratio (r r) to the different a and b was calculated and presented in Table 2. According to Table 2 and using MS Excel, approximating function (6) was plotted:
3 2
2
1
f d b e c a r
r , (6)
where a = 0,80307; b = – 0,76171; c = – 0,92186; d = 0,49197; e = 1,243; f = 0,49981; [lambda] = a/b – ratio of the greater rectangle side to the smaller;
For obtaining the inner and the outer conformal radius of parallelogram expansion of the mapping function f
z was used:
z z a c
z a
c
z a
...f
3
3 2
2 (7)
where ω, z are complex variables (points of the complex plane).
Function, which represents the one-to-one conformal transition, was obtained using the Christoffel – Schwartz formula:
z z n kk dz C
a z C z f k 0 1 2 1
1 , (8)
where С1 and С2 are arbitrary complex constants (С1 ≠ 0); ak are prototypes of the tops of the
a polygon Ai on the real axis; αk are radian measures of the inner angles of a polygon.
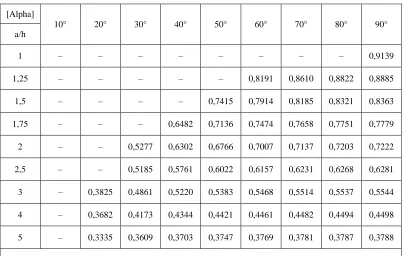
Further, the ratio of it was defined. The results of the different a/h and [Alpha] are shown in Table 3. According to Table 3 and using MS Excel approximating function was plotted (9):
ln iln j
ln ,h g ln f ln e d ln c b a r r 2 1 2 3 3 1 2 2 1 (9)
40
[Alpha] 10° 20° 30° 40° 45° 50° 60° 70° 80° 90°
r, a 0,1066 0,2036 0,2898 0,3643 0,3970 0,4264 0,4754 0,5108 0,5322 0,5394 r, a 0,5183 0,5348 0,5492 0,5616 0,5670 0,5718 0,5798 0,5855 0,5890 0,5902
r
r 0,2057 0,3807 0,5277 0,6487 0,7002 0,7457 0,8199 0,8724 0,9036 0,9139 Notes: 1. [Alpha] – acute rhomb angle; 2. – rhomb side.
Table 1. Values of conformal radius and its ratio for rhombs
a/b 1 1,2 1,4 1,6 1,8 2,0 2,5 3,0 5,0 → ∞
r, a 0,5394 0,4848 0,4332 0,3876 0,3488 0,3159 0,2543 0,2121 0,1273 2b/π
r, a 0,5902 0,5406 0,5045 0,4768 0,4551 0,4374 0,4049 0,3826 0,3361 a/4
r
r 0,9139 0,8968 0,8587 0,8129 0,7664 0,7222 0,6281 0,5544 0,3788 0
Note – a and b rectangle side (a ≥ b).
Table 2. Values of conformal radius and its ratio for rectangles
[Alpha]
10° 20° 30° 40° 50° 60° 70° 80° 90°
a/h
1 – – – – – – – – 0,9139
1,25 – – – – – 0,8191 0,8610 0,8822 0,8885
1,5 – – – – 0,7415 0,7914 0,8185 0,8321 0,8363
1,75 – – – 0,6482 0,7136 0,7474 0,7658 0,7751 0,7779
2 – – 0,5277 0,6302 0,6766 0,7007 0,7137 0,7203 0,7222
2,5 – – 0,5185 0,5761 0,6022 0,6157 0,6231 0,6268 0,6281
3 – 0,3825 0,4861 0,5220 0,5383 0,5468 0,5514 0,5537 0,5544
4 – 0,3682 0,4173 0,4344 0,4421 0,4461 0,4482 0,4494 0,4498
5 – 0,3335 0,3609 0,3703 0,3747 0,3769 0,3781 0,3787 0,3788
Notes: 1. a/h – ratio of greater parallelogram side to the smaller height (a/h ≥ 1); 2. [Alpha] – acute parallelogram angle ([Alpha] ≤ 90°); 3. Dash ‗–‘ means that this parallelogram already exists in the table.
2
44 2 1923 1 6771243 0 1 1923 1 5655 1 0044 0 r r , r r , r r , r r , , kw
; (12)
– for clamped rectangular plates:
2
42 5735 0 121 1 1 7075 0 0077 0 r r , r r , r r , , kw
. (13)
Here, the equations 10-13 were obtained from data which are presented in tables 5-8 using MS Excel. The values of the ratio r r where obtained using formula (3). The values of the parameter 1000 kw were obtained using ANSYS (FEM).
The resulting graphs turned out to be identical to the graphs illustrated in Fig. 1; its comparison enables to conclude that:
1. All the solutions to problems for plates in the form of rhomb, regular polygon, and arbitrary rectangle can be described by the same analytical dependence (formula (10) for simply supported plates, formula (12) for clamped plates).
2. Range of maximum deflection values for quadrangular plates in case of using conformal radius ratio is significantly narrower than it would be if the form factor was used. Therefore, by using ratio r r in the capacity of geometrical argument and applying the form factor interpolation technique in quadrangular plates computing (in particular – parallelogram and trapezoidal), the desired solution is determined with higher accuracy than by using the form factor.
For determination of maximum deflection of parallelogram plates by using the form factor interpolation technique, the ratio r r is as follows.
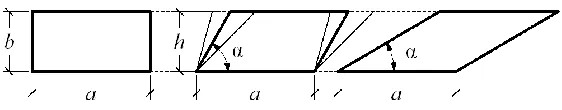
1. For a given parallelogram plate, which form depends on the ratio of larger side to the smaller height λ= a/h and acute α angle, «reference» plates and their geometric characteristics are defined by the affine shift along larger side: [Alpha] angle for rhombic plate is determined as
42
Fig. 2. Modeling parallelogram area
2. Ratios r r for the «reference» plates are calculated according to the formulas (3), (6), deflection values kw – according to the formulas (10-13).
3. Ratio r r for parallelogram plate is determined by the formula (9).
4. Maximum deflection kw of parallelogram plate may be defined using interpolation between the reference solutions.
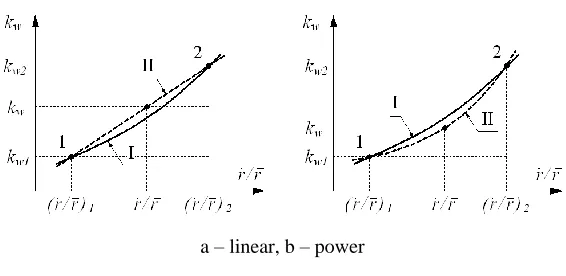
Two types of interpolation – power and linear – may be used during implementation of the last paragraph:
– at power interpolation:
nw w
r r
r r k
k
1 1
,
1 2
1 2
r r r r ln
k k ln
n w w
; (14)
– at linear interpolation:
2 1
1 2
1
1 w w
w
w k k
r r r r
r r r r k
k
, (15)
where r r – is conformal radius ratio for the given parallelogram plate;
r r 1,
r r 2 and kw1, kw2 – ratio of conformal radiuses and maximum deflection for «reference» plates. Index ―1‖of formulas (14) and (15) refers to rhombic plate, index ―2‖ – to rectangular one. Graphical interpretation of the analized types of interpolation on formula (14) and (15) is shown in Fig. 3, where curve I is for real curve, curve II is obtained by interpolating function.
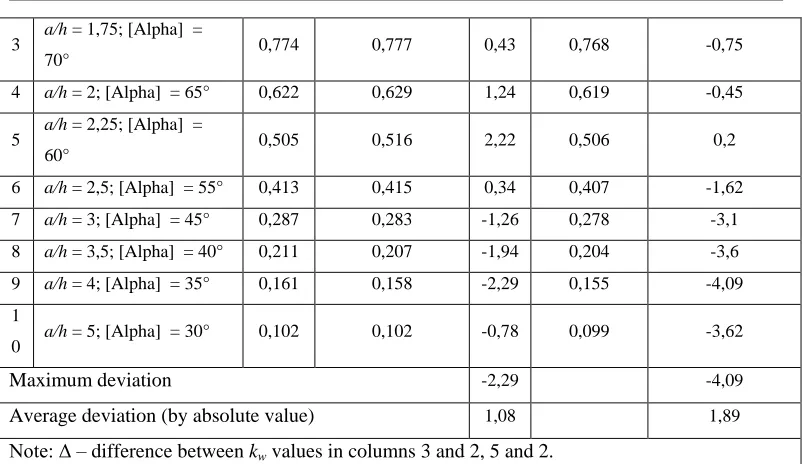
We did test calculations of multiplicity of parallelogram plates, ratio a/h varied between 1.25 and 5, [alpha] varied between 30° and 80°. Calculations were carried out using the finite element method, conformal radius ratio and ANSYS software package (Table 4).
N
Parallelogram plate characteristics
Deflection values 1000 kw in the form of (1)
(FEM) ANSY
S
r r
interpolation Δ, %
Кf interpolatio
n (FFIT)
Δ, %
1 2 3 4 5 6 7
Simply supported plates
1 a/h = 1,25; [Alpha] = 80° 3,808 3,795 -0,36 3,797 -0,29
2 a/h = 1,5; [Alpha] = 75° 3,364 3,358 -0,17 3,343 -0,63
3 a/h = 1,75; [Alpha] =
70° 2,893 2,901 0,28 2,866 -0,95
4 a/h = 2; [Alpha] = 65° 2,461 2,483 0,87 2,436 -1,03
5 a/h = 2,25; [Alpha] =
60° 2,094 2,116 1,06 2,067 -1,28
6 a/h = 2,5; [Alpha] = 55° 1,786 1,801 0,83 1,755 -1,75
7 a/h = 3; [Alpha] = 45° 1,314 1,309 -0,35 1,274 -3,02
8 a/h = 3,5; [Alpha] = 40° 1,006 0,988 -1,87 0,964 -4,18
9 a/h = 4; [Alpha] = 35° 0,787 0,766 -2,69 0,747 -5,07
1
0 a/h = 5; [Alpha] = 30° 0,514 0,507 -1,32 0,491 -4,46
Maximum deviation -2,69 -5,07
Average deviation (by absolute value) 0,91 2,28 Clamped plates
1 2 3 4 5 6 7
1 a/h = 1,25; [Alpha] = 80° 1,150 1,147 -0,24 1,147 -0,2
44
3 a/h = 1,75; [Alpha] =
70° 0,774 0,777 0,43 0,768 -0,75
4 a/h = 2; [Alpha] = 65° 0,622 0,629 1,24 0,619 -0,45
5 a/h = 2,25; [Alpha] =
60° 0,505 0,516 2,22 0,506 0,2
6 a/h = 2,5; [Alpha] = 55° 0,413 0,415 0,34 0,407 -1,62
7 a/h = 3; [Alpha] = 45° 0,287 0,283 -1,26 0,278 -3,1
8 a/h = 3,5; [Alpha] = 40° 0,211 0,207 -1,94 0,204 -3,6
9 a/h = 4; [Alpha] = 35° 0,161 0,158 -2,29 0,155 -4,09
1
0 a/h = 5; [Alpha] = 30° 0,102 0,102 -0,78 0,099 -3,62
Maximum deviation -2,29 -4,09
Average deviation (by absolute value) 1,08 1,89 Note: Δ – difference between kw values in columns 3 and 2, 5 and 2.
Table 4. w0 values association for parallelogram plates obtained by conformal radius ratio
interpolation, the form factor interpolation technique (FFIT) and the finite element method (FEM) in ANSYS software package.
4. Summary
1 Using the form factor interpolation technique and geometric argument r r instead of form factor Kf for maximum deflection of parallelogram plates allows for the double increase of the analytical solutions accuracy.
2 Results, obtained by power and linear interpolation of reference solutions, are not significantly different. However, for the higher simplicity and naturalness it is recommended to use power interpolation.
3 The main advantage of the presented method for determination of maximum plate deflection is the obtained results representation that allows to exactly determine the place of found solution for all sets (in discussing set) of parallelogram plates. Among the plethora of known approximate approaches for solving considered problems, only interpolation technique on the form factor Кf and conformal radiuses ratio r r gives such opportunity.
Резиме
У раду се описује попречно савијање еластичних просто ослоњених изотропних плоча и плоча са укљештеном ивицом при равномерно распоређеном оптерећењу. Предлаже се употреба технике интерполације фактора облика како би се одредила вредност максималне дефлексије плочe; и однос унутрашњег и спољашњег конформалног радијуса као геометријског аргумента јер се предлаже да се геометријски аргумент употреби уместо фактора облика. Оваква замена омогућава већу тачност.
Кључне речи: плоче у облику паралелограма, попречно савијање, максимална дефлексија, однос конформалног радијуса, техника интерполације фактора облика.
References
ANSYS 14.0. 2011. ANSYS, Inc., Southpointe, pp. 2498.
Harari I, Sokolov I, Krylov S (2011). Consistent loading for thin plates. Journal of Mechanics of Materials and Structures, 6(5): 765-792.
Korobko AV (1999). Geometrical Modeling of Region Form in the Two-Dimensional Problems of Elasticity Theory [in Russian]. ASV Publishing, Moscow.
Korobko VI (1994). State and developing isoperimetric technique in structural mechanics. In the Proceedings of the second international conference Current problems of fundamental sciences. Moscow. II, 60-71.
Korobko VI, Chernyaev AA (2011). Problem calculation of cross-section bend of plates with usage of conformal radiuses. Construction mechanics and calculation of constructions. 6: 16-22.
Marti P (2013). Theory of Structures: Fundamentals, Framed Structures, Plates and Shells. John Wiley & Sons, Inc., Ernst & Sohn GmbH & Co. KG., pp: 679.
Polya G, Szego G (1951). Isoperimetric Inequalities in Mathematical Physics, Princeton University Press, pp: 280.
Reddy JN (2006). An introduction to the finite element method. McGraw-Hill, pp: 424.
Sadd MH (2014). Elasticity: Theory, Applications, and Numerics. Academic Press, Elsevier, pp: 473.