FPGA Based Online Data Acquisition System (DAS) for
Optical Tomography
Rahman Amirulah
1, Siti Zarina Mohd Mujib*
2, Mohamad Hairol Jabbar
2,
Ruzairi Abdul Rahim
5,6, Mohd Hafiz Fazalul Rahiman
3, Nurashlid
3, Jaysuman
Pusppanathan
41Department of Mechatronics Engineering Technology, Institut Teknikal Jepun-Malaysia (JMTi), Taman Perindustrian Bukit Minyak, 14100 Simpang Ampat, Pulau Pinang, Malaysia.
2Embedded Computing System (EmbCoS) Research Group, Faculty of Electrical and Electronic Engineering, UTHM, 86400 Parit Raja, Batu Pahat, Johor, Malaysia.
3Tomography Imaging Research Group, School of Mechatronic Engineering, UniMaP, Pauh Putra Campus, 02600 Arau, Perlis, Malaysia
4Faculty of Biosciences and Medical Engineering, Universiti Teknologi Malaysia, 81310 Skudai Johor. Malaysia 5Instrumentation and Sensing Technology Focus Group, Faculty of Electrical & Electronic Engineering, Universiti Tun Hussein Onn Malaysia (UTHM), Johor.
6Process Tomography research Group (Protom-i), Faculty of Electrical Engineering, Universiti Teknologi Malaysia, 81310 UTM, skudai,
1.
Introduction
Data acquisition system for Optical Tomography (OT) has been developed previously. Muji et al, developed the data acquisition unit for OT by using multiple Microcontroller which controlled trough master/slave technique [1]. Due to the design was too complicated because of the number of microcontroller used, Shaib et al developed the data acquisition system based on single 16-bit microcontroller [2]. Shaib et al development is less complicated by using single microcontroller, but there are drawback from the long conversion total time of Analog to Digital Converter (ADC) in the microcontroller which need to comply with approximately 5 µs per conversion channel to get the
the data from sensor takes about 600 µs for a cycle without considering the transfer rate from microcontroller into computer.
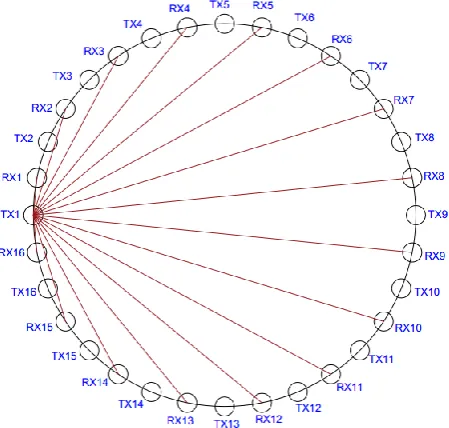
The OT concepts for fan beam projection as shown in Fig. 1 is a single transmission (TX1) of light projection that will be received by all 16 receivers in the sensor jig. Each light projection of the transmitter will be received by all 16 receivers simultaneously. Therefore, simultaneous registers to receive the sensor data is very important in the OT system design. In order to process all 16 data simultaneously, FPGA provides powerful computation through parallel implementation compared with the instruction driven digital signal processing (DSP) processor such as a microcontroller [4]. An FPGA chip offers a better advantage in this system such as Abstract: This paper presents the development of online data acquisition unit for Optical Tomography (OT) system based on Field Programmable Gates Array (FPGA). This design is to overcome the long conversion delay in Analog to Digital Converter (ADC) using a microcontroller that has been proposed previously for OT system although FPGA has been used in other type of tomography systems. The main purpose of this design is to log the sensor data into the computer through Universal Asynchronous Receiver/Transmitter (UART). The developed system consists of three main units which are: (1) measurement unit, (2) control unit and (3) image reconstruction unit. In the measurement unit, 16 pairs of transmitters and receivers are arranged around the sensor jig connected to the corresponding light projection circuit for transmitters and signal conditioning circuit for receivers. The light projection signals and the received data are controlled by the Altera DE2-115 FPGA which assigned as the main control unit. Then, the sensor data are transferred into computer for the image reconstruction process using Filtered Back Projection (FBP) algorithm. Based on Mean Structutal Similarity Index (MSSIM), the similarity index for the reconstructed images of the real object and the modelling object are 0.89 for object with diameter 21.5 mm and 0.88 for object with diameter 33.5 mm.
higher bandwidth and can design specific hardware optimized to implement a specific algorithm with parallel processing.
Fig. 1 Single Light Projection
Previously, the data acquisition of various types tomography system has been developed by using FPGA. Data acquisition system for Positron Emission Tomography (PET) were developed based on FPGA [5, 6]. A high speed data acquisition for Electrical Impedance Tomography (EIT) also been developed by using FPGA [7, 8]. The data acquisition system for Electrical Resistance Tomography (ERT) was developed in [9, 10]. In [11, 12] the 3D Ultrasound Computer Tomography (UCT) system was design with the data acquisition unit based on FPGA.
In this work, a data acquisition system is developed specifically for the OT based on FPGA which has not been proposed previously based on the literature study we have done. The development is coded by using Verilog HDL language. The sensor data are stored in temporary registers before logging into the computer through Universal Asynchronous Receiver/ Transmitter (UART). The image reconstruction is performed in the computer by using Filtered Back Projection (FBP) algorithm.
2.
System Design
The architecture of the system developed in this work is shown in Fig. 2. It can be divided into three main units
Fig. 2 System Architecture
2.1
Measurement Unit
There are 16 pairs of selected transmitter and receiver sensors arranged alternately around jig sensor as shown in Fig. 3.
Fig. 3 System Architecture
The selected sensor is infrared emitter SFH4556P as transmitter and silicon pin photodiode SFH203FA as receiver. Both sensors selected because they having same operating wavelength, wide coverage angle and fast switching time as shown in Table 1.
Sensor Wavelength Angle Switching Time
SFH4556P 850 nm ±65 12 ns SFH203PFA 750-1100 nm ±75 5 ns
The infrared emitter is connected into the transmitter or light projection circuit. The light projection circuit is to activate the infrared emitter for 10 µs to get responds in the receiver. Fig. 4 shows the light projection circuit for a single transmitter. As for the photodiode, it connects into the signal conditioning circuit which consists of an operation amplifier (TLE2141) and serial analog to digital converter (ADC - MCP3001) as shown in Fig. 5.
Jig Sensor Acrylic Pipe
Fig. 4 Light projection circuit
Fig. 5 Signal conditioning and ADC circuits
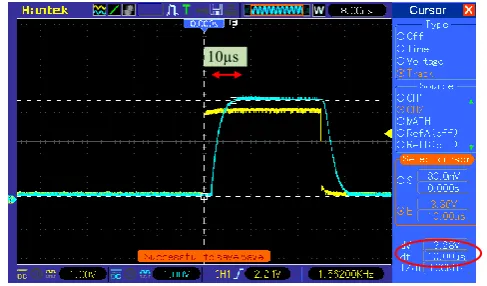
In order to get the correct response between transmitter and receiver, an experiment was performed by checking the signal by using an oscilloscope. Based on the signal response in Fig. 6, the yellow colour is the transmitter signal which is square wave signal to turn on and off the emitter diode while the blue colour signal is the receiver response based on the transmitted signal. The figure shows that the rising of receiver signal is settled in approximately 10 µs (100 kHz) and the maximum signal value is 3.28V.
Fig. 7 shows the Printed Circuit Board (PCB) for measurement unit in a single board which consists of 16 light projection circuits and 16 pairs of signal conditioning circuits and ADC. All sensor connections are wired into the PCB via pin header. One 40 ways straight box header used to connect the measurement unit with the FPGA board.
Fig. 6 Transmitter and Receiver Response
Fig. 7 Printed Circuit Board (PCB) for Transmitters and Receivers
2.2
Control Unit
The DE2-115 FPGA board is used as the control unit in this system. The FPGA in this design controls the light projection signal, the serial ADC, data storage and UART controller.
Fig. 8 shows the block diagram for 16 transmitter signal or light projection generation. The light projection signal generated in sequence which start from transmitter 1 (TX1) until transmitter 16 (TX16) and the process are repeated. Fig. 9 shows the simulated timing diagram of the light projection signals generated by the FPGA. The clock used for light projection is assign as clktx which is set as 200 kHz because 1 cycle of clock will activate the transmitter for 10 µs (100 kHz) by referring to Fig. 6. Therefore, the time to complete 1 cycle of 16 light projections is 160 µs.
Fig. 8 Transmitter Block
TO FPGA
10µs
ADC
Fig. 9 Light Projection Signals
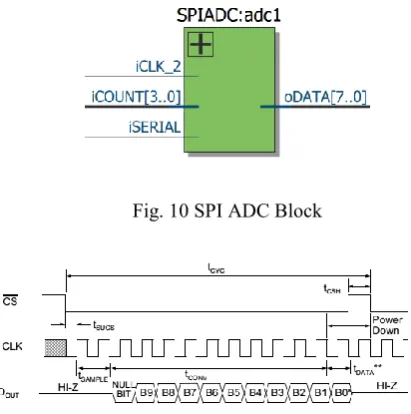
A successive approximation 10-bit A/D converter (ADC) from Microchip Technology Inc. MCP3001 is designed with onboard sample and hold circuitry. Communication with the device is done using a simple serial interface compatible with the SPI protocol. The device is capable of sample rates up to 200 ksps at a clock rate of 2.8 MHz. The block design and signals controlling the MCP3001 on the board are shown in Fig. 10 and Fig. 11 respectively. The clock rate is set to 2.8 MHz for all ADC. There are 16 ADC blocks working simultaneously to convert the analog data before storing the data in sensor data memory. Based on Fig. 10, the output from the block diagram is 8 bits (1 byte) digital value of sensor value which is for single ADC. Each transmission of light projection will be detected by all 16 receivers in the sensor jig, thus there are 256 bytes of data stored in the sensor data memory after all 16 cycles of transmition were activated.
Fig. 10 SPI ADC Block
Fig. 11 ADC Control Signal
data because the UART will be sending the data at 8 bits per transfer. The data transferred will be adding a start and stop bits which make the data transfer into the computer are 10 bits per transfer such shown in Fig. 13. The data transfer speed is fixed into 115200 baud rates, which is 8.68µs per bit including start and stop bits.
Fig. 12 UART Controller Block
Fig. 13 UART Byte Transmission Waveform
2.3
Image Reconstruction Unit
Image reconstruction process is perform using computer with MATLAB software. Once the cycle of sensor data completed logged into the computer, MATLAB immediately perform image reconstruction process by using Filtered Back Projection (FBP) algorithm (Equation 1) and display the tomogram image on the developed Graphic User Interface (GUI) as shown in Fig. 14. The reconstructed image resolution is 64 x 64 pixels.
(1)
where, is the voltage distribution using the FBP algorithm, is the sensor voltage of receiver (Rx) and
is the normalized sensitivity maps [13].
10 µs
Fig. 14 Image Reconstruction GUI
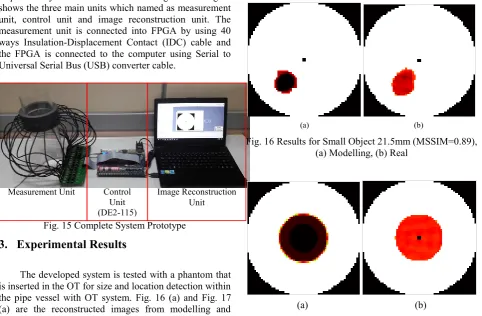
3.0 System Prototype
The complete system prototype of the data acquisition system for OT is shown in Fig. 15. The figure shows the three main units which named as measurement unit, control unit and image reconstruction unit. The measurement unit is connected into FPGA by using 40 ways Insulation-Displacement Contact (IDC) cable and the FPGA is connected to the computer using Serial to Universal Serial Bus (USB) converter cable.
Fig. 15 Complete System Prototype
3.
Experimental Results
The developed system is tested with a phantom that is inserted in the OT for size and location detection within the pipe vessel with OT system. Fig. 16 (a) and Fig. 17 (a) are the reconstructed images from modelling and reconstructed images of the real object placed through the pipe vessel is shown in Fig. 16 (b) and Fig. 17 (b) respectively. The quality of the reconstructed image based on similarity index is checked by using the Mean Structural Similarity Index (MSSIM) algorithm which express mathematically in Equation 2 which is carried out in MATLAB Software.
(2)
where:
X is the reference image Y is the distorted image
x and y are the image contents at the jth local window M is the number of local windows of the image l(x,y) is the luminance comparison function c(x,y) is the contrast comparison function s(x,y) is the structure comparison function
α, β, and γ are parameters used to adjust the relative importance of the three components
(a) (b)
Fig. 16 Results for Small Object 21.5mm (MSSIM=0.89), (a) Modelling, (b) Real
(a) (b)
Fig. 17 Results for Big Object 33.5mm (MSSIM=0.88), (a) Modelling, (b) Real
Based on the reconstructed image results in Fig. 16 and Fig. 17, the similarity index for small object (21.5 mm) is 0.89 while the big object (33.5 mm) is 0.88.
Measurement Unit Control Unit (DE2-115)
5.0 Conclusion
The data acquisition system for OT was successfully developed by using FPGA. The UART communication protocol used to connect the FPGA and the computer. The transfer rate of the data is 115200 baud rates. The complete system is able to process image reconstruction on MATLAB once the data completely transferred into the computer. The reconstruction method used is based on Filtered Back Projection (FBP) algorithm. The similarity index of the reconstructed images between modelling and real object are greater than 88% based on MSSIM technique.
Acknowledgement
This research was conducted with financial support by the Incentive Grant Scheme for Publication (IGSP), Universiti Tun Hussein Onn Malaysia (UTHM). Vot Number U407.
References
[1] Muji, S.Z.M. et al. 2013. The development of hardware for optical tomography system. 4th International Conference on Photonics, ICP 2013 - Conference Proceeding. (2013), 259–261.
[2] Shaib, M.F.A. et al. 2013. Comparison Between Two Different Types of Microcontroller in Developing Optical Tomography Controller Unit. Jurnal Teknologi. 5, (2013), 13–17.
[3] Microchip Technology 2011.
dsPIC30F6011A/6012A/6013A/6014A Data
Sheet.
[4] Amirulah, R. et al. 2010. Implementation of starfruit maturity classification algorithm on embedded system. ICSPS 2010 - Proceedings of the 2010 2nd International Conference on Signal Processing Systems (2010).
[5] Haselman, M. et al. 2009. FPGA-Based Front-End Electronics for Positron Emission Tomography. ACM/SIGDA International Symposium on Field Programmable Gate Arrays (2009), 93–102. [6] Estryk, D.S. et al. 2010. FPGA hierarchical
architecture for a positron emission tomography scanner. 6th Southern Programmable Logic Conference, SPL 2010 - Proceedings (2010), 113– 118.
[7] Khan, S. et al. 2013. FPGA Based High Speed Data Acquisition System for Electrical Impedance Tomography. J Phys Conf Ser. 434, 1 (2013), 12081.
[8] Yue, X. and McLeod, C. 2008. FPGA design and implementation for EIT data acquisition. Physiol Meas. 29, 10 (2008), 1233–1246.
[9] Zhang-O’Connor, Y. and Fessler, J.A. 2006. Fourier-based forward and back-projectors in
iterative fan-beam tomographic image
reconstruction. IEEE Transactions on Medical Imaging. 25, 5 (2006).
[10] DONG Feng, XU Cong, Z.Z. and R.S. et al. 2012. Design of parallel electrical resistance tomography system for measuring multiphase flow. Chinese Journal of Chemical Engineering. 20, 2 (2012), 368–379.
[11] Birk, M. et al. 2010. First Evaluation of FPGA Reconfiguration for 3D Ultrasound Computer Tomography. Proceedings of the 5th International Workshop on Reconfigurable Communication-centric Systems on Chip 2010 (2010), 109–114. [12] Birk, M. et al. 2011. FPGA-based embedded
signal processing for 3-D ultrasound computer tomography. IEEE Transactions on Nuclear Science (2011), 1647–1651.