ARTICLE
Prevalence of Developmental Coordination Disorder
Using the DSM-IV at 7 Years of Age: A UK
Population–Based Study
Raghu Lingam, MBChB, MRCPCH, MSca, Linda Hunt, PhDb, Jean Golding, PhD, DSc, FMedScia, Marian Jongmans, PhDc,d, Alan Emond, MB, MD, FRCPCHa
aDepartment of Community-Based Medicine, Centre for Child and Adolescent Health, andbClinical Sciences South Bristol, University of Bristol, Bristol, United Kingdom; cDepartment of Pediatric Psychology, Utrecht University Medical Centre, Utrecht, Netherlands;dDepartment of Special Education, Utrecht University, Utrecht,
Netherlands
The authors have indicated they have no financial relationships relevant to this article to disclose.
What’s Known on This Subject
There has been limited work looking at the prevalence DCD using the DSM IV criteria. High prevalence figures reflect the number of children that fail a standardised motor coordination test rather than those children who also have functional impairment.
What This Study Adds
Our study is the first to use strict DSM IV criteria to define the prevalence of DCD within a cohort of over 7000 children. We found a prevalence of 1.8% which used linkage of coordination testing to daily activities, education and health records.
ABSTRACT
OBJECTIVE.To calculate the prevalence of developmental coordination disorder at 7
years of age by usingDiagnostic and Statistical Manual of Mental Disorders, Fourth Edition criteria in a large UK birth cohort.
METHODS.Cases of developmental coordination disorder were defined by using data
from the Avon Longitudinal Study of Parents and Children, a UK birth cohort. The motor coordination of ⬎7000 children was assessed by using tests that measured manual dexterity, ball skills, and balance. The 5th percentile of the derived Avon Longitudinal Study of Parents and Children coordination impairment score was used to define severe motor coordination difficulties. Data from national handwriting tests and an activities-of-daily-living scale quantified the impact of poor coordination on daily life. Children with known neurologic conditions or an IQ of ⬍70 were ex-cluded.
RESULTS.Complete data were available from 6990 children aged 7 to 8 years who
attended the coordination session and completed the writing test or activities-of-daily-living scale. One hundred twenty-three children met criteria for developmental coordination disorder, resulting in a prevalence of 18 of 1000 children at a mean age of 7.5 years (SD: 2.9 months). An additional 223 children were considered as having “probable developmental coordination disorder” by using broader cut-offs for coor-dination testing and activities of daily living. There was an increased risk of devel-opmental coordination disorder in families from lower socioeconomic backgrounds, in children with a birth weight of ⬍2500 g, and those born before 37 weeks’ gestation.
CONCLUSIONS.This is the first study to use strict criteria to define the prevalence of
developmental coordination disorder in a representative cohort of UK children. A prevalence of 1.8% is lower than studies that have not taken into account the impact of poor motor coordination on daily living but indicates that poor coordination is an important, and often hidden, cause of disability in childhood. Pediatrics 2009;123: e693–e700
D
EVELOPMENTAL COORDINATION DISORDER(DCD) is defined, using theDiagnostic and Statistical Manual of Mental Disorders, Fourth Edition(DSM-IV), as a condition marked by a significant impairment in the development of motor coordination, which interferes with academic achievement and/or activities of daily living (ADL). These difficulties are not due to a general medical condition (eg, cerebral palsy) and are in excess of any learning difficulties if present.1,2The calculated prevalence of DCD ranges from 1.4% to 19%, depending on case definition.3–5 However, high prevalence figures reflect the number of children who fail a standardized test of motor coordination (usually defined
www.pediatrics.org/cgi/doi/10.1542/ peds.2008-1770
doi:10.1542/peds.2008-1770
This publication is the work of the authors, and Dr Lingam will serve as guarantor for the contents of this article.
Key Words
motor development, developmental coordination disorder, prevalence, ALSPAC, developmental disabilities
Abbreviations
DCD— developmental coordination disorder
DSM-IV—Diagnostic and Statistical Manual of Mental Disorders, Fourth Edition ADL—activities of daily living ALSPAC—Avon Longitudinal Study of Parents and Children
MABC—Movement Assessment Battery for Children
CI— confidence interval SEG—socioeconomic group
Accepted for publication Dec 16, 2008
Address correspondence to Raghu Lingam, MBChB, MRCPCH, MSc, University of Bristol, Centre for Child and Adolescent Health, Department of Community-Based Medicine, Bristol B566JS, United Kingdom. E-mail: [email protected]
as the 15th percentile of the population), rather than the number of children with severe coordination difficulties who have functional impairment in their ADL.
The aim of this study was to calculate the prevalence of DCD in children, at 7 years of age, in a large UK birth cohort using strict inclusion and exclusion criteria de-rived from the DSM-IV definition.
METHODS
Study Sample
The prevalence sample was drawn from the Avon Lon-gitudinal Study of Parents and Children (ALSPAC), an ongoing population-based cohort study designed to in-vestigate the interaction of environment and genotype on the health and development of children.6The cohort recruited 14 541 pregnant women in the geographically defined area of Avon, Southwest England, with an ex-pected date of delivery between April 1, 1991, and De-cember 31, 1992, resulting in 14 062 live births.6 The total sample of live births was increased to 14 610 chil-dren by recruiting eligible chilchil-dren, at 7 years of age, who missed enrollment in the original cohort.
Mothers of infants in the ALSPAC were comparable with the rest of the United Kingdom at the 1991 census.6 Data have been prospectively collected on a variety of developmental traits using parental self-completion questionnaires, hands-on assessments, and linked edu-cation and health records. Antenatal and postnatal de-mographic data have also been collected.
Ethical approval for the ALSPAC was obtained from the research ethics committees of United Bristol, South-mead, and Frenchay Health Care Trusts, and the study was monitored by the ALSPAC Ethics and Law Advisory Committee.
At the age of 7.5 years, ALSPAC children were invited to attend an assessment clinic, called the Focus@7. This assessment included a motor coordination testing ses-sion designed for children aged 7 and 8 years. In total, 7256 7- and 8-year-old children started the motor coor-dination session (3684 boys, 3572 girls); the mean age was 7.5 years (SD: 2.8 months) (Fig 1).
The 7256 7- and 8-year-old children who started the coordination session were compared with those who did not attend or were missing from the cohort of live births (n ⫽ 7211). Compared with the birth cohort, the Fo-cus@7 population underrepresented ethnic minorities and families from lower socioeconomic backgrounds (Appendix 1).
Case Definition: Inclusion and Exclusion Criteria
DCD cases were defined by using inclusion (criteria A and B) and exclusion criteria (criteria C and D) derived from the DSM-IV and adapted for research using the 2006 Leeds Consensus Statement, which provides inter-nationally agreed cutoffs to define DCD for clinical and research purposes.1,2,7 The ALSPAC has collected data that fulfill each of these criteria.
Criterion A: Marked Impairment in the Development of Motor Coordination1
The 5th percentile of an individually administered motor coordination test is the standard measure of severe mo-tor coordination difficulties. Those children scoring be-tween the 5th and 15th percentile are considered at risk of probable difficulties.7–9
The ALSPAC coordination test consisted of 3 subtests derived from the Movement Assessment Battery for Children (MABC).9The subtests were chosen to test the 3 realms of coordination: balance (heel-to-toe walking), manual dexterity (placing pegs task), and ball skills (throwing bean bag into box). Principal component analysis with varimax rotation of the original standard-ization data set of the MABC (n⫽264, within age band 2), obtained from Professor Henderson, DPE, BA, MA, PhD, AcSS, identified 3 groups of variables:
1. heel-to-toe walking, stork balance, and flower trail; 7399 children started the
coordination session
7256 children aged 7 and 8 y started the coordination session
198 children entered the session, but 1 or more test score was not recorded: ‘‘test
refusers’’
7058 children completed all 3 coordination tests
143 children >9.0
Final denominator: 6990 children attended the Focus@ 7 and completed the ADL questionnaire or handwriting test
255 children had no data from
ADL or handwriting
tests
11 children had no data from
ADL or handwriting
tests or <7.0 y
FIGURE 1
2. placing pegs and threading lace; and
3. throwing bean bag into a box and 1-hand catch.
Heel-to-toe walking, placing pegs, and throwing bean bag into a box best represented each group in turn (Appendix 2) (S. E. Henderson, DPE, BA, MA, PhD, AcSS, A. Barnett, PhD, MABC standardization data set, personal communication, 2008).
Trained ALSPAC examiners demonstrated each task; the children were then given a practice test to ensure understanding and to correct procedural errors. Test ad-ministration differed from the MABC manual in that only children who failed to understand the test or did something that resulted in a poor score (eg, dropped a peg and stopped to look for it) were allowed to repeat a trial.
In the heel- to-toe walking test, the child was asked to walk, heel to toe, along a straight line. The tester re-corded the largest number of consecutive correct steps taken to a maximum of 15. In the placing pegs task, the time taken for the child to insert 12 pegs into a peg board 1 at a time, using first their preferred then their nonpre-ferred hand, was recorded. The testing of ball skills in-volved the child attempting to throw 10 single bean bags underarm into a box at a distance of 6 feet. The number of bean bags thrown into the box was recorded.
Age adjusted ALSPAC coordination scores for each subtest were derived in 6-month bands by comparing the scores of each child to raw scores of the cohort itself (⬎7000 7- and 8-year-old children).
Criterion B: The Disturbance in Criterion A Significantly Interferes With Academic Achievement or ADL1
Academic Achievement
Because of the complex relationship between mo-tor coordination and academic achievement, the Leeds consensus statement recommends that handwriting be measured when considering the functional academic consequences for the diagnosis of DCD.7 Under UK law, state-funded schools are obliged to subscribe to a national curriculum that includes regular academic test-ing at “key stages.”10The ALSPAC has linked educational authority data from literacy and numeracy testing at the end of key stage 1 (aged 7 years). As part of the literacy testing, there is a writing task, which is scored 1 to 4, with 4 being the best. A nationally set level of 2 is expected at this age. Children not achieving level 2 in their writing task were considered to have significant difficulties with handwriting.
Activities of Daily Living
A 23-item measure of ADL was derived from the ALSPAC parent-completed questionnaire administered when the child was 6 years and 9 months of age. This scale included questions on key areas in which children with DCD struggle: self-care skills, play skills, and gross and fine motor skills including drawing and copying.11 The questions, derived from the Schedule of Growing Skills II and the Denver Developmental Screening Test II, were developmentally age appropriate and
repre-sented skills the child would be expected to have achieved by the age of 81 months.12,13The ADL scale is presented in Appendix 3.
Parents were asked to answer each question: “yes can do” (2 marks); “can do but not well” (1 mark); “can not do as yet” (0 marks); or “has not had the opportunity to do.” A score was produced by adding the individual item scores (0 to 2) and dividing by the total number of items (23) minus the number of items the child had not had a chance to attempt. Age adjustment was made by strati-fying by the child’s age when questionnaires were com-pleted. Previous screening tests for DCD have used the lowest 15th percentile to define impairment.14,15 We chose a more stringent cutoff of the 10th percentile to define significant difficulties in ADL, because the ADL questions described age-appropriate tasks that children were expected to have achieved.
Criterion C: The Disturbance Is Not a Result of a General Medical Condition (eg, Cerebral Palsy or Muscular Dystrophy) and Does Not Meet Criteria for a Pervasive Developmental Disorder1
Neurologic and developmental conditions in the ALSPAC were identified from hospital and community health ser-vice notes and educational records from the Avon area between 1993 and 2003. Diagnoses were confirmed by clinical researchers using theInternational Statistical Classifi-cation of Diseases, 10th Revision classification system and anonymously linked to ALSPAC identifiers.16,17 Children with known visual, developmental, or neurologic condi-tions were thus excluded from prevalence figures. The exclusion of autism spectrum disorders (pervasive devel-opmental disorder) is controversial, because there is often an overlap between these conditions and DCD.18In accor-dance with the Leeds consensus statement, children with autism have not been excluded but are highlighted.7
Criterion D: If Mental Retardation Is Present, the Motor Difficulties Are in Excess of Those Usually Associated With It1
IQ was measured when children were 8.5 years of age by using a validated, shortened form of the Wechsler Intel-ligence Scale for Children–III.19–21Children with an IQ of
⬍70, as advised in the Leeds consensus, were excluded from the case definition of DCD.7
Descriptive Statistics
Demographic factors of the “DCD or probable DCD” and “non-DCD” groups were compared by using either un-paired Student’sttests or2tests, as appropriate.
RESULTS
Inclusion Criteria A: Poor Motor Coordination
each individual subtest given an item score of 5, the next 3% given an item score of 4, etc (Table 1). These age-adjusted scores for each of the 3 subtests were summed giving an ALSPAC coordination impairment score out of 15.
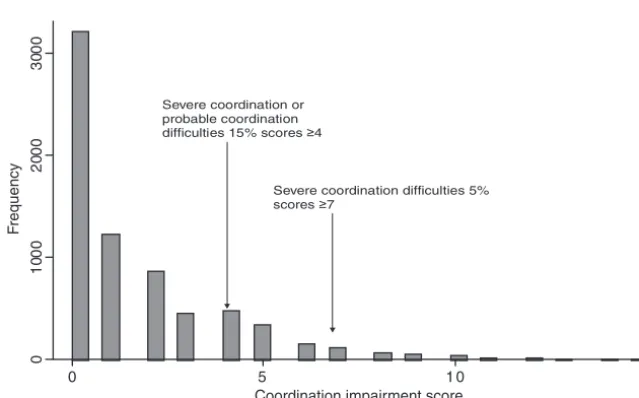
Empirical percentiles of the ALSPAC coordination im-pairment scores allowed us to define the 5% of children with the highest impairment scores (severe coordination difficulties) as those scoringⱖ7 (n⫽324). Nine hundred seventy-five children had a coordination impairment score of between 4 and 6 (scores between the 5th and 15th percentile); these children were defined as having “probable coordination difficulties.” As scores are cate-gorical, these cutoffs equated to 4.6% and 18.4% of the population, respectively (Fig 2).
Inclusion Criteria B: Handwriting and ADL
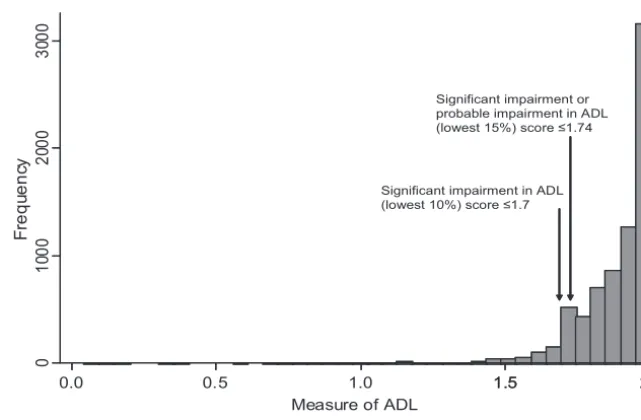
Data were available from the key stage 1 writing task for 11 710 children. By the end of key stage 1, 1924 (16.4%) children had not achieved a writing level of 2. Data from 7422 ADL scales were available (Fig 3).
Seven hundred twenty children (the bottom 10%) were defined as having significant impairment in their ADL. This equates to not being able to do 7 items well. Children scoring between the 10th and 15th percentile were considered to have probable impairment in ADL. There was no significant difference in mean ADL test scores in children who did compared with those who did not attend the Focus@7 motor coordination session
(mean score difference: 0.001 [95% confidence interval (CI):⫺0.006 to 0.009]);P⫽.75; Appendix 1).
Exclusion Criteria C and D: Known Neurologic Condition and IQ
In total, 110 children had visual, developmental, or neu-rologic diagnoses. Of the 7354 children who took the IQ test, 136 had an IQ of⬍70.
Prevalence Calculation
One hundred forty-nine children met DSM-IV inclusion criteria for DCD, that is, had severe motor coordination difficulties (the lowest 5th percentile of the ALSPAC coordination impairment score), that interfered with ei-ther ADL (lowest 10% ADL scale) or academic achieve-ment (not meeting national standards for handwriting). We excluded those 26 children with a known neurologic diagnosis or an IQ of⬍70, leaving 123 children who met full DSM-IV criteria for DCD. Our denominator com-prised the 6990 children, aged 7 and 8 years, who started the Focus@7 coordination session and had results for the ADL questionnaire or writing test (Fig 1). The preva-lence of DCD was thus 1.8%, 18 per 1000 children at a mean age of 7.5 years (SD: 2.9 months). The gender ratio was 1.9:1 males to females.
Exclusion of those children with an IQ of ⬍70 or a known neurologic diagnosis decreases the denominator to 6867 but does not alter the prevalence of DCD.
Broader inclusion criteria can be used to compare ALSPAC to other studies and consider those children with “probable DCD.”4,9An additional 223 children were considered to have probable DCD: coordination impair-ment score between the 5th and 15th percentile, scores between the 10th and 15th percentile on the ADL scale, or failed the writing test. As such, 346 children, 4.9% of 7- to 8-year-olds, could be considered to have DCD or probable DCD (gender ratio 1.7:1 males to females). Ten of the 123 children with DCD and 9 of the 222 children with probable DCD had an autism spectrum disorder diagnosis.
One hundred ninety-eight children attended the
co-0
10
00
20
00
30
00
F
requency
0 5 1 0 1 5
Coordination impairment score
N= 7 05 8
Severe coordination or probable coordination
difficulties 15% scores ≥4
Severe coordination difficulties 5%
scores ≥7
FIGURE 2
Frequency distribution of ALSPAC Coordination Impair-ment Scores.
TABLE 1 Derivation of ALSPAC Coordination Item Scores 0 to 5 ALSPAC Coordination
Item Scores
Percentile of Raw Score Within the Cohort
0 75th
1 75th–85th
2 85th–90th
3 90th–95th
4 95th–98th
ordination session but refused testing. One hundred eighty-seven of these children were included in the de-nominator as they started the session and had data from their writing tests or ADL (Fig 1). Potentially some of these “test refusers” had poor coordination. Fifty-seven of these 187 children scored below the 15th percentile on the ADL scale or failed their writing test. However, 15 of these 57 met our exclusion criteria C and D. If we
consider the remaining 42 children as having probable DCD, the prevalence of DCD or probable DCD changes from 4.9% to 5.5%.
There was an increased risk of DCD or probable DCD with rented housing tenure and lower maternal socio-economic group (SEG). There was also an association with lower birth weight (⬍2500 g) and younger gesta-tion (⬍37 weeks) (Table 2).
0.0 0.5 1.0 1.5
N=7422
Significant impairment in ADL (lowest 10%) score ≤1.7
Significant impairment or probable impairment in ADL (lowest 15%) score ≤1.74
0
10
00
20
00
30
00
F
requ
enc
y
1.5 2.0 Measure of ADL
FIGURE 3
Frequency Distribution of the Measure of Activities of Daily Living (ADL).
TABLE 2 DCD or Probable DCD Compared With Maternal Variables and Gestation Attended Focus@7
Not DCD and Not Probable DCD (Nⴝ7058 max)
DCD or Probable DCD (Nⴝ341
max)
Comparison, Mean or RR (95% CI)
P
Maternal age at delivery
Mean (SD), y 29.05 (4.59) 29.06 (4.79) .97a
Total,n 6652 329 Mean: 0.01 (⫺0.52 to 0.50)
Gestation
ⱖ37 wk,n(%) 6312 (95.43) 302 (4.57) .01b
ⱕ36 wk,n(%) 340 (92.64) 27 (7.36)
Total,n 6652 329 RR: 1.61 (1.10 to 2.35)
Birth weight
⬎2500 g,n(%) 6261 (95.51) 294 (4.49) ⬍.001b
ⱕ2500 g,n(%) 320 (91.43) 30 (8.57)
Total,n 6581 324 RR: 1.91 (1.33 to 2.74)
Ethnicity
White,n(%) 6669 (95.37) 324 (4.63) .09b
Nonwhite,n(%) 309 (93.35) 22 (6.65)
Total,n 6978 346 RR: 1.43 (0.94 to 2.18)
Derived maternal SEG
I–III,n(%) 5003 (95.90) 214 (4.10) .006b
IV⫹V,n(%) 522 (93.38) 37 (6.62)
Total,n 5525 251 RR: 1.61 (1.15 to 2.26)
Housing tenure at 8 wk gestation
Owned,n(%) 5322 (95.72) 238 (4.28) ⬍.001b
Rented,n(%) 964 (92.87) 74 (7.13)
Total,n 6286 312 RR: 1.67 (1.29 to 2.14)
DISCUSSION
Our study is the first to use strict DSM-IV criteria to define a population of children with DCD within a co-hort of⬎7000 children. We have used the best available current guidelines and a multistage approach to identify children with DCD. The strength of the study is the prospectively collected data and the linkage of coordina-tion testing to ADL, educacoordina-tion, and health records. The main limitation, as with all longitudinal studies, is the missing data because of differential dropout.
Our prevalence level of 1.8%, at 7.5 years, is compa-rable to the DCD prevalence of 1.4% to 4% described by Wright and Sugden,3and 2.7% described by van Dellen et al.22,23Both authors used a 2-step procedure where a screening test was followed by a motor coordination test. However, in both studies, motor coordination testing was only performed on children who failed the screen-ing test. IQ was measured by van Dellen et al but not by Wright and Sugden. It is unclear if children with an IQ of
⬍70 were excluded from prevalence figures.3,23
Previous large studies have in general ignored the disability caused by motor coordination delay and thus defined clumsiness rather than DCD. Using nonstand-ardized neurologic testing in the Collaborative Perinatal Project, 8.1% of the 30 000 US children studied were defined as having “poor coordination”24; 13.5% of Swedish 7-year-old children were defined as having ei-ther moderate or severe DCD, again dependent solely on motor coordination ability.4All children defined as hav-ing DCD were said to have functional impairment, but this was not quantified.
There is an established link between children born prematurely and DCD.25,26Our finding of an increased risk of DCD with lower gestation and birth weight sup-ports this link and adds credence to our case allocation methods.
Because of time constraints with the large number of children assessed, the ALSPAC coordination test con-sisted of subtests rather than the entire MABC. How-ever, each of the selected subtests has been shown to have concurrent validity with other similar coordination tests (P⬍.001) and represents the 3 domains of coor-dination using principal component analysis.10,27 With the large sample size available, we were able to use the raw scores of these tests within the cohort, in 6-month age bands, to classify children as having severe or prob-able coordination difficulties as below the 5th and be-tween the 5th and 15th percentile of the cohort, respec-tively. The ability of the ALSPAC coordination test to predict children with severe coordination impairment and thus fulfill criteria A of the DSM-IV is supported by the significant association of the ALSPAC coordination impairment score with the ADL score (P⬍.001). How-ever, because the full MABC was not performed on the ALSPAC cohort, direct comparison between the ALSPAC coordination test and the full MABC, a test that has a well-established predictive validity, cannot be made.
Interference with ADL is not quantified in the DSM-IV criteria for DCD.2It is, however, fundamental to diagnosis, because it implies functional difficulties and ensures case allocation does not rely solely on cutoffs
from motor testing. In their review of research criteria used in DCD, Geuze et al8found that only 50% of DCD studies mentioned interference with ADL, mainly as re-ferral to a clinical service, and 9% mentioned interfer-ence with school life. We have created a novel ADL scale incorporating age-appropriate functional motor activi-ties and defined severe impairment by using a stringent cutoff to account for potential parental reporting bias and the age-appropriate nature of the tasks.
We found an increased risk of DCD in the lowest SEGs. The Focus@7 coordination session underrepre-sented children who failed their key stage 1 writing test. The fact that these children are missing is likely to reflect their SEG and maternal education, known risk factors for loss to follow-up within ALSPAC. Therefore, our study may represent a minimum prevalence because of differential cohort drop out. With decreased recognition of disability and access to health care in the poorest families, DCD may add to the cumulative effect of social disadvantage on child health and represent a hidden burden of disability in the community.28
CONCLUSIONS
We found that 18 of 1000 7-year-olds have DCD accord-ing to strict DSM-IV criteria and that 49 of 1000 7-year-olds have DCD or probable DCD. To develop effective prevention and targeted intervention strategies, future longitudinal research should aim to identify which of these children with motor coordination difficulties are at risk of long-term psychological morbidity and educa-tional failure.
ACKNOWLEDGMENTS
Dr Lingam was funded by a personal award scheme, researcher development award from the United King-dom National Institute for Health Research.
We are extremely grateful to all the families who took part in this study, the midwives for their help in recruit-ing them, and the whole ALSPAC team, which included interviewers, computer and laboratory technicians, cler-ical workers, research scientists, volunteers, managers, receptionists, and nurses. The United Kingdom Medical Research Council, the Wellcome Trust, and the Univer-sity of Bristol provided core support for the ALSPAC. We are also extremely grateful to professor Sheila Hender-son and Dr Anna Barnett for their advice and access to the original MABC standardization cohort.
REFERENCES
1. American Psychiatric Association.Diagnostic and Statistical Man-ual of Mental Disorders, Fourth Edition. Washington, DC: Amer-ican Psychiatric Association; 1994
2. American Psychiatric Association.Diagnostic and Statistical Man-ual of Mental Disorders, Fourth Edition Text Revision. Washington, DC: American Psychiatric Association; 2000
3. Wright HC, Sugden DA. A two-step procedure for the identi-fication of children with developmental co-ordination disorder in Singapore.Dev Med Child Neurol.1996;38(12):1099 –1105 4. Kadesjo¨ B, Gillberg C. Developmental coordination disorder in
5. Tsiotra GD, Flouris AD, Koutedakis Y, et al. A comparison of developmental coordination disorder prevalence rates in Ca-nadian and Greek children. J Adolesc Health. 2006;39(1): 125–127
6. Golding J, Pembrey M, Jones R. ALSPAC—the Avon Longitu-dinal Study of Parents and Children. I. Study methodology. Paediatr Perinat Epidemiol.2001;15(1):74 – 87
7. Sugden DA, Chambers M, Utley A. Leeds consensus statement 2006. Available at: www.dcd-uk.org/consensus.html. Accessed January 4, 2008
8. Gueze RH, Jongmans MJ, Schoemaker MM, et al. Clinical and research diagnostic criteria for developmental coordination disorder: a review and discussion.Hum Mov Sci.2001;20(1–2): 7– 47
9. Henderson SE, Sugden DA.Movement Assessment Battery for Chil-dren Manual. Sidcup, United Kingdom: Psychological Corporation; 1992
10. HM Government: Department for Children, Schools, and Fam-ilies. Higher Standards, Better Schools For All. London, United Kingdom: HM Government; 2005
11. Geuze RH. Motor impairment in DCD and activities of daily living. In: Sugden DA, Chambers M, eds.Children With Devel-opmental Coordination Disorder. London, United Kingdom: Whurr; 2005:19 – 46
12. Bellman M, Lingam S, Aukett A.Schedule of Growing Skills. 2nd ed. London, United Kingdom: NFER-Nelson Publishing Co; 1997
13. Frankenburg WK, Dodds J, Archer P. The Denver II: a major revision and restandardization of the Denver Developmental Screening Test.Pediatrics.1992;89(1):91–97
14. Schoemaker MM, Flapper B, Verheij NP, et al. Evaluation of the Developmental Coordination Disorder Questionnaire as a screening instrument. Dev Med Child Neurol. 2006;48(8): 668 – 673
15. Schoemaker MM, Smits-Engelsman BC, Jongmans MJ. Psy-chometric properties of the Movement Assessment Battery for Children: checklist as a screening instrument for children with a developmental co-ordination disorder. Br J Educ Psychol. 2003;73(pt 3):425– 441
16. World Health Organization. International Classification of Dis-eases, 10th Revision. Geneva, Switzerland: World Health Organization; 1992
17. Williams E, Thomas K, Sidebotham H, et al. Prevalence and characteristics of autistic spectrum disorders in the ALSPAC cohort.Dev Med Child Neurol.2008;50(9):672– 677
18. Green D, Baird G, Barnett AL, et al. The severity and nature of motor impairment in Asperger’s syndrome: a comparison with specific developmental disorder of motor function.J Child Psy-chol Psychiatry.2002;43(5):655– 668
19. Weschsler D, Golombok S, Rust J.Wechsler Intelligence Scale for Children. United Kingdom Manual. 3rd ed. Sidcup, United Kingdom: Psychological Corporation; 1992
20. Connery S, Katz D, Kaufman AS, et al. Correlations between two short cognitive tests and a WISC-III short form using a sample of adolescent inpatients.Psychol Rep.1996;78(3 pt 2): 1373–1378
21. Emond AM, Blair PS, Emmett PM, et al. Weight faltering in infancy and IQ levels at 8 years in the Avon Longitudinal Study of Parents and Children.Pediatrics.2007;120(4):1051–1058 22. van Dellen T, Geuze RH. Motor response processing in clumsy
children.J Child Psychol Psychiatry.1988;29(4):489 –500 23. van Dellen T, Vaessen W, Schoemaker M. Clumsiness:
defini-tion and selecdefini-tion of subjects. In:Developmental Biopsychology: Experimental and Observational Studies in Children at Risk.Ann Arbor, Michigan: University of Michigan Press; 1990:135–152 24. Nichols PL, Chen TC.Minimal Brain Dysfunction: A Prospective Study. Hillsdale, NJ: Lawrence Erlbaum Associates Inc; 1981 25. Holsti L, Grunau RV, Whitfield MF. Developmental
coordina-tion disorder in extremely low birth weight children at nine years.J Dev Behav Pediatr.2002;23(1):9 –15
26. Jongmans M, Mercuri E, de Vries L, et al. Minor neurologic signs and perceptual-motor difficulties in prematurely born children.Arch Dis Child Fetal Neonatal Ed.1997;76(1):F9 –F14 27. Van Waelvelde H, De Weerdt W, De Cock P, et al. Aspects of
the validity of the Movement Assessment Battery for Children. Hum Mov Sci.2004;23(1):49 – 60
APPENDIX 1 Comparison of Attendees of Focus@7 Coordination Session With Nonattendees
Nonattendees Live Births (Nⴝ7198 max)
Attendees Aged 7 and 8 Years (Nⴝ7256 max)
Comparison, P
Maternal age at delivery
Mean, y (SD) 26.95 (5.08) 29.05 (4.6) ⬍.001a
Total,n 7068 6976
Gestation
Mean wk (SD) 39.27 (2.17) 39.45 (1.88) ⬍.001a
Total,n 7068 6976
Gender
Boys,n(%) 3764 (52.31) 3684 (50.77)
Girls,n(%) 3432 (47.69) 3572 (49.23) .065b
Total,n 7196 7256
Ethnicity
White,n(%) 6391 (92.99) 6873 (95.47)
Nonwhite,n(%) 482 (7.01) 326 (4.53) ⬍.001b
Total,n 6873 7199
Home ownership status at 8 wk gestation Owned/mortgaged,
n(%)
4042 (66.95) 5566 (84.27) ⬍.001b
Rented,n(%) 1995 (33.05) 1037 (15.73)
Total,n 6037 6598
Maternal social class,
n(%)
I 194 (4.49) 397 (6.88) ⬍.001b
II 1216 (28.17) 1959 (33.94)
III nonmanual 1853 (42.93) 2462 (42.65)
III manual 394 (9.13) 395 (6.84)
IV⫹V 659 (15.27) 559 (9.68)
Total,n 4316 5772
Maternal highest educational qualification,
n(%) Vocational
(vocational or certificate of education)
2263 (39.39) 1475 (21.99) ⬍.001b
School (O-level A-level)
2938 (51.14) 4174 (62.23)
Degree level 544 (9.47) 1058 (15.77)
Total,n 5745 6707
ADL score, mean (SD) 1.88 (0.16) 1.88 (0.14) .74a
Total,n 2234 5184
Key stage 1 writing test,
n(%)
⬍2 4173 (77.21) 5506 (89.15) ⬍.001b
2–4 1232 (22.79) 670 (10.85)
Total,n 5405 6176
aStudent’sttest. b2test.
APPENDIX 2 Principal Components Analysis of Original Standardization Sample of MABC After Varimax Rotation (Rotated Component Matrix)
Component
1 2 3
Flower trail—best trial ⫺.754 .131 ⫺.260
Place pegs in board—preferred hand .028 .708 ⫺.018
Thread lace—best trial ⫺.128 .679 ⫺.143
One-hand bounce and catch—preferred hand .268 ⫺.215 .603
Throw bean bag into box .060 .088 .811
Stork balance—preferred leg .533 ⫺.469 ⫺.164
Heel-to-toe walking—best trial .787 .023 .124
Jump in squares—best trial .304 .258 ⫺.311
The rotation converged in 5 iterations. Extraction method: principal component analysis; rotation method: varimax with Kaiser normalization.
APPENDIX 3 Questions Comprising the ADL Scale 1. Can he or she walk upstairs 1 foot per step?
2. Can he or she walk downstairs 1 foot per step? 3. Can he or she ride a tricycle or a bicycle with stabilizers? 4. Can he or she ride a bicycle?
5. Can he or she draw a circle (more or less)? 6. Can he or she draw or copy a cross? 7. Can he or she draw or copy a square? 8. Can he or she write his or her name? 9. Can he or she throw a small ball underarm? 10. Can he or she throw a small ball over arm?
11. Can he or she throw a ball against a wall and catch it? 12. Can he or she drink from a cup or mug?
13. Can he or she eat skillfully with a spoon?
14. Does he or she eat with a fork or spoon in each hand? 15. Does he or she cut food with a knife?
16. Can he or she sit at a table and cope with a whole meal without help? 17. Can he or she wash and dry own hands?
18. Can he or she brush own teeth? 19. Can he or she get dressed without help? 20. Can he or she get undressed without help? 21. Can he or she do up buttons?
22. Can he or she tie a bow?
DOI: 10.1542/peds.2008-1770
2009;123;e693
Pediatrics
Raghu Lingam, Linda Hunt, Jean Golding, Marian Jongmans and Alan Emond
Based Study
−
Years of Age: A UK Population
Prevalence of Developmental Coordination Disorder Using the DSM-IV at 7
Services
Updated Information &
http://pediatrics.aappublications.org/content/123/4/e693
including high resolution figures, can be found at:
References
http://pediatrics.aappublications.org/content/123/4/e693#BIBL
This article cites 17 articles, 3 of which you can access for free at:
Subspecialty Collections
al_issues_sub
http://www.aappublications.org/cgi/collection/development:behavior
Developmental/Behavioral Pediatrics following collection(s):
This article, along with others on similar topics, appears in the
Permissions & Licensing
http://www.aappublications.org/site/misc/Permissions.xhtml
in its entirety can be found online at:
Information about reproducing this article in parts (figures, tables) or
Reprints
http://www.aappublications.org/site/misc/reprints.xhtml
DOI: 10.1542/peds.2008-1770
2009;123;e693
Pediatrics
Raghu Lingam, Linda Hunt, Jean Golding, Marian Jongmans and Alan Emond
Based Study
−
Years of Age: A UK Population
Prevalence of Developmental Coordination Disorder Using the DSM-IV at 7
http://pediatrics.aappublications.org/content/123/4/e693
located on the World Wide Web at:
The online version of this article, along with updated information and services, is
by the American Academy of Pediatrics. All rights reserved. Print ISSN: 1073-0397.