1159
MITOCHONDRIAL DNA D-LOOP SEQUENCE
ANALYSIS OF BUSHA CATTLE
Polona Margeta
1, Vladimir Margeta
11 Josip Juraj Strossmayer University of Osijek, Faculty of Agrobiotechnical sciences in Osijek, Vladimira Preloga 1,
31000 Osijek, Croatia
To link to this article: https://doi.org/10.11118/actaun201967051159 Received: 22. 7. 2019, Accepted: 9. 9. 2019
To cite this article: MARGETA POLONA, MARGETA VLADIMIR. 2019. Mitochondrial DNA D-loop Sequence Analysis of Busha Cattle. Acta Universitatis Agriculturae et Silviculturae Mendelianae Brunensis, 67(5): 1159–1164.
Abstract
Maintaining the genetic diversity of autochthonous breeds is very important and should be included in animal breeding strategies and conservation plans with the aim to preserve animals, adapted to
variety of husbandry systems and different environmental conditions. Mitochondrial DNA (mtDNA)
variation studies were particularly useful in establishing relationship and variability between
and within domestic species populations. The mtDNA D-loop sequencing was used to determine the genetic status of 41 Busha cattle from different parts of Croatia along with 21 Busha mtDNA sequences from Genbank, and assessing Busha cattle phylogenetic relationship to the other Croatian autochthonous cattle breeds, as well as to the commercial cattle breeds and main described mtDNA haplotypes. The analysis of Busha cattle mtDNA D-loop sequences revealed presence of 26 different haplotypes, which confirms a high genetic variability of the preserved maternal components. Comparison with major cattle haplogroups sequences revealed that majority of Busha cattle were in the T3 haplogroup (44%), while other haplotypes were present in lesser extent (8% T1, 7% T2, 13% T4 and 5% T6). Haplotype H2 (23% of all Busha cattle sequences) didn’t cluster with any of the T haplogroups. Employment of more powerful genetic markers should reveal the correct status of the new haplotype H2 and better understanding of genetic variation and relationships among Busha cattle and entire brachicerous cattle population.
Keywords: autochthonous cattle breeds, Busha cattle, mitochondrial DNA, phylogeny, cattle mitochondrial DNA haplogroups
INTRODUCTION
Maintaining the genetic diversity, i.e. the extent
of genetic variation within and among breeds, is very important and should be included in animal breeding strategies and conservation plans of domestic animals, especially in autochthonous breeds, with the aim to preserve animals, adapted
to variety of husbandry systems and different environmental conditions.
One of the most commonly used genetic markers
is mitochondrial DNA (mtDNA) sequence. Generally, it is believed that mtDNA exhibits a maternal inheritance. Recently, biparental inheritance of mtDNA in humans was proved in three unrelated
multigeneration families, showing high levels of
mtDNA heteroplasmy (Luo et al., 2018). Nevertheless, identification of mtDNA sequence haplotypes is
widely used in genetic variability studies, since
mtDNA has a high level of variability and can often be traced to pre-domestic populations (Lenstra
et al., 2012). Most studies were performed on highly polymorphic displacement loop (D-loop) region, in the last decade also on the whole mtDNA genome sequences, which was helpful in understanding the origin of mitochondrial haplogroups.
mtDNA variation studies were particularly useful
in establishing relationship between domestic
maternal origin of population back to ancient times
(Upadhyay et al., 2017), and also for the variability studies within and between populations (Ivanković
et al., 2014).
The ancient mtDNA sequencing projects on aurochs (Bos primigenius) suggest that modern
cattle might result from two domestication events
in southwest Asia, which gave rise to taurine (Bos
taurus) and zebuine (Bos indicus)cattle, respectively
(Troy et al., 2001). Independent domestication in Africa and East Asia has also been postulated (Mannen et al., 2004). Recently, it was shown that the oldest European cattle breed is the Balkan brachicerous cattle (Hristov et al., 2015b), which belongs to the Busha cattle (Bos primigenius f. Taurus).
Cattle mtDNA data analysis reveals several basic haplogroups with different local geographical distributions and frequencies (Lenstra et al., 2014). The macro-haplogroup T includes five haplogroups T1–T5, which are found in all modern cattle populations (Magee et al., 2014). T3 haplogroup is probably of Middle East origin and is predominant among European taurine populations. The T5 haplogroup was reported only in Italy (Bonfiglio
et al., 2010) and Croatia (Ivanković et al., 2014). Middle East origin of other basic haplogroups T1 and T2 have also been pointed out (Lenstra et al., 2014; Troy et al., 2001). The T1 haplogroup is
disseminated predominantly in Africa and South
Europe (Bonfiglio et al., 2012). The T2 has been found only in few South European and Asian cattle populations (Achilli et al., 2008; Ivanković
et al., 2014) and the T4 haplogroup has its origins probably in North and East Asia (Mannen et al., 2004). A newly defined haplogroup T6 is Balkan-specific, found in 14 out of 17 analyzed ancient samples (8 – B.primigenius; 7 – B. taurus and 2 –
B. taurus/B. primigenius) from Bulgaria (Hristov et al., 2015b). This haplogroup significantly prevailed in ancient samples (75%) and surprisingly also in the
present day Shorthorn Rhodopean cattle population
(20%), a Busha cattle from Bulgaria.
Busha cattle (Bos primigenius f. taurus) is one of
three Croatian autochthonous cattle breeds and is
existent throughout the Balkan Peninsula. The breed is represented with a different name, depending on the geographical locations. The genetic profiling of Busha populations from Bulgaria (Hristov et al., 2015a; Hristov et al., 2017), Serbia (Kantanen et al., 2009), and Croatia (Ramljak et al., 2011; Ivanković et al., 2014) showed higher diversity in Busha
populations as compared with other surrounded
autochthonous cattle breeds. All of those breeds show a small height (ranged from 90 to 115 cm),
a body weight of adult animals ranging between
150 and 250 kg, and animals mostly located in the mountains. As other local cattle breeds, they are
well adapted to the very harsh feeding and housing conditions, resistant to diseases and have a long
production life. Today’s Croatian population counts 1309 cows and 114 bulls.
The aim of present work was to determine the
genetic status of 41 Busha cattle from different parts of Croatia based on sequencing of mtDNA D-loop, along with 21 Busha mtDNA sequences from Genbank, and assessing Busha cattle phylogenetic
relationship to the other Croatian autochthonous cattle breeds, as well as to the commercial cattle
breeds and main described mtDNA haplotypes.
MATERIALS AND METHODS
Tissue samples were collected from 41 individuals of Busha cattle from different parts of Croatia. Genomic DNA was extracted from ear clips using DNeasy Blood & Tissue Kit (Qiagen GmbH, Germany). The D-loop region in the length of 994bp was amplified by using forward primer 5’-CAGTCTCACCATCAACCCCC-3’ and reverse primer 5’- TCAGTGCCTTGCTTTGGGTT-3’ amplifying a fragment between the tRNAPro
gene and the central conserved sequence block (nt positions 15741-16338; 1-396) of the Bos taurus mitochondrion complete genome NCBI Reference Sequence (NC_006853.1). The same primer pair was used for sequencing of the PCR products, which were extracted from agarose gel with GeneJET Gel Extraction Kit (Thermo Scientific). Sequences were opened and analyzed in FinchTV 1.4.0 (Geospiza). All sequences were trimmed to the equal length of 703bp (between nt positions 15791 and 280 of the NCBI reference sequence).
Additional 60 sequences of the same length were retrieved from the Genbank; accession numbers are available in the Supplemental data file. Complete alignments were performed in ClustalX 2.1 with the
default parameters and iteration of each alignment
step.
Alignments were exported in the Nexus format and further analyzed with PopArt software (Leigh and Bryant, 2015). The software was used to infer
haplotype network from the alignment data using
the integer Neighbor Joining Network method. This method begins with a Neighbor-Joining tree, but
sets the branch lengths to integer values so that they represent the number of mutations between
sequences. To differentiate between different
breeds, the breed names were imported as traits
for each analyzed sequence. PopArt was also used
to calculate basic statistics, such as number of
Alignment of determined Busha cattle haplotypes
and Genbank sequences of main cattle mtDNA haplotypes (T1–T6, Q, P, I1, I2), as well as NCBI reference sequence and sequences of B. indicus and
Bison bison was conducted in MEGA X software (Kumar et al., 2018). The analyses performed in MEGA X included calculation of overall mean
and pairwise distances between haplotypes, the
nucleotide frequencies, number of variable and parsimony informative sites. The evolutionary history was inferred using the Neighbor-Joining method (Saitou and Nei, 1987). The tree was drawn
to scale, with branch lengths in the same units as those of the evolutionary distances used to infer
the phylogenetic tree. The evolutionary distances were computed using the Maximum Composite Likelihood method (Tamura et al., 2004). Analysis involved 39 nucleotide sequences. All ambiguous positions were removed for each sequence pair and there were a total of 735 positions in the fi nal dataset.
A NeigborNet network from aligned haplotypes was constructed in SplitsTree4 program (Huson and Bryant, 2006), version 4.14.8.
RESULTS
The statistical analysis of aligned 122 sequences, 62 of them Busha cattle, of mtDNA D-loop region (703 sites) revealed 52 segregating sites and 24 parsimony-informative sites. The Tajima’s D value was 173.784, meaning that there are more haplotypes (more average heterozygosity) than
number of segregating sites and that rare alleles are
present at low frequency. The π value of nucleotide diversity was 0.806489.
The AMOVA analysis didn’t show any statistical signifi cant subdivision among the breeds (P < 0.001).
The partitioning levels of genetic diversity within
and among the populations revealed that 83% of the total genetic variance existed within populations, and 10% between diff erent groups of cattle.
A NeigborNet network from aligned haplotypes was constructed in SplitsTree4 program (Huson
124
and Bryant, 2006), version 4.14.8.
125
126
Results
127
The statistical analysis of aligned 122 sequences, 62 of them Busha cattle, of mtDNA D-loop
128
region (703 sites) revealed 52 segregating sites and 24 parsimony-informative sites. The Tajima's
129
D value was 173.784, meaning that there are more haplotypes (more average heterozygosity) than
130
number of segregating sites and that rare alleles are present at low frequency.
The π value of
131
nucleotide diversity was 0.806489.
132
133
Figure 1: Integer Neighbor Joining Network of Busha cattle mtDNA D-loop aligned sequences in relation to other
134
Croatian autochthonous cattle breeds (Podolian, Istrian) and other cattle breeds, showing 3 main haplogroups, one
135
specific only for the Busha cattle.
136
Integer Neighbor Joining Network of Busha
cattle, other two Croatian autochthonous cattle
breeds (Podolian, Istrian) and other cattle breeds (Brown Swiss, Simmental, Piedmontese, Limousine, Hereford, Red Angus, Jersey, and NCBI reference sequence) showed 3 main haplogroups (Fig. 1). The largest haplogroup consistet of 23 sequences belonging to Croatian autochthonous breeds (12 Busha cattle – 50%, 5 Podolian cattle – 22.7% and 6 Istrian cattle – 27.3%). The second was characteristic only for Busha cattle (14 representatives, i.e. 23% of all Busha cattle analyzed sequences) and the third contained 9 sequences (6 Busha cattle – 66.7%, 1 Podolian cattle – 11.1%, 1 Istrian cattle – 11.1% and 1 Piedmontese cattle – 11.1%). Sequences of 31 Busha cattle (50.8%) were found in this three haplogroups. Altogether 26 haplotypes were observed in Busha cattle population, 17 of them represented just by one sequence.
Alignment of determined 26 Busha cattle haplotypes and Genbank sequences of main cattle mtDNA haplotypes (T1–T6, Q, P, I1, I2), as well as NCBI B. taurus reference sequence and sequences of B. indicus and Bison bison was used for
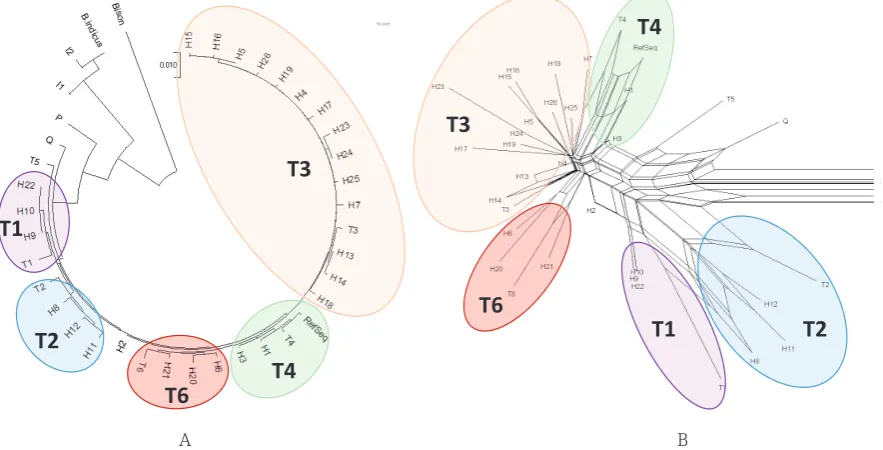
construction of Neigbor-joining tree (Fig. 2A) and NeighborNet network (Fig. 2B) of cattle haplotypes based on the mtDNA D-loop region sequences (nt 15791-16338; 1-280). The Neigbor-joining tree and NeighborNet network showed clustering of Busha cattle haplotypes with 5 main cattle mtDNA haplotypes of the macro-haplogroup T. The majority of samples were in the T3 haplogroup (44%), while other haplotypes were present in lesser extent (8% T1, 7% T2, 13% T4 and 5% T6). Interestingly,
haplotype H2 (23% of all Busha cattle sequences) didn’t cluster with any of the T haplogroups neither in the Neigbor-joining tree, neither in NeighborNet network, but was placed close to the T6 clade in both cases.
The statistical analyses performed in MEGA X
included calculation of overall mean and pairwise distances between haplotypes, the nucleotide
frequencies, number of variable and parsimony informative sites. Pairwise distances between Busha cattle haplotypes ranged from 0.00142 to 0.01149
and the mean overall distance among all haplotypes
was 0.02. The between group distance between Busha cattle and Istrian cattle was 0.00477, between Busha and Podolian cattle 0.00351 and between Istrian and Podolian cattle 0.00338, respectively.
The number of variable sites among all haplotypes
was 111 and dropped to 42 (Busha cattle and T haplogroups) and to 34 sites when considering only Busha cattle haplotypes. Among 42 variable sites between Busha cattle and T macro-haplogroup haplotypes, 19 were parsimony informative. The average nucleotide composition was 29.8% T, 23.9% C, 30.4% A and 16% G, respectively.
DISCUSSION
The analysis of 62 Busha cattle mtDNA D-loop sequences (nt 15791-16338; 1-280) revealed presence of 26 diff erent haplotypes, which confi rms a high genetic variability of the preserved
maternal components as already described by other
authors (Kantanen et al., 2009; Ramljak et al., 2011; Ivanković et al., 2014; Hristov et al., 2015a). Contrary to Ivanković et al. (2014) describing the majority
T1
T2
T6
T3
T4
T1
T2
T6
T4
T3
The AMOVA analysis didn’t show any statistical significant subdivision among the breeds (
P
<
137
0.001). The partitioning levels of genetic diversity within and among the populations revealed that
138
83% of the total genetic variance existed within populations, and 10% between different groups of
139
cattle.
140
Integer Neighbor Joining Network of Busha cattle, other two Croatian autochthonous cattle breeds
141
(Podolian, Istrian) and other cattle breeds (Brown Swiss, Simmental, Piedmontese, Limousine,
142
Hereford, Red Angus, Jersey, and NCBI reference sequence) showed 3 main haplogroups (Figure
143
1). The largest haplogroup consistet of 23 sequences belonging to Croatian autochthonous breeds
144
(12 Busha cattle – 50%, 5 Podolian cattle – 22.7% and 6 Istrian cattle – 27.3%). The second was
145
characteristic only for Busha cattle (14 representatives, i.e. 23% of all Busha cattle analyzed
146
sequences) and the third contained 9 sequences (6 Busha cattle – 66.7%, 1 Podolian cattle – 11.1%,
147
1 Istrian cattle – 11.1% and 1 Piedmontese cattle – 11.1%). Sequences of 31 Busha cattle (50.8%)
148
were found in this three haplogroups. Altogether 26 haplotypes were observed in Busha cattle
149
population, 17 of them represented just by one sequence.
150
151
152
153
154
155
156
157
158
159
160
161
162
163
164
Figure 2 Neigbor-joining tree (A) and NeighborNet network (B) of cattle haplotypes based on the mtDNA D-loop
165
region sequences (nt 15791-16338; 1-280) including 26 haplotypes observed in Busha cattle and Genbank sequences
166
of main cattle mtDNA haplotypes (T1 – T6, Q, P, I1, I2), as well as NCBI B. taurusreference sequence and sequences
167
of B. indicusand Bison bison.
168
A
A BB
of haplotypes (over 80%) in the T3 haplogroup and in line with findings of Hristov et al. (2015a) with 57% of haplotypes in the haplogroup T3, the
results of present research revealed clustering of
44% of Busha cattle sequences with T3 haplotype sequence. Similar to Hristov et al. (2015a), T1 and T2 haplotypes were observed in much lower frequencies (8% T1 and 7% T2). 5% of Busha
cattle haplotypes clustered together with newly
described T6 haplogroup, which is less than in the results of Hristov et al. (2015a) where 20% of
Shorthorn Rodopean cattle population belong to
this haplogroup. Nevertheless, 14 sequences (23%) of H2 Busha cattle haplotype (majority of them from Imotski region in southern Dalmatia) didn’t
cluster with described major T haplogroups, but
were close to the T6 haplogroup. Detailed insight into the sequences of H2 haplotype and comparison with higher number of T6 haplogroup sequences
should reveal the correct status of this haplotype
(haplogroup T6, its new subtype, or even a new haplogroup).
The statistical analysis of the results suggests high
variability among Busha cattle breed, since 34 out of 42 variable sites in analyzed Busha cattle, Istrian
and Podolian cattle and major T haplotypes were
present in Busha cattle population. The between
group distance between Busha cattle and other two
Croatian autochthonous breeds confirmed findings of Ivanković et al. (2014) with the largest mean genetic distance between Istrian cattle and Busha
cattle, while the genetic distance between other
two groups is smaller. Also the partitioning levels of
genetic diversity within and among the populations
was in line with the previous results (Ivanković
et al., 2014) showing that majority (83%) of the total genetic variance existed within populations, and only 10% between different groups of cattle. The Tajima’s D results suggests that there are more haplotypes (more average heterozygosity) than
number of segregating sites and that rare alleles
are present at low frequency, which was also
observed on the haplotype level with high number
of haplotypes represented just by one sequence.
CONCLUSION
The analysis of 62 Busha cattle mtDNA D-loop sequences (nt 15791-16338; 1-280) revealed high variability among Busha cattle breed with 26 different haplotypes, but with large number of haplotypes present at low frequencies. Comparison with major cattle haplogroups sequences revealed that majority of Busha cattle belongs to the T3 haplogroup (44%), while other haplotypes were present in lesser extent (8% T1, 7% T2, 13% T4 and 5% T6). Interestingly, haplotype H2 (23% of all Busha cattle sequences) didn’t cluster with any of the T haplogroups neither in the Neigbor-joining tree, neither in NeighborNet network, but was placed close to the T6 clade in both cases. Detailed insight into the sequences of H2 haplotype, comparison with higher number of T6 haplogroup sequences and employment of more powerful genetic markers such as SNPs and whole genome sequencing should reveal the correct status of this haplotype and better understanding of genetic variation and relationships among Busha cattle and entire brachicerous cattle population.
REFERENCES
ACHILLI, A., OLIVIERI, A., PELLECCHIA, M., UBOLDI, C., COLLI, L., AL-ZAHERY, N., ACCETTURO, M., PALA, M., KASHANI, B. H., PEREGO, U. A., BATTAGLIA, V., FORNARINO, S., KALAMATI, J., HOUSHMAND, M., NEGRINI, R., SEMINO, O., RICHARDS, M., MACAULAY, V., FERRETTI, L., BANDELT, H-J., AJMONE-MARSAN, P. and TORRONI, A. 2008. Mitochondrial genomes of extinct aurochs survive in domestic cattle. Current Biology, 18(4): 157–158.
BONFIGLIO, S., ACHILLI, A., OLIVIERI, A., NEGRINI, R., COLLI, L., LIOTTA, L., AJMONE-MARSAN, P., TORRONI, A. and FERRETTI, L. 2010. The enigmatic origin of bovine mtDNA haplogroup R: sporadic interbreeding or an independent event of Bos primigenius domestication in Italy? PLoS One, 5(12): e15760.
BONFIGLIO, S., GINJA, C., DE GAETANO, A., ACHILLI, A., OLIVIERI, A., COLLI, L., TESFAYE, K., AGHA, S. H., GAMA, L. T., CATTONARO, F. et al. 2012. Origin and spread of Bos taurus: new clues from mitochondrial genomes belonging to haplogroup T1. PLoS One, 7(6): e38601.
BRUFORD, M. W., BRADLEY, D. G. and LUIKART, G. 2003. DNA markers reveal the complexity of livestock domestication. Nature Reviews Genetics, 4: 900–910.
EXCOFFIER, L., SMOUSE, P. and QUATTRO, J. 1992. Analysis of molecular variance inferred from metric distances among DNA haplotypes: Application to human mitochondrial DNA restriction data. Genetics, 131(2): 479–491.
HRISTOV, P., TEOFANOVA, D., NEOV, B., SHIVACHEV, B. and RADOSLAVOV, G. 2015b. Mitochondrial diversity in autochthonous cattle breeds from the Balkan Peninsula. Czech J. Anim. Sci, 60(7): 311– 318.
HRISTOV, P., SPASSOV, N., ILIEV, N. and RADOSLAVOV, G. 2017. An independent event of Neolithic cattle domestication on the South-eastern Balkans: evidence from prehistoric aurochs and cattle populations. Mitochondrial DNA A DNA Mapp. Seq. Anal., 28(3): 383–391.
HUSON, D. H. and BRYANT, D. 2006. Application of Phylogenetic Networks in Evolutionary Studies.
Mol. Biol. Evol., 23(2): 254–267.
IVANKOVIĆ, A., PAPRIKA, S., RAMLJAK, J. and DOVČ, P. 2014. Mitochondrial DNA-based genetic evaluation of autochthonous cattle breeds in Croatia. Czech J. Anim. Sci., 59(14): 519–528.
KUMAR, S., STECHER, G., LI, M., KNYAZ, C. and TAMURA, K. 2018. MEGA X: Molecular Evolutionary Genetics Analysis across computing platforms. Molecular Biology and Evolution, 35(6): 1547–1549. KANTANEN, J., EDWARDS, C. J., BRADLEY, D. G., VIINALASS, H., THESSLER, S., IVANOVA, Z., KISELYOVA,
T., CINKULOV, M., POPOV, R., STOJANOVIC, S. et al. 2009. Maternal and paternal genealogy of Eurasian taurine cattle (Bos taurus). Heredity, 103(5): 404–415.
LEIGH, J. W. and BRYANT, D. 2015. PopART: Full-feature software for haplotype network construction.
Methods Ecol. Evol., 6(9): 1110–1116.
LENSTRA, J. A., GROENEVELD, L. F., EDING, H., KANTANEN, J., WILLIAMS, J. L., TABERLET, P., NICOLAZZI, E. L., SÖLKNER, J., SIMIANER, H., CIANI, E., GARCIA, J. F., BRUFORD, M. W., AJMONE-MARSAN, P. and WEIGEND, S. 2012. Molecular tools and analytical approaches for the characterization of farm animal genetic diversity. Anim. Genet., 43(5): 483–502.
LUO, S., VALENCIA, C. A., ZHANG, J., LEE, N. C., SLONE, J., GUI, B., WANG, X., LI, Z., DELL, S., BROWN, J., CHEN, S. M., CHIEN, Y. H., HWU, W. L., FAN, P. C., WONG, L. J., ATWAL, P. S. and HUANG, T. 2018. Biparental Inheritance of Mitochondrial DNA in Humans. Proc. Natl. Acad. Sci. USA, 115(51): 13039–13044.
MAGEE, D. A., MACHUGH, D. E. and EDWARDS, C. J. 2014. Interrogation of modern and ancient genomes reveals the complex domestic history of cattle. Anim. Front., 4(3): 7–22.
MANNEN, H., KOHNO, M., NAGATA, Y., TSUJI, S., BRADLEY, D. G., YEO, J. S., NYAMSAMBA, D., ZAGDSUREN, Y., YOKOHAMA, M., NOMURA, K. et al. 2004. Independent mitochondrial origin and historical genetic differentiation in North Eastern Asian cattle. Mol. Phylogenet. Evol., 32(2): 539– 544.
NADERI, S., REZAEI, H. R., POMPANON, F., BLUM, M. G., NEGRINI, R., NAGHASH, H. R., BALKIZ, O., MASHKOUR, M., GAGGIOTTI, O. E., AJMONE-MARSAN, P., KENCE, A., VIGNE, J. D. and TABERLET, P. 2008. The goat domestication process inferred from large-scale mitochondrial DNA analysis of wild and domestic individuals. Proceedings of the National Academy of Sciences of the United States of America, 105(46): 17659–17664.
RAMLJAK, J., IVANKOVIĆ, A., VEIT-KENSCH, C. E., FORSTER, M. and MEDUGORAC, I. 2011. Analysis of
genetic and cultural conservation value of three indigenous Croatian cattle breeds in a local and
global context. J. Anim. Breed. Genet., 128(1): 73–84.
SAITOU, N. and NEI, M. 1987. The neighbor-joining method: a new method for reconstructing phylogenetic trees. Molecular Biology and Evolution, 4(4): 406–425.
TAJIMA, F. 1999. Statistical method for testing the neutral mutation hypothesis by DNA polymorphism.
Genetics, 123(3): 585–595.
TAMURA, K., NEI, M. and KUMAR, S. 2004. Prospects for inferring very large phylogenies by using the neighbor-joining method. Proceedings of the National Academy of Sciences of the United States of America, 101(3): 11030–11035.
TROY, C. S., MACHUGH, D. E., BAILEY, J. F., MAGEE, D. A., LOFTUS, R. T., CUNNINGHAM, P., CHAMBERLAIN, A. T., SYKES, B. C. and BRADLEY, D. G. 2001. Genetic evidence for Near-Eastern origins of European cattle. Nature, 410: 1088–1099.
UPADHYAY, M. R., CHEN, W., LENSTRA, J. A., GODERIE, C. R. J., MACHUGH, D. E., PARK, S. D. E., MAGEE, D. A., MATASSINO, D., CIANI, F., MEGENS, H. J., VAN ARENDONK, J. A. M., GROENEN, M. A. M. and EUROPEAN CATTLE GENETIC DIVERSITY CONSORTIUM; RPMA CROOIJMANS. 2017. Genetic origin, admixture and population history of aurochs (Bos primigenius) and primitive European cattle.
Heredity, 118(2): 169–176.
Contact information