OncoTargets and Therapy 2016:9 2465–2478
OncoTargets and Therapy
Dove
press
submit your manuscript | www.dovepress.com 2465
O r i g i n a l r e s e a r c h
open access to scientific and medical research
Open access Full Text article
Long noncoding RNA expression profile analysis
of colorectal cancer and metastatic lymph node
based on microarray data
Peng Yang1,*
Zi-Peng Xu1,*
Tao chen1
Zhen-Yu he2
1The second clinical Medical college
of nanjing Medical University,
2Department of general surgery, The
second affiliated hospital of nanjing Medical University, nanjing, Jiangsu Province, People’s republic of china
*These authors contributed equally to this work
Abstract: Long noncoding RNAs (lncRNAs) are emerging as an important part of biological progress in cancers, yet the aberrant lncRNAs implicated in colorectal cancer (CRC) with lymph node metastasis remain unknown. In this study, a total of 390 lncRNA transcripts and 508 mRNA transcripts were dysregulated in tumor tissues compared with paired metastatic lymph nodes. Functional prediction showed that lots of lncRNAs might be involved in biological pathways related to CRC metastasis by cis-regulation and trans-regulation of coexpressed genes. As a representative, ENST00000430471 was associated with cell proliferation and invasion of CRC cells. These results provided support for further investigations of the metastatic pathogenesis of CRC.
Keywords: colorectal cancer, lymph node metastasis, long noncoding RNA, microarray,
ENST00000430471
Introduction
Colorectal cancer (CRC) is one of the most common causes of cancer-related deaths in the world, leading to 600,000 deaths each year worldwide.1,2 Clinically, a considerable
number of CRC patients with metastasis, such as blood metastasis and lymph node metastasis, fail to respond well with the help of current treatment regimens. Lymph node metastasis is the most common metastatic site, and ~50% of CRC patients with lymph node metastasis experience disease recurrence.3,4 Therefore, disclosing the
molecular mechanisms underlying metastasis is urgently needed for developing effec-tive therapies and improving patients’ prognosis.
Long noncoding RNAs (lncRNAs), unable to be translated into proteins and .200 nt in length, have emerged as an important aspect of biology.5,6 Evidences suggest that
they are capable of controlling protein-coding and noncoding genes and interacting with known cancer genes.7–9 For instance, HOTAIR, highly expressed in breast tumors,
could promote metastasis through reprogramming the chromatin state.10 Several
lncRNAs that play significant roles in tumorigenesis and might be potential biomark-ers for CRC diagnostic and prognosis have been proposed in our previous study.11
However, the roles that lncRNAs play in the progress of lymph node metastasis of CRC remain unknown.
To profile the lncRNA expression patterns in tumor tissues of CRC compared with paired metastatic lymph node (MLN), the lncRNA microarray expression profile in three pairs of CRC tumor tissues compared with MLNs was presented in this study. Then, we predicted the potential functions of differentially expressed lncRNAs based
correspondence: Zhen-Yu he Department of general surgery, The Second Affiliated Hospital of Nanjing Medical University, 121 Jiangjiayuan road, nanjing 210011, Jiangsu Province, People’s republic of china Tel/fax +86 25 5850 9900 email [email protected]
Journal name: OncoTargets and Therapy Article Designation: Original Research Year: 2016
Volume: 9
Running head verso: Yang et al
Running head recto: Metastatic pathogenesis of CRC DOI: http://dx.doi.org/10.2147/OTT.S102348
OncoTargets and Therapy downloaded from https://www.dovepress.com/ by 118.70.13.36 on 26-Aug-2020
For personal use only.
Number of times this article has been viewed
This article was published in the following Dove Press journal: OncoTargets and Therapy
Dovepress Yang et al
on their coexpressed protein-coding genes. Next, a novel lncRNA, ENST00000430471, that displayed a higher expres-sion level in MLNs compared with tumor tissues was selected for functional analysis and further study.
Patients and methods
Tissue collection
A total of 26 CRC patients who underwent surgical resections at The Second Affiliated Hospital of Nanjing Medical Uni-versity from 2011 to 2012 were recruited for our study. These patients received neither chemotherapy nor radiotherapy prior to the operation. A written informed consent was obtained from all the patients, and approval was obtained from the eth-ics committee of The Second Affiliated Hospital of Nanjing Medical University. Two experienced pathologists collected lymph nodes from the CRC patients during the operation and stained them with hematoxylin and eosin. According to the hematoxylin and eosin staining results, the lymph nodes were divided into MLNs and normal lymph nodes. All samples were frozen in liquid nitrogen until further analysis. For microarray analysis, three pairs of samples (three tumor tis-sues and three MLNs) from the CRC patients were used.
Microarray expression profiling
Three pairs of CRC tumor tissues and MLNs were used to synthesize double-stranded complementary DNA (cDNA), which was labeled and hybridized on the SurePrint G3 Human Gene Expression 8x60K v2 Microarray (Agilent Technolo-gies, Santa Clara, CA, USA). Processed slides were scanned with the Agilent G2505C Microarray Scanner (Agilent Technologies) after hybridization and washing. Raw data were extracted using Feature Extraction (version 10.7.1.1; Agilent Technologies). Then, quantification of normalization and subsequent data processing were performed using the GeneSpring software (version 12.0; Agilent Technologies). After that, raw signals from the microarray were log2 trans-formed and specific expression of mRNAs and lncRNAs were defined when the absolute value of fold change was .2 and
P-value was ,0.05. The microarray profiling was conducted by the OE Biotechnology Company (Shanghai, People’s Republic of China).
coexpression network and functional
prediction
According to the specific expressed genes, coexpression networks were built to identify the interactions among genes.12 First, Pearson’s correlation coefficient of the
dys-regulated lncRNA compared with that of each dysdys-regulated mRNA was calculated to find its coexpressed mRNAs. The
absolute value of 0.8 with a correlation P-value ,0.05 was considered statistically significant. Then lncRNA gene func-tions were predicted using the hypergeometric cumulative distribution function based on the coexpression of mRNA using Gene Ontology (GO) and Kyoto Encyclopedia of Genes and Genomes (KEGG) annotations. The threshold of statistical significance was set as a P-value ,0.05 and false discovery rate ,0.01.
Evidence shows that several lncRNAs can exert their
cis-regulating functions by recruiting remodeling factors to
local chromatin.13 We defined cis-regulated genes as
protein-coding genes coexpressed with one dysregulated lncRNA and within 300 kbp upstream or downstream in genomic distance in the same allele.
The core transcription factors (TFs) are trans-regulated by specific lncRNAs to participate in certain biological pathways.14,15 Thus, we compared the coexpressed mRNAs of
these lncRNAs with the mRNAs that were regulatory targets of certain TFs to predict that these lncRNAs possibly partici-pate in pathways regulated by these TFs. The lncRNA–TF network was constructed using hypergeometric cumulative distribution function of MATLAB 2012b (MathWorks, Natick, MA, USA). The graph of the lncRNA–TF network was drawn using Cytoscape 3.01 (Agilent Technologies and IBS; Agilent Technologies, Santa Clara, CA, USA).
As the lncRNA coexpression genes might participate in lncRNA-mediated gene regulation, we constructed the “TF–lncRNA–genes” network based on the interactions of lncRNAs and target coexpression genes as previously described.16 The three groups were generated based on
the “TF–lncRNA” two-element network with the help of Cytoscape software.
rna extraction and quantitative
real-time polymerase chain reaction analysis
Total RNA was extracted from 26 snap frozen subsets and cultured cells using TRIzol reagent (Thermo Fisher Scien-tific, Waltham, MA, USA) according to the manufacturer’s protocol. For quantitative real-time polymerase chain reaction (qRT-PCR) analyses, RNA was reverse transcribed to cDNA by using a reverse transcription kit (Takara Biotechnology, Dalian, People’s Republic of China). Then, qRT-PCR was per-formed using SYBR Green (Takara Biotechnology) according to the manufacturer’s instructions. The qRT-PCR results were normalized to glyceraldehyde-3-phosphate dehydrogenase.
cell culture
Three human CRC cell lines SW480, HCT116, and SW620 were obtained from the Cell Bank of the Chinese Academy
OncoTargets and Therapy downloaded from https://www.dovepress.com/ by 118.70.13.36 on 26-Aug-2020
Dovepress Metastatic pathogenesis of crc
of Medical Sciences (Shanghai, People’s Republic of China). Cells were cultured in Dulbecco’s Modified Eagle’s Medium (Thermo Fisher Scientific) in an atmosphere of 5% CO2 at 37°C. All the media were supplemented with 10% fetal bovine serum, penicillin, and streptomycin (Thermo Fisher Scientific).
Plasmid Dna transfection
According to the full-length ENST00000430471 sequence in Ensembl, the ENST00000430471 sequence was synthesized and subcloned into a pCDNA3.1 vector (Thermo Fisher Scientific). The empty vector was used as the control. The pCDNA-ENST00000430471 and empty vector were trans-fected into HCT116 cells seeded at six-well plates using Lipofectamine 2000 (Thermo Fisher Scientific), according to the manufacturer’s suggested protocol. The expression level of ENST00000430471 was detected by qRT-PCR.
cell proliferation assay
The viability of HCT116 cells was assessed using the Cell Counting Kit-8 (CCK-8; Dojindo, Kumamoto, Japan) fol-lowing the manufacturer’s instructions. CCK-8 solution was used to measure cell viability at 24 hours, 48 hours, and 72 hours after transfection. The absorbance value of each well was measured at 450 nM. For the colony formation assay, a total of 500 cells were seeded in six-well plates to allow colony formation for 2 weeks. The colonies were fixed with methanol and stained with Giemsa, and the number of colonies was counted after 20 minutes.
Flow-cytometric analysis
For the cell cycle analysis, transfected cells were fixed in 75% ethanol overnight. The cells were stained for 30 minutes with propidium iodide (50 µg/mL; Sigma-Aldrich Co., St Louis, MO, USA) and 0.25 mg/mL of RNase A (Sigma-Aldrich Co.). Next, the cells were analyzed by flow cytom-etry (FACScan; BD Biosciences, San Jose, CA, USA) using CellQuest software (BD Biosciences). The percentage of the cells in G0–G1, S, and G2–M phases was counted and compared.
For the cell apoptosis assay, the cells were treated with fluorescein isothiocyanate-Annexin V and propidium iodide in the dark, according to the manufacturer’s instructions. Then the cells were detected by flow cytometry with the help of CellQuest software. Cells were discriminated into dead cells, viable cells, early apoptotic cells, and late apoptotic cells. Next, the percentage of early apoptotic cells and late apoptotic cells was compared with empty vector from each experiment. Each assay was repeated in triplicate.
cell migration and invasion assays
In migration assays, 3×10⁴ cells at 48 hours after
transfec-tion were seeded in the upper chamber of the wells in a 200 µL serum-free medium (8 µm pore size; EMD Millipore, Billerica, MA, USA); for the invasion assays, 1×10⁵ cells in
serum-free medium were seeded in the upper chamber coated with Matrigel (BD Biosciences). The lower chambers were filled with 800 µL of 20% medium containing 20% fetal bovine serum. Following the incubation for 24 hours, cells on the filter surface were fixed with methanol, stained with 0.1% crystal violet, and photographed with a phase-contrast inverted microscope. Experiments were independently repeated three times.
statistical analysis
The statistical significance of differences between groups was estimated by Student’s t-test on SPSS software (version 18.0; SPSS Inc., Chicago, IL, USA). A P-value of ,0.05 was chosen for statistical significance. The results are reported as mean ± SD. All experiments were performed at least three times.
Results
lncRNA and mRNA expression profiles
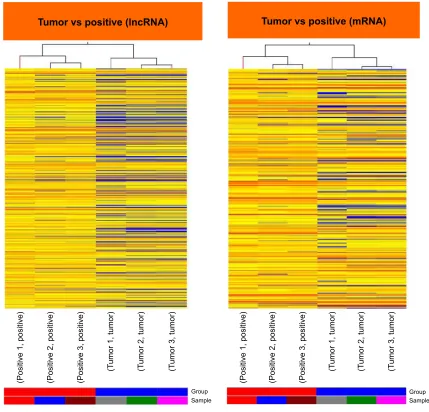
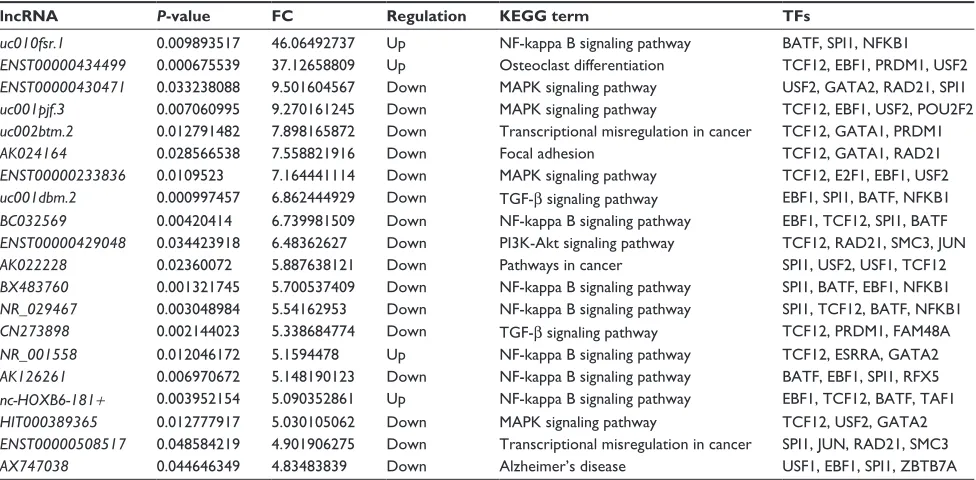
Differentially expressed lncRNAs and mRNAs (fold change $2, P#0.05) were observed in Figure 1. A total of 53 lncRNAs exhibited upregulated expression levels and 337 lncRNAs exhibited downregulated expression levels, whereas 102 mRNAs exhibited upregulated expression levels and 406 mRNAs exhibited downregulated expression levels in the tumor tissues compared with MLNs (Table 1). Among the dysregulated lncRNA transcripts, the most upregulated lncRNA was uc010fsr.1 (up 46.06), whereas
ENST00000430471 (down 9.50) was the most downregulated
lncRNA. These results suggested that these lncRNAs and mRNAs might also have common functions in facilitating the transfers of CRC tumor cells from the primary tumor to lymph nodes. Table 1 lists the top 20 dysregulated lncRNAs from our microarray. A novel lncRNA, ENST00000430471, that displayed the lowest expression in tumor tissues com-pared with MLNs was selected for further study.
Coexpression profiles and the lncRNA
function prediction
One lncRNA can be coexpressed with hundreds of mRNAs. For instance, uc010fsr.1 was coexpressed with 666 mRNA transcripts and ENST00000430471 with 3,749 mRNA transcripts. A heat map was build to show the relation-ships between every differentially expressed lncRNAs
OncoTargets and Therapy downloaded from https://www.dovepress.com/ by 118.70.13.36 on 26-Aug-2020
Dovepress Yang et al
and its coexpression mRNAs using the unsupervised hierarchical clustering analysis. We exhibited the map of ENST00000430471 with its coexpression mRNAs in Figure S1.
The functions of differentially expressed lncRNAs were predicted by the GO and KEGG pathway annotations of their coexpressed mRNAs. According to the P-value and enrich-ment, we counted and summarized the top 200 and 500 cred-ible annotations for coexpressed and aberrant lncRNA genes, respectively. In the GO pathway analyses, the most frequently predicted functions of aberrant lncRNAs were “transform-ing growth factor beta (TGF-β)-activated receptor activity”, “DNA binding TF activity”, “transmembrane signaling receptor activity”, “protein binding”, and “DNA binding”
(Figure 2A and B), while the most common pathways involved in the KEGG pathway were “transcriptional mis-regulation in cancer”, “osteoclast differentiation”, “mitogen-activated protein kinase (MAPK) signaling pathway”, and “nuclear factor-kappa B signaling pathway” as shown in Figure 2C and D. We listed the representative KEGG terms of the top 20 dysregulated lncRNAs in Table 1.
The lncRNA ENST00000430471 was also annotated using GO and KEGG pathway analyses. According to the aforemen-tioned selection criteria, the top 20 enrichment KEGG terms are listed in Table 2, indicating that ENST00000430471 was associated with “adrenergic signaling in cardiomyocytes”, “MAPK signaling pathway”, “regulation of actin cytoskel-eton”, and “pathways in cancer”. The results of the pathway
Figure 1 hierarchical clustering for differentially expressed lncrnas and mrnas in tumor vs Mln (positive).
Notes: “red” indicates high relative expression, and “blue” indicates low relative expression. 1–3 represent patients 1–3, whereas tumor represents tumor tissue and positive represents Mln.
Abbreviations: lncrna, long noncoding rna; Mln, metastatic lymph node.
7XPRUYVSRVLWLYHOQF51$
3RVLWLYHSRVLWLYH 3RVLWLYHSRVLWLYH 3RVLWLYHSRVLWLYH
7
XPRUWXPRU
7
XPRUWXPRU
7
XPRUWXPRU
*URXS 6DPSOH
*URXS 6DPSOH
3RVLWLYHSRVLWLYH 3RVLWLYHSRVLWLYH 3RVLWLYHSRVLWLYH
7
XPRUWXPRU
7
XPRUWXPRU
7
XPRUWXPRU
7XPRUYVSRVLWLYHP51$
OncoTargets and Therapy downloaded from https://www.dovepress.com/ by 118.70.13.36 on 26-Aug-2020
Dovepress Metastatic pathogenesis of crc
analyses consistently showed that ENST00000430471 is associated with the pathogenesis of CRC.
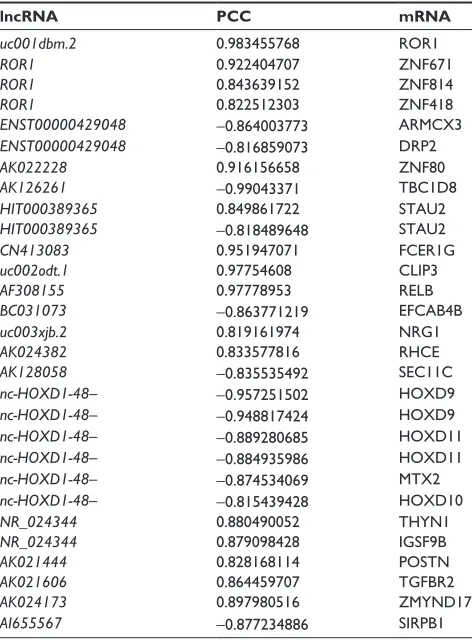
Cis-regulation of lncrna
According to the aforementioned criteria, a total of 104 lncRNA transcripts with their predicted cis-regulating protein-coding genes were found through accurate genomic mapping. The “cis” analyses of some representative lncRNAs are shown in Table 3.
Trans-regulation of lncrna
Because many lncRNAs were involved, we generated a core network map using the top 100 lncRNA–TF pairs in Figure 3. The map displayed that the TF TCF12 modulated the expres-sion of 33 lncRNAs, whereas the TF SPI1 modulated the expression of 21 lncRNAs and the TF EBF1 the expression of 16 lncRNAs. As shown in Table 1, the relative TFs of the top 20 dysregulated lncRNAs were provided. Then, in order to determine the “TF–lncRNA–genes” relationship, we selected the top 1,500 target genes into the “TF–lncRNA” net-work based on the results of lncRNA coexpression analysis (Figure S2). In short, valuable information about TFs, lncR-NAs, and target genes were provided in these maps.
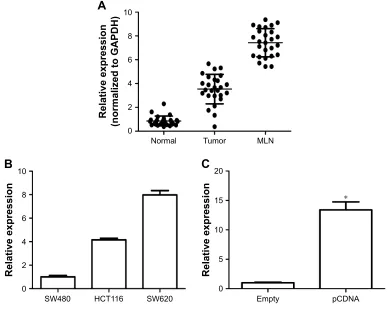
ENST00000430471 is upregulated in crc
To validate the differential expression of ENST00000430471, we performed qRT-PCR assay in 26 CRC tumor tissues,
paired normal tissues, and corresponding MLNs (Figure 4A). The qRT-PCR data showed that ENST00000430471 was significantly upregulated in MLN tissues with an average increasing fold of 3.57 and 6.89 (P,0.01), compared with paired tumor tissues and normal tissues. These results indi-cated that ENST00000430471 might be significantly related to the progress of lymph node metastasis of CRC.
ENST00000430471 promotes
proliferation in hcT116 cells
To investigate the functional role of lncRNA
ENST00000430471 in CRC cells, first, ENST00000430471
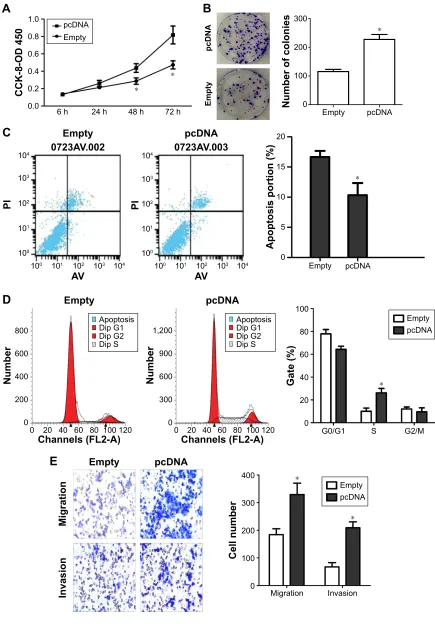
expression was detected by qRT-PCR in three human CRC cell lines (Figure 4B). Notably, SW480 cells expressed relatively lower levels of ENST00000430471 compared with HCT116 and SW620 cells. Then we put our efforts to discover how the CRC cell behavior changes when upregulating the expression of the lncRNA ENST00000430471. After trans-fection, the results of CCK-8 assays revealed that the growth of HCT116 cells with pCDNA–ENST00000430471 was promoted compared with control cells (P,0.05; Figure 5A). The colony formation assays were performed to find that the ability of colony formation of pCDNA–ENST00000430471 cells was significantly stronger than the negative groups (P,0.05; Figure 5B). Taken together, ENST00000430471 was involved in CRC cell proliferation.
Table 1 Top 20 dysregulated lncrnas (tumor vs positive)
lncRNA P-value FC Regulation KEGG term TFs
uc010fsr.1 0.009893517 46.06492737 Up nF-kappa B signaling pathway BaTF, sPi1, nFKB1
ENST00000434499 0.000675539 37.12658809 Up Osteoclast differentiation TcF12, eBF1, PrDM1, UsF2
ENST00000430471 0.033238088 9.501604567 Down MaPK signaling pathway UsF2, gaTa2, raD21, sPi1
uc001pjf.3 0.007060995 9.270161245 Down MaPK signaling pathway TcF12, eBF1, UsF2, POU2F2
uc002btm.2 0.012791482 7.898165872 Down Transcriptional misregulation in cancer TcF12, gaTa1, PrDM1
AK024164 0.028566538 7.558821916 Down Focal adhesion TcF12, gaTa1, raD21
ENST00000233836 0.0109523 7.164441114 Down MaPK signaling pathway TcF12, e2F1, eBF1, UsF2
uc001dbm.2 0.000997457 6.862444929 Down TgF-β signaling pathway eBF1, sPi1, BaTF, nFKB1
BC032569 0.00420414 6.739981509 Down nF-kappa B signaling pathway eBF1, TcF12, sPi1, BaTF
ENST00000429048 0.034423918 6.48362627 Down Pi3K-akt signaling pathway TcF12, raD21, sMc3, JUn
AK022228 0.02360072 5.887638121 Down Pathways in cancer sPi1, UsF2, UsF1, TcF12
BX483760 0.001321745 5.700537409 Down nF-kappa B signaling pathway sPi1, BaTF, eBF1, nFKB1
NR_029467 0.003048984 5.54162953 Down nF-kappa B signaling pathway sPi1, TcF12, BaTF, nFKB1
CN273898 0.002144023 5.338684774 Down TgF-β signaling pathway TcF12, PrDM1, FaM48a
NR_001558 0.012046172 5.1594478 Up nF-kappa B signaling pathway TcF12, esrra, gaTa2
AK126261 0.006970672 5.148190123 Down nF-kappa B signaling pathway BaTF, eBF1, sPi1, rFX5
nc-HOXB6-181+ 0.003952154 5.090352861 Up nF-kappa B signaling pathway eBF1, TcF12, BaTF, TaF1
HIT000389365 0.012777917 5.030105062 Down MaPK signaling pathway TcF12, UsF2, gaTa2
ENST00000508517 0.048584219 4.901906275 Down Transcriptional misregulation in cancer sPi1, JUn, raD21, sMc3
AX747038 0.044646349 4.83483839 Down alzheimer’s disease UsF1, eBF1, sPi1, ZBTB7a
Abbreviations: lncrna, long noncoding rna; Fc, fold change; Kegg, Kyoto encyclopedia of genes and genomes; TF, transcription factor; nF, nuclear factor; MaPK, mitogen-activated protein kinase; TgF, transforming growth factor; P13K, phosphoinositide 3-kinase.
OncoTargets and Therapy downloaded from https://www.dovepress.com/ by 118.70.13.36 on 26-Aug-2020
Dovepress Yang et al
*2_KLJKYROWDJHJDWHGFDOFLXPFKDQQHODFWLYLW\ *2_SRO\$51$ ELQGLQJ *2_SURWHLQSKRVSKDWDVHELQGLQJ *2_WUDQVIRUPLQJJURZWKIDFWRUEHWDELQGLQJ *2_$ 7'1$ ELQGLQJ *2_SURWHLQKRPRGLPHUL]DWLRQDFWLYLW\ *2_LGHQWLFDOSURWHLQELQGLQJ *2_0+&FODVV,,SURWHLQFRPSOH[ELQGLQJ *2_PHWDOLRQELQGLQJ *2_GRXEOHVWUDQGHG51$ ELQGLQJ *2_UHFHSWRUDFWLYLW\ *2_SURWHLQELQGLQJ *2_JOXWDWKLRQHSHUR[LGDVHDFWLYLW\ *2_UHFHSWRUELQGLQJ *2_'1$ ELQGLQJ *2_XELTXLQROF\WRFKURPHFUHGXFWDVHDFWLYLW\ F'1$ ELQGLQJ51$ SRO\PHUDVH,,WUDQVFULSWLRQIDFWRUDFWLYLW\ _WUDQVIRUPLQJJURZWKIDFWRUEHWDDFWLYDWHGUHFHSWRUDFWLYLW\ *2_WUDQVPHPEUDQHVLJQDOLQJUHFHSWRUDFWLYLW\ _VHTXHQFHVSHFLILF'1$ ELQGLQJWUDQVFULSWLRQIDFWRUDFWLYLW\ *2_FKHPRNLQHUHFHSWRUELQGLQJ *2_UHFHSWRUELQGLQJ *2_SURWHLQKRPRGLPHUL]DWLRQDFWLYLW\ *2_0+&FODVV,,SURWHLQFRPSOH[ELQGLQJ *2 _VWUXFWXUDOFRQVWLWXHQWRIULERVRPH *2_FKHPRNLQHUHFHSWRUELQGLQJ *2_XELTXLQROF\WRFKURPHFUHGXFWDVHDFWLYLW\ *2_JOXWDWKLRQHSHUR[LGDVHDFWLYLW\ *2_GRXEOHVWUDQGHG51$ ELQGLQJ *2_$ 7'1$ ELQGLQJ *2_LGHQWLFDOSURWHLQELQGLQJ *2_UHFHSWRUDFWLYLW\ *2_PHWDOLRQELQGLQJ *2_'1$ ELQGLQJ *2_SURWHLQELQGLQJ 6SHFLILF'1$ ELQGLQJ51$ SRO\PHUDVH,,WUDQVFULSWLRQIDFWRUDFW LYLW\ *2_WUDQVPHPEUDQHVLJQDOLQJUHFHSWRUDFWLYLW\ _VHTXHQFHVSHFLILF'1$ ELQGLQJWUDQVFULSWLRQIDFWRUDFWLYLW \ _WUDQVIRUPLQJJURZWKIDFWRUEHWDDFWLYDWHGUHFHSWRUDFWLYL W\ SDWKKVD_5DSVLJQDOLQJSDWKZD\ SDWKKVD_+XQWLQJWRQ¶ VGLVHDVH SDWKKVD_3DUNLQVRQ¶ VGLVHDVH SDWKKVD_3,N$NWVLJQDOLQJSDWKZD\ SDWKKVD_DGUHQHUJLFVLJQDOLQJLQFDUGLRP\RF\WHV SDWKKVD_FKDJDVGLVHDVH$PHULFDQWU\SDQRVRPLDVLV SDWKKVD_1$)/' SDWKKVD_WUDQVFULSWLRQDOPLVUHJXODWLRQLQFDQFHU SDWKKVD_RVWHRFODVWGLI IHUHQWLDWLRQ SDWKKVD_0$3.VLJQDOLQJSDWKZD\ SDWKKVD_1)NDSSD%VLJQDOLQJSDWKZD\ SDWKKVD_WR[RSODVPRVLV SDWKKVD_UHJXODWLRQRIDFWLQF\WRVNHOHWRQ SDWKKVD_OHXNRF\WHWUDQVHQGRWKHOLDOPLJUDWLRQ SDWKKVD_0HDVOHV SDWKKVD_XELTXLWLQPHGLDWHGSURWHRO\VLV SDWKKVD_IRFDODGKHVLRQ SDWKKVD_SHUWXVVLV SDWKKVD_SURWHRJO\FDQVLQFDQFHU SDWKKVD_UDVVLJQDOLQJSDWKZD\ SDWKKVD_12'OLNHUHFHSWRUVLJQDOLQJSDWKZD\ SDWKKVD_DGUHQHUJLFVLJQDOLQJLQFDUGLRP\RF\WHV SDWKKVD_KHPDWRSRLHWLFFHOOOLQHDJH SDWKKVD_SHUWXVVLV SDWKKVD_12'OLNHUHFHSWRUVLJQDOLQJSDWKZD\ SDWKKVD_XELTXLWLQPHGLDWHGSURWHRO\VLV SDWKKVD_1$)/' SDWKKVD_UDVVLJQDOLQJSDWKZD\ SDWKKVD_PHDVOHV SDWKKVD_$O]KHLPHU ¶VGLVHDVH SDWKKVD_IRFDODGKHVLRQ SDWKKVD_WUDQVFULSWLRQDOPLVUHJXODWLRQLQFDQFHU SDWKKVD_RVWHRFODVWGLI IHUHQWLDWLRQ SDWKKVD_WR[RSODVPRVLV SDWKKVD_0$3.VLJQDOLQJSDWKZD\ SDWKKVD_3,.$NWVLJQDOLQJSDWKZD\ SDWKKVDUHJXODWLRQRIDFWLQF\WRVNHOHWRQ SDWKKVD_1)NDSSD%VLJQDOLQJSDWKZD\ SDWKKVD_OHXNRF\WHWUDQVHQGRWKHOLDOPLJUDWLRQ SDWKKVD_SURWHRJO\FDQVLQFDQFHU )XQFWLRQ
$
&
'
%
)XQFWLRQ (QULFKBVWDW (QULFKBVWDW Figure 2The top 200 and top 500
g
O and K
egg
annotations for the different lnc
rna
coexpression genes between the two groups of tumor tissues and M
ln s. Notes: The top 200 ( A ) and top 500 ( B ) g O annotations for the different lnc rna coexpression genes between the two groups. The x -axis shows the number of lnc rna s annotated, and the y -axis shows the g O annotations. The top 200 ( C
) and top 500 (
D
) K
egg
terms for the different lnc
rna
coexpression genes. The
x
-axis shows the number of lnc
rna
s annotated, and the
y
-axis shows the K
egg terms. Abbreviations: g O, g ene Ontology; K egg , Kyoto encyclopedia of g enes and g enomes; lnc rna , long noncoding rna ; M ln , metastatic lymph node; M hc , major histocompatibility complex; a T, autosomal; n OD, nucleotide oligomerization domain; na Fl
D, nonalcoholic fatty liver disease;
n
F, nuclear factor; P13K, phosphoinositide 3-kinase; M
a
PK, mitogen-activated protein kinase.
OncoTargets and Therapy downloaded from https://www.dovepress.com/ by 118.70.13.36 on 26-Aug-2020
Dovepress Metastatic pathogenesis of crc
ENST00000430471 promotes s-phase
arrest and inhibits apoptosis
To determine whether the effects of ENST00000430471 on the proliferation of CRC cells were mediated by changing the cell cycle progression, we followed cell cycle progression in HCT116 cells with flow cytometry. After treatment with pCDNA–ENST00000430471 or empty vector for 48 hours, the results demonstrated that pCDNA–ENST00000430471 led to a significant accumulation of cells at the S-phase (P,0.05; Figure 5C). Next, we investigated the effects of overexpression of ENST00000430471 on apoptosis. As shown, the percentages of apoptotic cells were significantly decreased in the pCDNA–ENST00000430471 group com-pared to the control group (P,0.05; Figure 5D). These results suggest that ENST00000430471 treatment could induce S-phase arrest and diminish CRC cell apoptosis.
effect of ENST00000430471 on migration
and invasion
In order to examine whether ENST00000430471 has a role in regulating CRC cell migration and invasion, we evalu-ated HCT116 cell invasion through Matrigel and migration through transwell. The results showed that upregulation of
ENST00000430471 significantly promoted the migration of
HCT116 cells compared with that of the control. Similarly, invasion of HCT116 cells was increased following over-expression of ENST00000430471 (Figure 5E).These data indicate that ENST00000430471 could promote migration and invasion of colon cancer cells.
Discussion
Despite recent studies have shown the critical roles of lncRNA on tumorigenesis in different kinds of cancers, few lncRNAs have been characterized in lymph node metastasis of CRC.17–19 In this study, we first assessed genome-wide
lncRNA microarray expression patterns in CRC tumor tissues compared with paired MLNs and explored their possible functions. We found that 390 lncRNA and 508 mRNA transcripts are dysregulated. A novel lncRNA
ENST00000430471, which was upregulated in MLNs, was
chosen for further study.
At present, only a small part of known lncRNAs have functional annotations, so we predict the lncRNA func-tions based on coexpression gene GO and KEGG pathway annotations in this study. As shown in Figure 2, the top predicted pathways of these lncRNAs were TGF-β-activated receptor activity, transcriptional misregulation in cancer, DNA binding TF activity, and MAPK signaling pathway,
Table 2 Top 20 enrichment Kegg terms of ENST00000430471
Term P-value Pathway
path:hsa04261 0.000115429 adrenergic signaling in cardiomyocytes path:hsa04010 0.000166191 MaPK signaling pathway
path:hsa04810 0.000170216 regulation of actin cytoskeleton path:hsa05200 0.000227779 Pathways in cancer
path:hsa04380 0.000230427 Osteoclast differentiation
path:hsa05202 0.000369415 Transcriptional misregulation in cancer path:hsa04510 0.000687107 Focal adhesion
path:hsa05205 0.000850753 Proteoglycans in cancer path:hsa05162 0.001568171 Measles
path:hsa04024 0.002840745 caMP signaling pathway path:hsa05414 0.003834431 Dilated cardiomyopathy
path:hsa04750 0.003843316 Inflammatory mediator regulation of TrP channels
path:hsa04014 0.004130068 ras signaling pathway path:hsa05222 0.004139032 small cell lung cancer path:hsa04120 0.004468168 Ubiquitin-mediated proteolysis path:hsa05410 0.005281147 hcM
path:hsa05133 0.00614867 Pertussis
path:hsa04921 0.006379835 Oxytocin signaling pathway path:hsa04145 0.006998006 Phagosome
path:hsa05134 0.008675511 legionellosis
Abbreviations: Kegg, Kyoto encyclopedia of genes and genomes; MaPK, mitogen-activated protein kinase; caMP, cyclic adenosine 3′,5′-monophosphate; TrP, transient receptor potential; hcM, hypertrophic cardiomyopathy.
Table 3 representative lncrnas and their cis-regulated genes
lncRNA PCC mRNA
uc001dbm.2 0.983455768 rOr1
ROR1 0.922404707 ZnF671
ROR1 0.843639152 ZnF814
ROR1 0.822512303 ZnF418
ENST00000429048 −0.864003773 arMcX3
ENST00000429048 −0.816859073 DrP2
AK022228 0.916156658 ZnF80
AK126261 −0.99043371 TBc1D8
HIT000389365 0.849861722 sTaU2
HIT000389365 −0.818489648 sTaU2
CN413083 0.951947071 Fcer1g
uc002odt.1 0.97754608 cliP3
AF308155 0.97778953 relB
BC031073 −0.863771219 eFcaB4B
uc003xjb.2 0.819161974 nrg1
AK024382 0.833577816 rhce
AK128058 −0.835535492 sec11c
nc-HOXD1-48– −0.957251502 hOXD9
nc-HOXD1-48– −0.948817424 hOXD9
nc-HOXD1-48– −0.889280685 hOXD11
nc-HOXD1-48– −0.884935986 hOXD11
nc-HOXD1-48– −0.874534069 MTX2
nc-HOXD1-48– −0.815439428 hOXD10
NR_024344 0.880490052 ThYn1
NR_024344 0.879098428 igsF9B
AK021444 0.828168114 POsTn
AK021606 0.864459707 TgFBr2
AK024173 0.897980516 ZMYnD17
AI655567 −0.877234886 sirPB1
Abbreviations: lncrna, long noncoding rna; Pcc, Pearson’s correlation coefficient.
OncoTargets and Therapy downloaded from https://www.dovepress.com/ by 118.70.13.36 on 26-Aug-2020
Dovepress Yang et al
Figure 3
The lnc
rna
–TF network consisting of the top 100 lnc
rna
–TF pairs.
Notes:
The blue solid squares represent TFs, and the red arrowheads represent lnc
rna
s; the edges between them mean that the lnc
rna
s are potentially regulated by the TFs.
Abbreviations:
lnc
rna
, long noncoding
rna
; TF, transcription factor.
AF069137 ENST00000434246 ENST00000466577 G38733 ENST00000392497 ENST00000435487 ENST00000513791 ENST00000444087 ENST00000504888 ENST0000043870 2 ENST00000417131 ENST000004431223 ENST00000432563 ENST00000475395 ENST0000044271 6 uc003itk. 2 uc003js w. 1 BC017743 AK024173 uc003vci.2 AK025180 NR_024351 AL15742 8 AK021558 NR_027077 NR_024476 uc001pyz. 2 AK000998 AK096384 AK126261 AA234012 AF1 1301 1 BC040655 uc002awb. 1 NR_024344 SPI 1 BA TF TCF1 2 ENST0000039331 1 ENST00000399149 ENST00000424239 ENST00000433516 ENST00000444200 ENST00000425789 ENST00000406166 ENST00000458624 ENST0000044820 8 ENST00000462717 UC002btm. 2 ENST00000440689 ENST00000375867 ENST00000448942 ENST00000503758 ENST00000440633 ENST00000445099 ENST00000447552 ENST00000504509 ENST00000398202 NR_024046 AK022299 uc010fsr .1 CN413083 BC020897 BC107045 AK125443 ENST00000404582 ENST00000468716 ENST0000040031 1 ENST00000444039 EGR1 AK055966 BC017431 AL133090 AK098134 EBF 1 AF130085 GA TA 1 GABP A uc.50+ uc002xkh.2 AY 831680 AW 449673 nc-HOXB6-181+ AK091440 uc003adh. 2 uc004auu. 2 NR_028051 USF2 BC034700 CRB05514 uc001rpo.
1Ak022309 uc001dbm.2
uc002uaw .2 uc003rcq.1 AF086272 AF055018 BC031073 AK095971
OncoTargets and Therapy downloaded from https://www.dovepress.com/ by 118.70.13.36 on 26-Aug-2020
Dovepress Metastatic pathogenesis of crc
which correspond well with the pigenetic regulation role of lncRNAs.20 For example, reports have showed that MAPK
signaling pathway and TGF-β signaling pathway are related to cell proliferation, invasion, metastasis signaling pathways.21,22 ENST00000430471 was also associated with
MAPK signaling pathway and pathways in cancer, which displayed its potential pathogenesis of CRC.
In our study, cis-regulation and trans-regulation mecha-nisms were used to get additional information of dysregulated lncRNAs. In all, 104 lncRNAs were predicted to cis-regulate their nearby protein-coding genes, and the outstanding lncRNAs are listed in Table 3. The TF–lncRNA and TF– lncRNA–gene networks were constructed with the help of the “trans” analysis. The core TF–lncRNA–gene network (Figure S1) showed that TFs, including TCF12, SPI1, and EBF1, regulated lncRNA expression in CRC. TCF12 is reported to be associated with the occurrence of CRC metastasis by suppressing the expression of E-cadherin.23
The most relevant with ENST00000430471, USF2, is vital for the transcriptional activation of aspartyl (asparaginyl)
β-hydroxylase and its truncated homologue humbug.24
Interestingly, humbug over expression is positively associ-ated with tumor grade and inversely with survival in stage II colon cancers.25 Therefore, information of the cis and trans
analyses promoted to interpret lncRNA functions and the pathogenesis of CRC.
A novel lncRNA, ENST00000430471, the most upregu-lated lncRNA in MLNs compared with tumor tissues caught our attention among most of the uncharacterized lncRNAs. In our functional study, ENST00000430471 overexpression in HCT116 cells promoted cell prolif-eration and increased colony formation. The results of flow cytometry, ENST00000430471 overexpression, led to a significant S-phase arrest and a related decrease in apop-tosis, revealing that ENST00000430471 might impact the proliferation of CRC by influencing cell cycle progression and apoptosis. Additionally, transwell assay demonstrated that ENST00000430471 promoted migration and invasion ability of colorectal cell, suggesting that ENST00000430471 may be involved in the metastasis of CRC. The effects of
ENST00000430471 on CRC cell laid a good foundation for
the next research of CRC with regulation mechanism.
Figure 4 qRT-PCR verification of the expression of ENST00000430471.
Notes: (A) The relative expression level of ENST00000430471 in crc tumor tissues, paired normal tissues, and corresponding Mlns. (B) The relative expression level of ENST00000430471 in colorectal cancer cell lines. (C) Transfected with pcDna–ENST00000430471 and empty vector. *P,0.05.
Abbreviations: qrT-Pcr, quantitative real-time polymerase chain reaction; crc, colorectal cancer; Mln, metastatic lymph node; gaPDh, glyceraldehyde 3-phosphate dehydrogenase.
&
5HODWLYHH[SUHVVLRQ
(PSW\ S&'1$
%
5HODWLYHH[SUHVVLRQ
6: +&7
6:
$
5HODWLYHH[SUHVVLRQ
QRUPDOL]HGWR*$3'+
1RUPDO 7XPRU 0/1
OncoTargets and Therapy downloaded from https://www.dovepress.com/ by 118.70.13.36 on 26-Aug-2020
Dovepress Yang et al
Figure 5 effects of ENST00000430471 on the crc cell in vitro.
Notes: (A) ccK-8 assay was performed to determine the proliferation of hcT116 cells. (B) colony-forming growth assays were performed to determine the proliferation of hcT116 cells. The colonies were counted and captured. (C) The bar chart represents the percentage of cells in g0/g1, s, and g2/M phases. (D) The percentage of apoptotic cells was determined by flow-cytometric analysis. Data represent the mean ± sD from three independent experiments. (E) Transwell assay showed that ENST00000430471 significantly promoted cell migration and invasion ability. *P,0.05.
Abbreviations: crc, colorectal cancer; ccK-8, cell counting Kit-8; OD, optical density; h, hours; Pi, propidium iodide.
$
(PSW\ SF'1$
,QYDVLRQ
0LJUDWLRQ
&HOOQXPEHU
,QYDVLRQ 0LJUDWLRQ
*DWH
** 6 *0
(PSW\
1XPEHU
&KDQQHOV)/$
SF'1$
1XPEHU
&KDQQHOV)/$
$SRSWRVLVSRUWLRQ
(PSW\ SF'1$
(PSW\
$9
$9
3,
SF'1$
3,
$9 $9
&&.2'
K
K K K 1XPEHURIFRORQLHV
(PSW\
SF'1$
(PSW\
SF'1$
%
&
'
(
(PSW\ SF'1$
$SRSWRVLV 'LS* 'LS* 'LS6 $SRSWRVLV
'LS* 'LS* 'LS6
(PSW\ SF'1$
(PSW\ SF'1$
OncoTargets and Therapy downloaded from https://www.dovepress.com/ by 118.70.13.36 on 26-Aug-2020
Dovepress Metastatic pathogenesis of crc
Tumor cells usually transfer from the primary tumor to the lymph nodes. To determine whether certain lncRNA would be involved in the lymph node metastasis of CRC, we identified lncRNA–ENST00000430471 that was most upregulated in MLNs than the tumor tissues. Then we found that ENST00000430471 played a partial role in the progress of metastasis of HCT116 cells. However, more studies are needed to expand the sample size for clinical research and determine whether ENST00000430471 can serve as a new diagnostic biomarker and therapeutic target for lymph node metastasis of CRC.
Conclusion
We identified a group of aberrant lncRNAs in tumor tis-sues and MLNs from three CRC patients. The functional and biological processes of many lncRNAs in the patho-genesis of CRC were determined by cis-regulating and
trans-regulating based on the coexpression genes. Finally,
we concluded that ENST00000430471 might be a novel prognostic marker in CRC.
Acknowledgments
This study is supported by the Natural Science Foundation Project of Jiangsu Province (BK2012872) and the Science and Technology Projects, Health Department of Jiangsu Province (H201207).
Author contributions
P Yang and Z-Y He designed the research. Z-P Xu and T Chen performed the research and analyzed the data. P Yang and Z-P Xu wrote the paper. All authors contributed toward data analysis, drafting and critically revising the paper and agree to be accountable for all aspects of the work.
Disclosure
The authors report no conflicts of interest in this work.
References
1. Sostres C, Gargallo CJ, Lanas A. Aspirin, cyclooxygenase inhibition and colorectal cancer. World J Gastrointest Pharmacol Ther. 2014;5(1): 40–49.
2. Ung L, Lam AK, Morris DL, Chua TC. Tissue-based biomarkers pre-dicting outcomes in metastatic colorectal cancer: a review. Clin Transl Oncol. 2014;16(5):425–435.
3. Nicastri DG, Doucette JT, Godfrey TE, Hughes SJ. Is occult lymph node disease in colorectal cancer patients clinically significant? A review of the relevant literature. J Mol Diagn. 2007;9(5):563–571.
4. Jemal A, Siegel R, Ward E, Murray T, Xu J, Thun MJ. Cancer statistics, 2007. CA Cancer J Clin. 2007;57(1):43–66.
5. Batista PJ, Chang HY. Long noncoding RNAs: cellular address codes in development and disease. Cell. 2013;152(6):1298–1307.
6. Ponting CP, Oliver PL, Reik W. Evolution and functions of long noncoding RNAs. Cell. 2009;136(4):629–641.
7. Huang J, Zhou N, Watabe K, et al. Long non-coding RNA UCA1 pro-motes breast tumor growth by suppression of p27 (Kip1). Cell Death Dis. 2014;5:e1008.
8. Huarte M, Guttman M, Feldser D, et al. A large intergenic noncoding RNA induced by p53 mediates global gene repression in the p53 response. Cell. 2010;142(3):409–419.
9. Geisler S, Lojek L, Khalil AM, Baker KE, Coller J. Decapping of long noncoding RNAs regulates inducible genes. Mol Cell. 2012;45(3): 279–291.
10. Li D, Feng J, Wu T, et al. Long intergenic noncoding RNA HOTAIR is overexpressed and regulates PTEN methylation in laryngeal squamous cell carcinoma. Am J Pathol. 2013;182(1):64–70.
11. Han J, Rong LF, Shi CB, et al. Screening of lymph nodes metastasis associated lncRNAs in colorectal cancer patients. World J Gastroen-terol. 2014;20(25):8139–8150.
12. Liao Q, Liu C, Yuan X, et al. Large-scale prediction of long non-coding RNA functions in a coding-non-coding gene co-expression network. Nucleic Acids Res. 2011;39(9):3864–3878.
13. Guenzl PM, Barlow DP. Macro lncRNAs: a new layer of cis-regulatory information in the mammalian genome. RNA Biol. 2012;9(6): 731–741.
14. Guttman M, Amit I, Garber M, et al. Chromatin signature reveals over a thousand highly conserved large non-coding RNAs in mammals. Nature. 2009;458(7235):223–227.
15. Guttman M, Donaghey J, Carey BW, et al. lincRNAs act in the circuitry controlling pluripotency and differentiation. Nature. 2011;477(7364): 295–300.
16. Joung JG, Hwang KB, Nam JW, Kim SJ, Zhang BT. Discovery of microRNA-mRNA modules via population-based probabilistic learning. Bioinformatics. 2007;23(9):1141–1147.
17. Gupta RA, Shah N, Wang KC, et al. Long non-coding RNA HOTAIR reprograms chromatin state to promote cancer metastasis. Nature. 2010; 464(7291):1071–1076.
18. Tahira AC, Kubrusly MS, Faria MF, et al. Long noncoding intronic RNAs are differentially expressed in primary and metastatic pancreatic cancer. Mol Cancer. 2011;10:141.
19. Qiu MT, Hu JW, Yin R, Xu L. Long noncoding RNA: an emerging paradigm of cancer research. Tumour Biol. 2013;34(2):613–620. 20. Lee JT. Epigenetic regulation by long noncoding RNAs. Science. 2012;
338(6113):1435–1439.
21. Miyazono K. Transforming growth factor-beta signaling in epithelial-mesenchymal transition and progression of cancer. Proc Jpn Acad Ser B Phys Biol Sci. 2009;85(8):314–323.
22. Wang H, An H, Wang B, et al. miR-133a represses tumour growth and metastasis in colorectal cancer by targeting LIM and SH3 protein 1 and inhibiting the MAPK pathway. Eur J Cancer. 2013;49(18): 3924–3935.
23. Lee CC, Chen WS, Chen CC, et al. TCF12 protein functions as transcriptional repressor of E-cadherin, and its overexpression is cor-related with metastasis of colorectal cancer. J Biol Chem. 2012;287(4): 2798–2809.
24. Finotti A, Treves S, Zorzato F, Gambari R, Feriotto G. Upstream stimu-latory factors are involved in the P1 promoter directed transcription of the A beta H-J-J locus. BMC Mol Biol. 2008;9:110.
25. Wang J, de la Monte SM, Sabo E, et al. Prognostic value of humbug gene overexpression in stage II colon cancer. Hum Pathol. 2007;38(1): 17–25.
OncoTargets and Therapy downloaded from https://www.dovepress.com/ by 118.70.13.36 on 26-Aug-2020
Dovepress Yang et al
Supplementary materials
Positive
1
Color key
Column Z-score
–2 0 2
Tu
mor
1
Tu
mor
3
Tu
mor
2
Positive
2
Positive
3
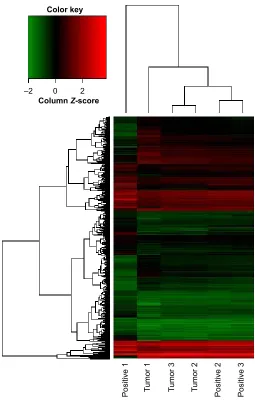
Figure S1 a heat map showing differentially expressed lncrnas from tumor tissues compared with Mlns.
Notes: each row represents one lncrna, and each column represents one sample. The relative lncrna expression is depicted according to the color scale. red indicates upregulation and green indicates downregulation.
Abbreviations: lncrna, long noncoding rna; Mln, metastatic lymph node.
OncoTargets and Therapy downloaded from https://www.dovepress.com/ by 118.70.13.36 on 26-Aug-2020
Dovepress Metastatic pathogenesis of crc
Figure S2
The lnc
rna
–TF–genes network map consisting of the top 1,500 relevant genes (green dots) based on the lnc
rna
–TF network.
Note:
The blue solid squares represent TFs, and the red arrowheads represent lnc
rna
s.
Abbreviations:
lnc
rna
, long noncoding
rna
; TF, transcription factor.
OncoTargets and Therapy downloaded from https://www.dovepress.com/ by 118.70.13.36 on 26-Aug-2020
OncoTargets and Therapy
Publish your work in this journal
Submit your manuscript here: http://www.dovepress.com/oncotargets-and-therapy-journal OncoTargets and Therapy is an international, peer-reviewed, open access journal focusing on the pathological basis of all cancers, potential targets for therapy and treatment protocols employed to improve the management of cancer patients. The journal also focuses on the impact of management programs and new therapeutic agents and protocols on
patient perspectives such as quality of life, adherence and satisfaction. The manuscript management system is completely online and includes a very quick and fair peer-review system, which is all easy to use. Visit http://www.dovepress.com/testimonials.php to read real quotes from published authors.
Dovepress
Dove
press
Yang et al
OncoTargets and Therapy downloaded from https://www.dovepress.com/ by 118.70.13.36 on 26-Aug-2020