VALIDATED RP-HPLC METHOD FOR SIMULTANEOUS DETERMINATION OF DROTAVERINE AND NIMESULIDE AND ITS APPLICATION IN DRUG
FORMULATION
Kuldeep Chouhan, Aparna Venugopal, Lucky Soni, Chanchal Raj, Sayyed Nadeem and Navin Raj*
Technocrats Institute of Technology-Pharmacy, Bhopal, Madhya Pradesh, India
*Corresponding author
Navin Raj, Technocrats Institute of Technology Pharmacy,
Bhopal- 462 001 (M.P.), India, Tel: +91-755-2684535; Fax: +91-0755-2751679 e-mail:- [email protected] (N.Raj)
Summary
A rapid, sensitive and specific RP-HPLC method involving UV detection was developed and validated for determination and quantification of Drotaverine and Nimesulide . Chromatography was carried out on a Phenomenex – Luna, C8 (250 x 4.6 mm i.d.,5µ) column. using filtered and degassed mixture of methanol:water(70:30)as mobile phase at a flow rate of 1.0 ml/min and effluent was monitored at 229.5nm. The method was validated in terms of linearity, precision, accuracy and specificity. The assay was linear over the concentration range of 10.0-30.0 mcg/ml and 12.5-75.0 mcg/ml for Drotaverine and Nimesulide respectively. Accuracy of the method was determined through recovery studies by adding known quantities of standard drug to the pre analyzed test solution and was found to be 98.54-99.87% and 98.22%-98.29% for Drotaverine and Nimesulide respectively. The method requires less than 10 minutes as run time for analysis which prove the adoptability of the method for the routine quality control of the drug.
Keywords: Drotaverine, Nimesulide, Method development, Validation.
Introduction
Fig 1(a) Chemical structure of Drotaverine(DRO)
(1Z)-1-[(3,4-diethoxyphenyl)methylidene]-6,7-diethoxy-1,2,3,4-tetrahydroisoquinoline
Fig.1 (b) Chemical structure of Nimesulide (NIMS)
{N-(4-Nitro-2-phenoxyphenyl)methanesulfonamide}
Many analytical methods like simultaneous estimation of Drotaverine and Nimesulide by spectrophotometric quantitative estimation [5], second order UV spectrophotometry of Nimesulide [6], Q analysis and first order derivative methods [7-8], stability indicating RP-HPLC [9] and other methods were reported for determination of DRO and NIMS alone or in combination with other analgesic and antispasmodic drugs [10-15]. Analytical method by RP-HPLC has been reported for the combination but due to the use of expensive chemicals the method was costly [16].
Materials and methods
Chemicals and reagents
All experiments were performed with pharmaceutical-grade DRO and NIMS. HPLC-grade solvents were employed for analysis. Solvents were filtered through 0.45 µm membrane filters. All dilutions were performed in standard volumetric flasks. The pharmaceutical preparations, declaring to contain 40 mg DRO, 100mg NIMS and excipients were obtained from a local drugstore.
Instrumentation and chromatographic conditions
The separations were performed with a Schimadzu R 1100 series liquid chromatograph consisting of quaternary pumps, a injector fitted with a 20 µl loop .Compounds were separated on a 250 mm×4.6 mm C8 column (Luna, Phenomenex, 5µm particle size). The mobile phase was a 70:30v/v methanol: water pumped at a flow rate of 1.0 ml min−1. Chromatograms were recorded employing lab solutions software.
Preparation of stock and working standard solutions
The stock solution of DRO (1.0 mg ml−1) was prepared in a 50.0 ml volumetric flask by dissolving an accurately weighed amount (50.0 mg) of DRO in methanol. The stock solution of NIMS (1.0 mg ml−1) was prepared in a 100 ml volumetric flask by dissolving in methanol 100.0 mg of accurately weighed NIMS. The solutions, which proved to be stable for a period of 3 months, were conserved at 4◦C, in light-resistant containers and were left to attain room temperature before use. Solutions containing mixtures of DRO and NIMS were prepared by dilution of appropriate volumes of the working solutions in methanol. All the solutions were protected from light throughout the experiments.
Sample preparation
Results and discussion
Selection of the mobile phase composition
After a series of screening experiments, it was observed those mixtures of met produced satisfactory separations, the addition of methanol: water (70:30) being useful for improving peak shapes. The retention times of DRO and NIMS were 7.709 and 2.269 min, respectively, as shown in the typical chromatogram of Fig. 3.
Fig no.3 Chromatogram for Drotaverine and Nimesulide
Method validation
Linearity
Fig-4 Linearity calibration curve of DRO
Fig-5 Linearity calibration curve of NIMS
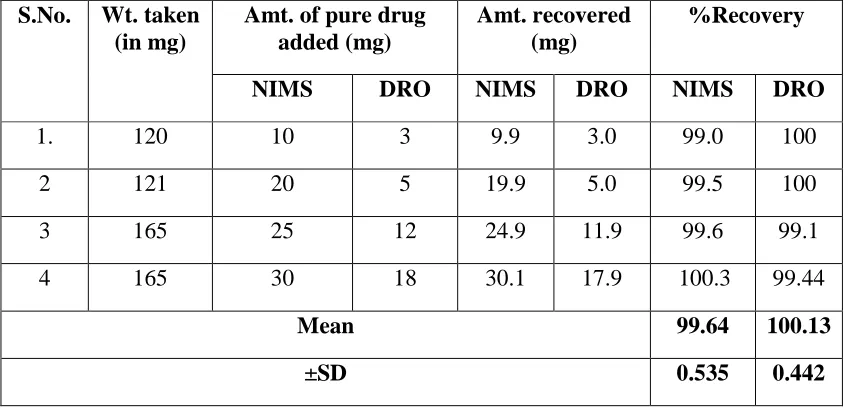
Accuracy
Table-1: Analysis of tablet containing Drotaverine and Nimesulide
Amt. of pure drug added (mg)
Amt. recovered (mg)
%Recovery S.No. Wt. taken
(in mg)
NIMS DRO NIMS DRO NIMS DRO
1. 120 10 3 9.9 3.0 99.0 100
2 121 20 5 19.9 5.0 99.5 100
3 165 25 12 24.9 11.9 99.6 99.1
4 165 30 18 30.1 17.9 100.3 99.44
Mean 99.64 100.13
±SD 0.535 0.442
Precision
Precision was evaluated at the repeatability and intermediate precision levels. Repeatability was studied by the determination of system precision for six replicate injections of the mixed standard solutions in groups of three, at three different levels .In inter-day precision same standard was injected on different system and the found ±SD were 0.07 and 1.32
for Nimesulide and Drotaverine respectively. The results were depicted in Table no.2.
Table 2: Results for interday and intraday studies
INTERDAY INTRADAY
Mean DRO NIMS DRO NIMS
±SD 1.32 0.07 0.09 0.79
System suitability
Table 3: Results for system suitability parameters
DRO NIMS
%RSD 1.60 1.48
Retention time 7.70 2.29
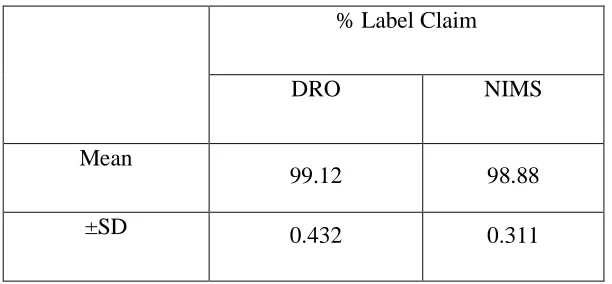
Assay of pharmaceutical tablet
The validated HPLC method was used for the simultaneous determination of DRO and NIMS in their combined dosage form. Five samples of each brand were weighed separately and analyzed. The results, expressed as percentage drug recovery related to label claim.These indicate that the amounts of each drug in the tablet of both brands are within the USP requirements of 90–110% of the corresponding label claims. The results were shown in Table 4.
Table 4: Results for Assay of pharmaceutical tablet brand
% Label Claim
DRO NIMS
Mean
99.12 98.88
±SD 0.432 0.311
Conclusion
A simple and efficient HPLC method has been developed and validated for the isocratic separation and simultaneous determination of Drotaverine and Nimesulide in their combined dosage form. The method, suitable for routine quality control, has been successfully applied to the determination of both analytes in their commercial brand of tablet containing this pharmacological association. From the results it was evident that method is more precise,accurate and inexpensive from the previously reported methods.
The authors are thankful to the Management and Director Dr.A.Balasubramaniam for providing necessary facilities.
References
[1]The Merck Index, 13th edition, Merck Research Laboratories, 609: 1174
[2]Singh KC, Jain P, Goel N, Saxena A.Drotaverine hydrochloride for augmentation of labor. Int J Gynecol Obstet 2004; 84 (1): 17–22.
[3]British Pharmacopoeia, Vol-I, 2002:1215.
[4] Rainsford KD and Members of the Consensus Report Group on Nimesulide. Nimesulide, a multifactorial approach to inflammation and pain, scientific and clinical consensus.
Curr Med Res. Opin 2006; 22 (6):1161-1170.
[5] Prasad RK, Sharma R. Spectrophotometric Quantitative Estimation and Validation of Nimesulide and Drotaverine Hydrochloride in Tablet Dosage form. Indian J Pharm Sci 2010; 2(1):67-70.
[6] Altinöz, Durson OO. Determination of Nimesulide in pharmaceutical dosage forms by Second order derivative UV spectrophotometry. J Pharm Biomed Anal 2000; 22(1):175-182. [7] Mahaparale S, Telekone R, Raut R, Danle S, Kasture P. Spectrophotometric determination of drotavrine hydrochloride and paracetamol in tablet dosage form. Indian J Pharm Sci 2010; 72(1):133-136.
[8] Vivek SR, SantoshVG, Upasna PP, Mahima RS. Simultaneous estimation of Drotaverine hydrochloride and acelofenac in tablet dosage form by spectrophoyometry. Eurasian J Anal 2010; 4(2):184-190.
[9] Kabeer AS, Sachin DP.Stability-indicating RP-HPLC for simultaneous determination of Drotaverinehydrochloride, domperidone and paracetamol in pharmaceutical dosage form. Der Pharmacia Lettre 2010; 2(4):355-364.
[10] Pathade A, Dakhore A, Fule S, Alaspure R.Validated RP-HPLC method for simultaneous determination of Drotaverine hydrochloride and paracetamol in tablet dosage form. Int J Pharm Sci 2010; 3(1):115-117
[11] Gandhi S, Deshpande P, Ramjane V, Parab J.Simultaneous estimation and validation of Drotaverine hydrochloride and acelofenac in tablet dosage form using RP-HPLC. Int J Pharm Pharm2010; 4(3):49-52.
[12] Permanand DC, Senthikumar KL, Senthikumar B, Thirumrty R.Simultaneous estimation and validation of Drotaverine hydrochloride and mefenamic acid in tablet dosage form using RP-HPLC. Der PharmaChemica 2010;2(5):170-177.
[13] GhargeD, Dhabale P.Simultaneous determination of Nimesulide and paracetamol for tablet dosage form by RP-HPLC method. Int J Pharm Tech Res 2010; 2(2):1330-1333.
[14] Sunil RD, Janaki VS and Vidhya KB. Simultaneous determination of Levocetirizine
hydrochloride and Nimesulide in formulation by RP-HPLC method. Pharmacieglobale International Journal of Comprehensive Pharmacy 2011; 2(2):1-4.
[15] Shingare MS, Naidu KR, Kale UN.RP-HPLC Method for simultaneous estimation of TizanidineHCl and Nimesulide in Tablets. Indian J Pharm Sci 2003; 65(3):315-318.
[16] Prasad KR, and Sharma R. Simultaneous estimation and validation of Drotaverine