Software Defect Prediction Using AWEIG+ADACOST Bayesian Algorithm
for Handling High Dimensional Data and Class Imbalanced Problem
Joko Suntoroa, Febrian Wahyu Christantob, Henny Indriyawatic,
a Faculty of Technology Information and Communication, Universitas Semarang, Indonesia b Faculty of Technology Information and Communication, Universitas Semarang, Indonesia c Faculty of Technology Information and Communication, Universitas Semarang, Indonesia
Corresponding authors
e-mail addresses : [email protected], [email protected], [email protected]
1.
Introduction
1.1. Research Background
The most important part in software engineering is a software defect prediction [1]. Software defect prediction is defined as a software prediction process from errors, failures, and system errors [2]. Users will be harmed in terms of time and cost if they have built a defective software. In one year the costs incurred due to software defects reached $ 60 billion [3].
Machine learning methods are used by researchers to predict software defects [4] including estimation, association, classification, clustering, and datasets analysis. Of these methods, the classification method is widely used by researchers [5]. The types of classification methods used are Decision Tree [6][7][8], Neural Network [9][10], Naïve Bayes [11] [12], and K-Nearest Neighbor [13]. Software metric is data that can be used to detect software that has
software defects [14] based on coupling, inheritance, cohesion, complexity, dan size [15]. Datasets of NASA Metrics Data Program (NASA MDP) is one of the metric software that researchers use to predict software defects [16][6]. NASA MDP datasets have been used around 62 researches on the topic of predicting software defects [17]. In NASA MDP datasets, the software that has been measured defect grouped into the class of defect-prone, while software that has no defects goes inside into non-defect prone.
NASA MDP datasets contain class imbalanced [18] and high dimensional data [19], so it will affect the classification evaluation results to be low. Data with class imbalanced is defined by the amount of data in certain classes more than other classes. Amount of data in class non-defect prone on the NASA MDP dataset more than the amount of data in the class defect-prone. Whereas high
Abstract : The most important part in software engineering is a software defect prediction. Software defect prediction is defined as a software prediction process from errors, failures, and system errors. Machine learning methods are used by researchers to predict software defects including estimation, association, classification, clustering, and datasets analysis. Datasets of NASA Metrics Data Program (NASA MDP) is one of the metric software that researchers use to predict software defects. NASA MDP datasets contain class imbalanced and high dimensional data, so they will affect the classification evaluation results to be low. In this research, data with class imbalanced will be solved by the AdaCost method and high dimensional data will be handled with the Average Weight Information Gain (AWEIG) method, while the classification method that will be used is the Naïve Bayes algorithm. The proposed method is named AWEIG + AdaCost Bayesian. In this experiment, the AWEIG + AdaCost Bayesian algorithm is compared to the Naïve Bayes algorithm. The results showed the mean of Area Under the Curve (AUC) algorithm AWEIG + AdaCost Bayesian yields better than just a Naïve Bayes algorithm with respectively mean of AUC values are 0.752 and 0.696.
International Journal of Information Technology and Business
http://ejournal.uksw.edu/ijiteb Keywords : Software Defect Prediction, Class Imbalanced, High Dimensional Data IJITEB Vol. 1 No. 1 2018
dimensional data is interpreted as NASA MDP datasets have very many attributes.
Several methods that have been used by previous researchers to handle data with class imbalanced are divided into 3 methods, that is data level method, algorithm level method, and ensemble method. [20][21]. In the data level method, data with class imbalanced will be balanced based on data distribution [22], the algorithm level method will be modified to the classification algorithm to strengthen learning in minority classes [23]. The ensemble method is a combination of data level methods and algorithm level methods [21].
Undersampling and oversampling methods are used by researchers to handle data with class imbalanced on data level methods. The majority class in the undersampling method will be deleted and balanced by a number of data on minority classes [24]. While the oversampling method will replace the data by making new data on the minority class so that the amount is equal with the data in the majority class [25].
Fuzzy SVM (FSVM) used to handle data containing data with class imbalanced [26] at the algorithm level method. FSVM apply membership value of Fuzzy. The membership value will be high in the sampling data that does not contain noise or outlier. While the data contains noise or outlier cause membership value will be of low value.
AdaCost algorithm included in the ensemble method. In the AdaCost algorithm, weighting strategies are used to increase the sample weight and decrease the weight of the error sample correctly classified until the distribution of weighted samples between misclassified samples and samples is correctly classified even at each iteration (looping).
High dimensional data on NASA MDP datasets are equipped with stream completion features. Feature selection method is divided into three techniques, that is filter, wrapper, and hybrid [27]. Filter techniques use relevance between attributes based on the intrinsic nature of the data [28], Wrapper techniques choose attributes based on classifier performance evaluations [29], while hybrid techniques combine filter techniques and wrapper techniques. Filter techniques are faster to use compared to wrapper and hybrid techniques, other than that filter techniques increase better and easier to implement than wrapper and hybrid techniques [30].
One of filter technique for selecting relevant attributes in NASA MDP datasets is Average Weight Information Gain (AWEIG) method [31]. Each attribute in the NASA MDP dataset is weighted by Weight Information Gain (WIG) algorithm, then the average value is calculated. The selected attribute is an attribute with a weight value above the average value.
In this study data with class imbalanced will be solved by AdaCost method and high-dimensional
data will be handled with Average Weight Information Gain (AWEIG) method. While the classification method that will be used is Naïve Bayes algorithm [17], Naïve Bayes algorithm produce the best evaluation results for prediction of software defects compared to other classification algorithms like C4.5, Decision Tree, Logistic Regression, dan Neural Network. The proposed method is named AWEIG+AdaCost Bayesian. 1.2. Research Background
Based on research background and research problems, the research question is how to improve the evaluation results on application of AWEIG+AdaCost Bayesian methods to handle data with class imbalanced and high dimensional data on prediction of software defects.
1.3. Research Background
The purpose of this research is to develop an AdaCost method for resolving data with class imbalanced and AWEIG method to resolve high dimensional data with Naïve Bayes classifier algorithm for prediction of software defects.
2.
Literature Review
2.1. Naïve Bayes AlgorithmNaïve Bayes is one of the most efficient and effective inductive learning algorithms for machine learning and data mining. The simplest form of Bayesian network. Naϊve Bayes is one of machine learning method that uses probability methods. The probability of membership can be predicted by classifiers and processes based on the Bayes theorem. Bayesian classifiers have also shown high accuracy and speed when applied to large databases. The equation of Naïve Bayes algorithm written as follows: ) ( ) ( ) | ( ) | ( X P H P H X P X H P (1) where :
P(H|X) = probability of hypothesis H based on conditions X
P(X|H) = probability of hypothesis X based on conditions H
P(H) = probability of hypothesis H 2.2. AdaCost Algorithm
AdaCost algorithm is a cost-sensitive boosting method to handle misclassification [32] where AdaCost is a variant of AdaBoost algorithm. AdaCost achieve cost sensitivity by weight manipulation of AdaBoost parameter. The weighting strategy is used to increase the sample weight and decrease the weight of the sample error correctly classified until the distribution of weighted samples between misclassified samples and samples is correctly classified even at each iteration (looping).
The equation of AdaCost algorithm written as follows:
) ( ) ( 1 x h x F t T t t
(2) where: ) (ht x
= basic or weak classifier
t
= level of learning )
(x
F = results, in the form of final classifiers or strong classifiers
2.3. Weight Information Gain Algorithm Weight Information Gain (WIG) is a method of weighting each of the most common variables of evaluation attributes [33]. To calculate information gain, first step are understand another rule called entropy. In the field of Information Theory, often uses entropy as a parameter to measure heterogeneity (diversity) of a collection of data samples. If the collection of sample data is increasingly heterogeneous, then the entropy value gets bigger. Mathematically, entropy is formulated as follows:
c i pi pi entropy 2 log (2)
where c is the number of values in the target attribute (number of classes). While stating the number of samples for class of i.
After getting the entropy value for a collection of data samples, the effectiveness of an attribute can be measured. This measure of effectiveness is called information gain. Mathematically, the information gain of an attribute A is written as follows:
) ( | | ( ) | | ) ( ) , ( A Value v S EntropySv v S S Entropy A S Gain (2)
where A is an attribute and V represents a possible value for attribute A, Value(A) Value (A) is the set of possible values for attribute A is the number of samples for value v, |S| total of data, and entropy(Sv) is entropy for samples that have a value of v.
2.4. Average Weight Information Gain
Algorithm
Weight Information Gain (WIG) algorithm used only to weight each variable or attribute. As for attribute selection is used Average Weight Information Gain (AWEIG). After the attributes are known for each weight, then the average value of each weighting attribute is calculated (Equation 5). The attribute chosen is the attribute that has a weight above the average value of the weight (ANAVG).
N N A A A A AVG 1 2 3 ... (2) where:
AVG = Average Weight Information Gain
N
A = attribute weight to-N
N = data to-N
3.
Proposed Methods
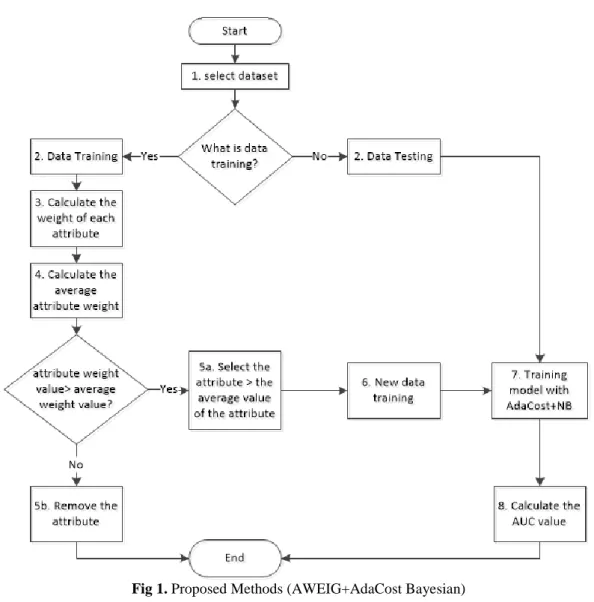
The NASA MDP dataset that is used for software defect prediction contains data with class imbalanced and high dimensional data. AdaCost method proposed for handling data with class imbalanced AWEIG method proposed for handling high dimensional data, then used Naïve Bayes algorithm as a classifier. The proposed method is named AWEIG+AdaCost Bayesian. Figure 1 show AWEIG+AdaCost Bayesian methods. Steps of AWEIG+AdaCost Bayesian methods are as follows: 1. Select one of the NASA MDP datasets containing
data with class imbalanced and high dimensional data.
2. The NASA MDP dataset is divided into two parts using the stratified sample method, 70% as training data and 30% as testing data.
3. Calculate the weight of each attribute in the training data with Weight Information Gain method.
4. Calculate the average attribute weight,.
5. Select an attribute with a weight value above the average value of the attribute weight. If the attribute weight is smaller than the average weight value, then the attribute is deleted, whereas if the attribute weight is greater than the average weight value, then the attribute is used as a new dataset.
6. A new dataset that has been selected features 7. Model training using data testing using AdaCost
based on Naïve Bayes algorithm.
8. Perform an evaluation by calculating the value of AUC.
The dataset used in this research is the NASA MDP dataset. NASA MDP datasets are used by researchers on the topic of predicting software defects. The dataset used are CM1, KC3, PC1, PC2, PC3, PC4, and PC5. NASA MDP Repository data specifications and attributes are shown on Table 1. The specifications of the NASA dataset attributes are divided into 4 parts, that are LOC count, halstead attribute, McCabe attribute, and miscellaneous attribute. LOC count is the number of lines of code and comments from the program. Halsted attribute is the operand calculation 32 and the operator in the program. McCabe Attribut is cyclomatic complexity in the program.
4.
Experimental Result
Experiments carried out using Microsfot Excel for Office 365, SPSS 16.0, and Rapidminer version 7.2.001. The computer specifications used in this study can be seen in Table 2.
In this research, AWEIG+AdaCost Bayesian algorithm will be compared with Naïve Bayes
standard algorithm (NB). Measurement of
classification evaluation results used is Area Under the Curve (AUC). AUC chosen because of clear statistical interpretation. Measurement of probability
in fault-prone class given a higher rating compared non-fault-prone class [33]. In addition AUC has the potential to significantly increase convergence throughout empirical experiments in the prediction of
software defects [34], because it separates predictive
performance from operating conditions and
represents the general size of the prediction.
Fig 1. Proposed Methods (AWEIG+AdaCost Bayesian) Table 1. NASA MDP Dataset Specifications and Descriptions Datasets Number of Attributes Number of Records Defects (%) Systems Language CM1 38 327 12,84 Spacecraft instrument C
KC3 40 194 18,56 Field data storage management JAVA
PC1 38 679 8,10 Satellite flight software C
PC2 37 722 2,22 Behavior control simulator C
PC3 38 1.053 12,35 Satellite flight software C
PC4 38 1.270 13,86 Satellite flight software C
PC5 39 1.694 27,04 Improved cockpit system security C++
Table 2. Computer Specifications Used
Processor Intel® Core ™ i5-6200 CPU @ 2.30GHz 2.40GHz
Memory 4 GB
Hardisk 1 TB
Operating System Windows 10 Pro 64-bit
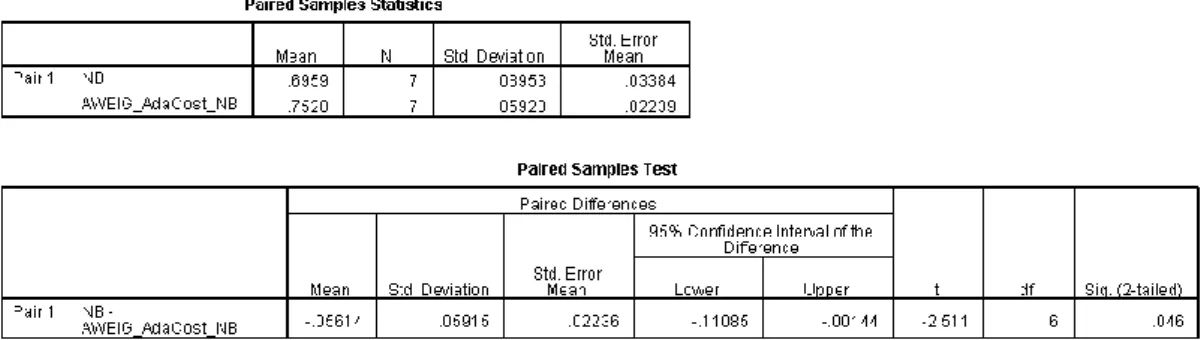
Paired T-Test used to find out if there are significant differences in calculations of AUC between two models. In Paired T-Test set value α as big as 0,05, if value of p-value bigger than value α then there is no significant difference between models. Whereas if the value p-value smaller than value α then there are significant differences between models.
Measurement results AUC in this experiment can be seen in Table 3 dan Figure 2. Measurement results of AUC recorded based on the results of an experiment in the dataset of CM1, KC3, PC1, PC2, PC3, PC4, dan PC5. Average value of AUC on AWEIG+AdaCost Bayesian algorithm better than Naïve Bayes algorithm, with an average value of AUC each is 0,752 and 0,696. The result of Paired T-Test also shows value of p-value is 0,04 (p-value smaller than value α), so it can be concluded that
there are significant differences between
AWEIG+AdaCost Bayesian algorithm dan Naïve Bayes algorithm. Result of Paired T-Test in this experiment can be seen in Figure 3.
Table 3. Measurement Results of AUC on AWEIG+AdaCost Bayesian algorithm and Naïve
Bayes No Dataset AWEIG+AdaCost Bayesian Naïve Bayes 1 CM1 0,800 0,743 2 KC3 0,653 0,646 3 PC1 0,738 0,588 4 PC2 0,715 0,587 5 PC3 0,774 0,759 6 PC4 0,835 0,817 7 PC5 0,749 0,731
Fig 2. Measurement Diagram AUC on AWEIG+AdaCost Bayesian algorithm and Naïve
Bayes
Fig 3. Result of Paired T-Test on AWEIG+AdaCost Bayesian algorithm and Naïve Bayes
5.
Conlusion
The results showed that AWEIG+AdaCost Bayesian algorithm better than Naïve Bayes algorithm with an average value of AUC are 0,752 and 0,696. Paired T-Test between AWEIG+AdaCost Bayesian algorithm and Naïve Bayes algorithm there are significant differences due to value of p-value (0,04) smaller than α (0,05) value. This research has contributed to the software defect prediction that is handling the problem of high dimensional data and data with class imbalanced. High dimension data is resolved by attribute weighting and attribute selection. The attribute selected is an attribute with a weight value greater than the average value of the attribute weight so that it can handle high dimensional data. While class imbalanced is solved by applying AdaCost method based on Naïve Bayes algorithm.
However, there are several methods that can be done in future research to get better results. The method used for selecting attributes in this study uses filter techniques, so that for future research can be applied wrapper techniques or hybrid techniques. For handling the class imbalanced, can be used another ensemble methods to get better evaluation result.
6.
References
[1] A. S. Andreou and S. P. Chatzis, “Software defect prediction
using doubly stochastic Poisson processes driven by stochastic belief networks,” J. Syst. Softw., vol. 122, pp. 72–82, 2016.
[2] M. J. Siers and Z. Islam, “Software defect prediction using a
cost sensitive decision forest and voting and a potential solution to the class imbalance problem,” Inf. Syst., pp. 1–10, 2015.
[3] J. D. Strate and P. A. Laplante, “A Literature Review of Research in Software Defect Reporting,” vol. 62, no. 2, pp. 444–454, 2013.
[4] R. S. Wahono, “A Systematic Literature Review of Software
Frameworks,” J. Softw. Eng., vol. 1, no. 1, pp. 1–16, 2015.
[5] R. S. Wahono, N. S. Herman, and S. Ahmad, “Neural network
parameter optimization based on genetic algorithm for software defect prediction,” Adv. Sci. Lett., vol. 20, no. 10–12, pp. 1951–1955, 2014.
[6] E. Arisholm, L. C. Briand, and E. B. Johannessen, “The
Journal of Systems and Software A systematic and comprehensive investigation of methods to build and evaluate fault prediction models,” J. Syst. Softw., vol. 83, no. 1, pp. 2–17, 2010.
[7] N. Gayatri, S. Nickolas, and A. V Reddy, “Feature Selection
Using Decision Tree Induction in Class level Metrics Dataset for Software Defect Predictions,” World Congr. Eng. Comput. Sci. Vols 1 2, vol. I, pp. 124–129, 2010.
[8] Z. Sun, Q. Song, and X. Zhu, “Using coding-based ensemble
learning to improve software defect prediction,” IEEE Trans. Syst. Man Cybern. Part C Appl. Rev., vol. 42, no. 6, pp. 1806–1817, 2012.
[9] B. J. Park, S. K. Oh, and W. Pedrycz, “The design of
polynomial function-based neural network predictors for detection of software defects,” Inf. Sci. (Ny)., vol. 229, pp. 40–57, 2013.
[10]P. Zhang and Y. Chang, “Software fault prediction based on
grey neural network,” 2012 8th Int. Conf. Nat. Comput., no. 201150, pp. 466–469, 2012.
[11]C. Catal and B. Diri, “Investigating the effect of dataset size,
metrics sets, and feature selection techniques on software fault prediction problem,” Inf. Sci. (Ny)., vol. 179, no. 8, pp. 1040–1058, 2009.
[12]Q. Song, Z. Jia, M. Shepperd, S. Ying, and J. Liu, “A General
Software Defect-Proneness Prediction Framework,” vol. 37, no. 3, pp. 356–370, 2011.
[13]B. Turhan, T. Menzies, A. B. Bener, and J. Di Stefano, “On
the relative value of cross-company and within-company data for defect prediction,” Empir. Softw. Eng., vol. 14, no. 5, pp. 540–578, 2009.
[14]Ö. F. Arar and K. Ayan, “Deriving thresholds of software metrics to predict faults on open source software: Replicated case studies,” Expert Syst. Appl., vol. 61, pp. 106–121, 2016.
[15]L. Kumar, S. Misra, and S. K. Rath, “An empirical analysis of
the effectiveness of software metrics and fault prediction model for identifying faulty classes,” Comput. Stand. Interfaces, vol. 53, pp. 1–32, 2017.
[16]G. Czibula, Z. Marian, and I. G. Czibula, “Software defect prediction using relational association rule mining,” Inf. Sci. (Ny)., vol. 264, pp. 260–278, 2014.
[17]T. Hall, S. Beecham, D. Bowes, D. Gray, and S. Counsell, “A
Systematic Literature Review on Fault Prediction
Performance in Software Engineering,” IEEE Trans. Softw. Eng., vol. 38, no. 6, pp. 1276–1304, Nov. 2012.
[18]K. Gao, T. Khoshgoftaar, and R. Wald, “Combining Feature
Selection and Ensemble Learning for Software Quality Estimation,” pp. 47–52, 2010.
[19]R. S. Wahono, N. Suryana, and S. Ahmad, “Metaheuristic
Optimization based Feature Selection for Software Defect Prediction,” J. Softw. Eng., vol. 9, no. 5, pp. 1324–1333, 2014.
[20]J. F. Díez-Pastor, J. J. Rodríguez, C. García-Osorio, and L. I.
Kuncheva, “Random Balance: Ensembles of variable priors classifiers for imbalanced data,” Knowledge-Based Syst., vol. 85, no. May, pp. 96–111, 2015.
[21]V. Lopez, A. Fernandez, J. G. Moreno-Torres, and F. Herrera,
“Analysis of preprocessing vs. cost-sensitive learning for imbalanced classification. Open problems on intrinsic data characteristics,” Expert Syst. Appl., vol. 39, no. 7, pp. 6585–6608, 2012.
[22]Y. Qian, Y. Liang, M. Li, G. Feng, and X. Shi, “A resampling
ensemble algorithm for classification of imbalance problems,” Neurocomputing, vol. 143, pp. 57–67, 2014.
[23]G. Haixiang, L. Yijing, L. Yanan, L. Xiao, and L. Jinling, “BPSO-Adaboost-KNN ensemble learning algorithm for multi-class imbalanced data classification,” Eng. Appl. Artif. Intell., pp. 1–18, 2015.
[24]R. Batuwita and V. Palade, “Efficient resampling methods for
training support vector machines with imbalanced datasets,” Neural Networks (IJCNN), 2010 …, 2010.
[25]L. Obermann and S. Waack, “Demonstrating non-inferiority
of easy interpretable methods for insolvency prediction,” Expert Syst. Appl., vol. 42, no. 23, pp. 9117–9128, 2015.
[26]C.-F. Lin and S.-D. Wang, “Fuzzy support vector machines,”
Neural Networks, IEEE Trans., vol. 13, no. 2, pp. 464–471, 2002.
[27]G. Chen and J. Chen, “A novel wrapper method for feature selection and its applications,” Neurocomputing, vol. 159, no. 1, pp. 219–226, 2015.
[28]X. Sun, Y. Liu, M. Xu, H. Chen, J. Han, and K. Wang,
“Feature selection using dynamic weights for classification,” Knowledge-Based Syst., vol. 37, pp. 541–549, 2013. [29]P. Hajek and K. Michalak, “Feature selection in corporate
credit rating prediction,” Knowledge-Based Syst., vol. 51, pp. 72–84, 2013.
[30]V. Bolón-Canedo, I. Porto-Díaz, N. Sánchez-Maroño, and A.
Alonso-Betanzos, “A framework for cost-based feature selection,” Pattern Recognit., vol. 47, no. 7, pp. 2481–2489, 2014.
[31]J. Suntoro and C. N. Indah, “Average Weight Information
Gain Untuk Menangani Data Berdimensi,” J. Buana Inform., vol. 8, pp. 131–140, 2017.
[32]D. J. Yu, J. Hu, Z. M. Tang, H. Bin Shen, J. Yang, and J. Y.
Yang, “Improving protein-ATP binding residues prediction by
boosting SVMs with random under-sampling,”
Neurocomputing, vol. 104, pp. 180–190, 2013.
[33]R. S. Wahono and N. S. Herman, “Genetic Feature Selection
for Software Defect Prediction,” Adv. Sci. Lett., vol. 20, no. 1, pp. 239–244, Jan. 2014.
[34]S. Lessmann, B. Baesens, C. Mues, and S. Pietsch,
“Benchmarking Classification Models for Software Defect Prediction: A Proposed Framework and Novel Findings,” IEEE Trans. Softw. Eng., vol. 34, no. 4, pp. 485–496, Jul. 2008.Balahur, A., B., Steinberger, R., v. d. Goot, E., Pouliquen, B, & Kabadjov. M. (2009). Opinion Mining on Newspaper Quotations, Proceeding of Int. Joint Conference on Web Intelligence and Intelligent Agent Technology, 3, 523-526.