1
School Inputs and Learning Outcomes in
Mozambique
A quantitative analysis
By: Lina Maria Beltran E.
Research report submitted to the School of Education, Faculty of
Humanities, University of the Witwatersrand in partial fulfillment of
the requirements for the degree of Master of Education
(Policy, Planning and Management)
In the
School of Education University of the Witwatersrand
Supervisor: Helen Perry
2
ABSTRACT
Quality education has been a major challenge, especially in the least developed countries where resources are limited and expansion of educational services has hindered the quality agenda. This research aims to identify which inputs and external interventions have the most significant effect on learning outcomes in the first cycle of Primary Education in Mozambique. A quantitative analysis was carried out in 1167 schools, including government schools with interventions supported by five international or local non-government organizations and a control group of government schools receiving no additional support. The findings of the linear regressions for each of the sample groups point towards text books being the school input with the most meaningful impact on pass rates regardless of the intervention (or lack of it), while teaching/learning in local languages to be the intervention yielding the most meaningful results.
3
DECLARATION
I, Lina Maria Beltran E., do declare that this dissertation is my own unaided work. It is being submitted for the degree of Masters of Education (Policy Planning and Management) at the University of Witwatersrand, in Johannesburg. It has not been submitted for any degree or examination at any other university.
18th March 2013
4
ACKNOWLEDGEMENTS
I would like to thank the Ministry of Education of Mozambique for their openness and will to learn more about their own system. Thanks to Dr. Antuia Soverano, Dr. Abel Azis at the Ministry and Dr. Ana Passos from INDE whose insights at the very beginning helped to draw the path of this research. Thanks to the Directorate of Planning and Cooperation (DIPLAC) and more specifically to its Director, Manuel Rego for opening the doors to their database and encouraging others to “play” with their numbers. Special thanks go to Mr. Ilidio Buduia in DIPLAC, for his time to share his knowledge and his patience to clarify the numerous questions that arose throughout the process.
I would like to thank, the Aga Khan Foundation, Concern, Progresso, UNICEF and WFP in Mozambique for sharing information on their programmes and providing the list of schools and districts where their interventions are being implemented.
Thanks to Angela Arnott and Alberto Musatti who took the time to read the initial drafts of the research proposal and provided very useful comments as well as additional documents that proved very helpful along the way.
Of course, Helen Perry, for our initial discussions in Maputo brainstorming on the way this research could be shaped, for our long hours in Johannesburg in front of the data, for her patience throughout the process, her constructive criticism and for keeping me calm in my moments of panic.
Last but not least, I would like to thank my family; my parents and sisters for helping shape the person I am today. Igor for believing in me more than myself, for his unconditional support and for being the best partner I could have dreamed of. Thanks to Maia, for bringing joy to my life and lifting my spirit with every smile throughout this process and for all the afternoons I did not get to spend with you. And finally thanks to Greta, who still in the belly, has been literally bearing the weight of the workload as I write the final words of this research report. I love you all very much.
5 TABLE OF CONTENTS List of Figures ... 6 List of Tables ... 6 Abbreviations ... 8 Background ... 9
Aim and Rationale ... 12
Research Question ... 13
Literature Review... 15
Methodology ... 23
Limitations of the research ... 33
Findings... 38
Pass Rates against variables ... 40
Changes over time? ... 50
Correlations ... 57
Regressions and specific findings by intervention... 60
Overview of regressions ... 74
Conclusions ... 78
6
List of Figures
Figure 1 Structure of Primary Education and its Examinations... 34
Figure 2 Levels and Classifications for Test Scores ... 35
Figure 3 SACMEQ Ranking vs. Research Ranking by Province ... 55
Figure 4 Overall correlations by factor against Pass Rates in Grade 5 ... 57
List of Tables
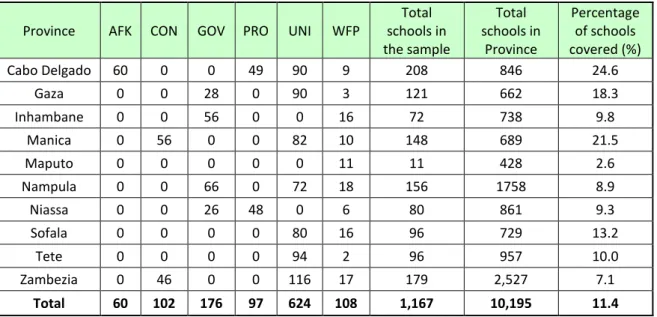
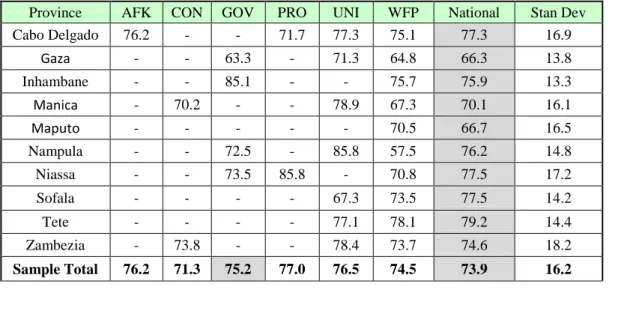
Table 1 Number of Schools by Province and Intervention ... 39Table 2 Pass Rates by Province and Intervention ... 40
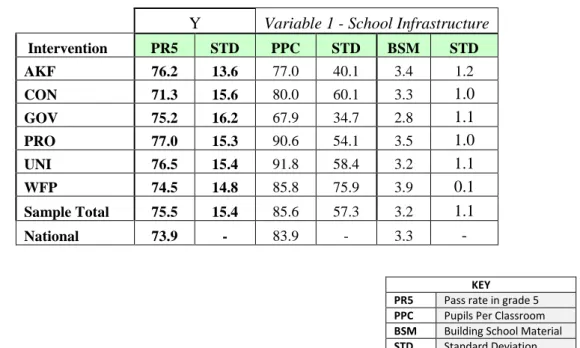
Table 3 Pass Rates by Intervention against factors in Variable 1: School Infrastructure ... 42
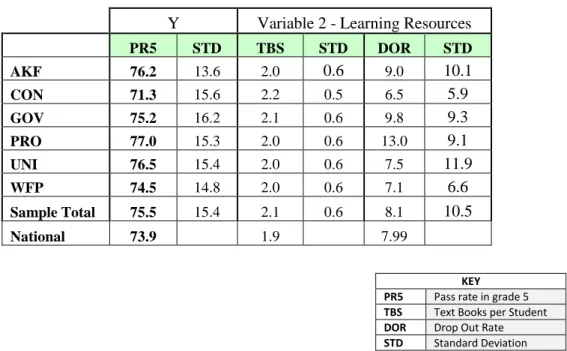
Table 4 Pass Rates by Intervention against factors in Variable 2: Learning Resources ... 44
Table 5 Pass Rates by Intervention against factors in Variable 3: Human Resources 46 Table 6 Pass Rates by Intervention against factors in Variable 4: Socio-Economic Conditions ... 49
Table 7 Change in Student Enrolments, Drop Out Rates and Pass Rates between 2004 and 2010 by Intervention ... 51
Table 8 Changes by factor between 2004 and 2010 ... 52
Table 9 Summary of Pass Rates against all factors by Province (including only schools in the researach sample) ... 53
7
Table 11 AKF changes between 2004 and 2010 ... 60 Table 12 AKF- Correlations of changes over time against Pass Rates in Grade 5 and Percentage Change in Enrolments ... 61 Table 13 AKF Regression Summary Output ... 61 Table 14 CON Changes between 2004 and 2010 ... 63 Table 15 CON - Correlations of changes over time against Pass Rates in Grade 5 and Percentage Change in Enrolments ... 63 Table 16 CON Regression Summary Output ... 64 Table 17 GOV changes between 2004 and 2010 ... 65 Table 18 GOV Correlations of changes over time against Pass Rates in Grade 5 and Percentage Change in Enrolments ... 66 Table 19 GOV Regression Summary Output ... 66 Table 20 PRO changes between 2004 and 2010 ... 67 Table 21 PRO Correlations of changes over time against Pass Rates in Grade 5 and Percentage Change in Enrolments ... 68 Table 22 PRO Regression Summary Output ... 68 Table 23 UNI changes between 2004 and 2010 ... 69 Table 24 UNI Correlations of changes over time against Pass Rates in Grade 5 and Percentage Change in Enrolments ... 70 Table 25 UNI Regression Summary Output ... 70 Table 26 WFP changes between 2004 and 2010 ... 72 Table 27 WFP Correlations of changes over time against Pass Rates in Grade 5 and Percentage Change in Enrolments ... 73 Table 28 WFP Regression Summary Output ... 73 Table 29 Research Sample Regression Summary Output (all Interventions and Control Group) ... 76
8
Abbreviations
ADE Direct Support to Schools (Apoio Directo as Escolas)
AKF Aga Khan Foundation
BSM Building School Material
CIP Centre of Public Integrity (Centro de Integridade Publica)
CON Concern Worldwide NGO
DLR District Literacy Rate
DOR Drop-Out Rate
ECD Early Childhood Development
EFA Education For All
EMIS Education Management Information System
EP1 Primary School Level 1
EP2 Primary School Level 2
EPC Complete Primary School
FASE Education Sector Support Fund
GER Gross Enrolment Rate
GoM Government of Mozambique
GOV Government
HAS House Assets
HHE House Hold Electricity
HHW House Hold Water
HOM Housing Materials
INDE National Institute for Educational Development
INE National Institute of Statistics (Instituto Nacional de Estadisticas)
MICS Multiple Indicator Cluster Survey
MINED Ministry of Education
NGO Non Government Organisation
PET Public Expenditure Tracking
PMC Percentage of Multi-level Classrooms
PPC Pupils per Classroom
PRO Progresso NGO
PR5 Pass Rate in Grade 5
PTR Pupil : Teacher Ration
SACMEQ Southern African Consortium for Monitoring Educational Quality
TBS Text Books per Student
TQS Teacher Qualification Score
UIS UNESCO Institute for Statistics
UNDP United Nations Development Programme
UNESCO United Nations Educational Scientific and Cultural Organisation
UNICEF United Nations’ Children Fund WFP World Food Programme
9
Background
The Millennium Development Goals have been pivotal in guiding the human development agenda including education in developing countries for the past decade (UN 2012). Governments all around the world committed and focused on expanding access to educational services in order to achieve universal primary education. Policies such as free compulsory primary schooling became common and school systems expanded rapidly. The quality trade-off of expanding primary education has been high and many countries have seen their learning outcomes lag behind with students failing to progress through primary education as the enrolments have increased (ECOSOC 2011).
Mozambique is not an exception. In the period between 1992 (immediately after the end of the civil war) and 2003 the gross enrolment rates (GER) in 1st grade grew from 59% to 123% and the GER for the first cycle of primary education (grades 1 to 5) increased from 60% to 112.7% (World Bank 2005). The number of schools went from 2,800 to over 8,000 (World Bank 2005). Nevertheless, quality and internal efficiency indicators do not show the same pattern. Quality concerns were at the centre of discussion brought to the table in Dakar in 2000 for which the international commitment to achieve Quality Education for All was taken as a key point in the Educational agenda worldwide (UNESCO 2000). Ten years down the road, quality still remains a concern for both rich and poor countries (Education For All (EFA) Global Monitoring Report 2010)
Despite Mozambique having net enrolment rates for primary schooling that have increased to 81.3 in 2008 and adult illiteracy has been reduced from 90% in the early 1970s to 48% in 2008 (INDE-MICS 2008), the quality of education and learning outcomes seem to be stagnated or in decline. According to the Southern Africa Consortium for Monitoring Educational Quality (SACMEQ) data from 2005 and 2009 Mozambique’s scores for Math and Reading in grade 6 have decreased from 530,0
10 and 516,7 points to 483,8 and 476 points respectively (SACMEQ 2009). Whatever the reason, the decline is among the most significant in the region.
A study carried out by the Academy for Educational Development (AED 2011) to measure school effectiveness in Mozambique used a sample of 49 schools in five districts in Cabo Delgado Province. They found that 59% of grade 3 students could not read a single word in Portuguese and 90% of students could not read 10 words per minute. Although the results cannot be generalized to the whole country, they do present an alarming picture of the status of early reading and an x-ray of the quality of education that students are receiving in many rural areas. This situation has triggered a number of initiatives that will be explored later to address quality issues.
Despite being one of the poorest countries in the world (172nd out of 177 in Human Development Index), Mozambique has gone through a significant economic growth rate in excess of 7% for the past years (UN Mozambique 2011). As much as the economy seems to be expanding and public expenditure increasing, the resources allocated to the education sector as a percentage of the state budget are not increasing. The annual allocations made to education sector since 2007 have seen a slight reduction as a percentage of the state budget. In 2007, education received 21.6% of total resources (Government of Mozambique (GoM) 2008), and, in 2010, resources allocated fell to 20% of the total (GoM 2011). For 2011, the resources committed to the sector amount to 17.2% of the budget. However, it is important to mention that in real terms the resources spent for education have more than doubled from 8,797 million MTN in 2006 to 19,871 million MTN in 2010 (GoM 2007 and 2010). Despite the fact that the educational expenditure has more than doubled in four years, the quality of education, as measured by SACMEQ is declining.
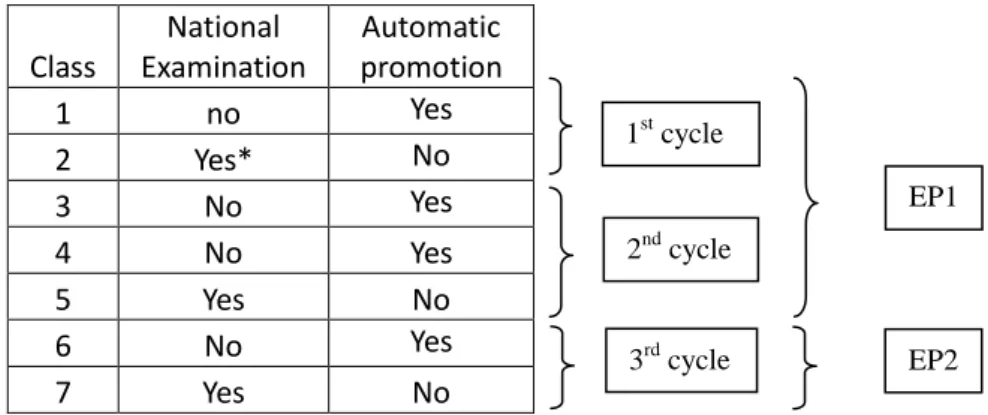
Primary education has been free and compulsory in Mozambique since 2005 and it is designed in three cycles. The first cycle comprises class 1 and class 2 while the second cycle comprises class 3, 4 and 5. The combination of the first two cycles is known as EP1 (First level of primary education) and the third cycle comprising class 6 and class 7 is known as EP2 (Second level of primary education). The first one comprises five years of schooling for grades 1 to 5 while the second one comprises two years for 6th and 7th grade. Schools with the complete two cycles of Primary
11 Education are known as Complete Primary Schools (EPC – Escola Primaria Completa). Completion of the two primary levels allows students the choice to transition to general secondary education, lower primary teaching colleges, basic technical and vocational schools or secondary education for adults.
In addition to government allocations of educators and capital expenditure, schools receive financial resources from the government under the framework of the Apoio Directo as Escolas (ADE - Direct Support to Schools) fund. These resources are decentralized to schools and are aimed to be used for the acquisition of teaching and learning materials such as notebooks, pens, pencils, erasers, sharpeners, chalk. (Ministry of Education (MINED) 2011). There is a minimum amount that schools receive and then it goes up based on the number of pupils and the number of classes. Out of the total amount of the ADE funds allocated to each school, there is 15% flexibility to use funds to cover costs for items which are not considered eligible (MINED 2011).
The Mozambican government’s education sector depends greatly on the financial aid from international agencies, as well as bilateral and multilateral cooperation partners. In the education sector a common fund called the Education Sector Support Fund (Fundo de Apoio ao Sector da Educação, FASE), serves as the means to channel support from donors to the education sector. “In 2009, the resources of the fund represented about 25% of the education budget, and between 60% and 70% of all direct foreign aid to the sector” (OSISA 2012). Even though their activities tend to be limited to a small area, foreign NGOs are also vital sources of financial support for education; the country counts with a significant number of ongoing initiatives that are individually supported or implemented by both national and international organisations at various levels, from school to district to provincial and national level aiming to support the government in achieving its commitment to access and quality of education.
Further efforts in Mozambique should be geared towards improving the quality of the educational service that is being offered.
12
Aim and Rationale
As stated above, Mozambique devoted approximately 17% of its total budget to education in 2011, compared to almost 22% in 2007; in addition to that, the limited overall state budget (even with the current growth) is still a constraint. The expansion of the aggregate budget has not had a corresponding growth on the social sector budget, including education. Even though spending has doubled in the past few years, the sector has been in such a dire situation that the increased expenditure has aided the much needed expansion but a lot of work is still required to respond to quality challenges. Moreover, fluctuating budgets pose additional challenges. For instance, following the constant growth from 8,797 million MTN in 2007 to 19,871 million MTZ in 2010, a significant drop took place in 2011 bringing the education budget down to 14,482 MTZ representing a drop of 26.8%. According to a discussion paper recently published by the Open Society Initiative for Southern Africa (OSISA 2012) the ministry of Education estimates that in order to promote improvements in the quality and equity of the delivery of services with the sector growing at the same rate of the past years (8% per year), the annual budget for the education sector needs to increase by at least 5% per year. Unfortunately, the trends of donor support to both FASE and the education sector seem to be in decline. (OSISA 2012)
In theory, the expansion of access can have a negative impact on the quality of education for which quality needs to be promoted at the same time as growth (World Bank 1997, 2006). The test scores for Mozambique in comparative regional studies show that the learning achievements of students in grade 6th is declining (SACMEQ 2005; SACMEQ 2009). It is not clear, however, the extent to which this is a result of expanded access. Regardless of this, if Mozambique is to achieve the Quality Education for All Goals, substantial efforts need to be put into improving the quality of the education that the system is currently offering.
In a situation like that of Mozambique, where the financial resources are so scarce, it becomes of paramount importance to use the available resources in the most effective
13 way possible. For this reason it is important to determine which are the factors that have the most significant impact on the quality of education in this context in order to allow not only the government but also development partners to ensure that funds are used in the best way possible.
A better idea of the factors that positively affect the learning achievement of students is the basis to develop more focused and targeted projects and programmes as well as influence policy decisions aiming to improve the quality of the educational services offered in schools. Therefore, this study aims to identify which are the factors with the strongest effects on student achievement in Mozambique.
Research Question
The aim of this study is to determine what factors have the most significant effects on learning outcomes in Mozambican schools for pupils in grade 5. In doing so, the study will analyze quantitative data available on schools in the following four broad categories: infrastructure, learning resources, human resources and socioeconomic conditions. Variables to describe these categories will include the material in which schools are built, textbook : pupil ratio, teacher : pupil ratio, classroom : pupil ratio, teachers’ qualifications, drop-out rates, number of multi-level classrooms, literacy level of the community, availability of water and sanitation in the households, access to electricity and socio-economic status.
The study also attempts to determine to what extent additional support to schools in the shape of programmes offered by development partners have had an impact on learning outcomes and if so, compare which ones are yielding the most significant results.
Research question 1: To determine the input variable that has the greatest effect on school outcomes.
14
Research question 2: Which additional support programmes to schools have had the greatest impact on learning outcomes.
According to the Official Development Assistance to Mozambique database, there are 46 projects that have been funded by 21 donors since 1997 (although 75% of the entries have been done after 2003) specifically to support basic education with a total amount of 401,348,758 USD. However, it is difficult to track the effect that all these funds have had in learning outcomes since many of the initiatives of these development partners have had a national scope or fallen within the state’s direct budget support (FASE for the Education sector), so it is difficult to make any differentiation between these, as funds are allocated all throughout the system and it is difficult to track them within the sector to the school level.
There are, however, some more specific programmes which target a relatively large pool of schools. Five different programmes supporting government schools were identified, analyzed and compared. These interventions include:
1. The Child Friendly Schools Programme by The United Nations’ Children’s Fund (UNI).
2. The school feeding from the World Food Programme (WFP)
3. Instruction in local languages and provision of textbooks by Progresso (PRO) 4. Early Childhood Development Programme from the Aga Khan Foundation
(AKF)
5. Community Mobilisation and sensitisation on matters related to the importance of education by CONCERN (CON)
Details on the programme, geographic areas covered timeframe of the intervention and number of schools from each of these interventions will be provided under the sampling section of the Methodology chapter.
15
Literature Review
One of the cornerstones of the literature regarding the effects that school resources have on learning achievement is the Coleman report (Hanushek 1998). In 1966, The United States Office of Education in accordance with the Civil Rights Act of 1964, commissioned a study in order to observe the state of educational equality in the US. The leading researcher was James Samuel Coleman and hence the name of the report. Even though the rationale for this study was linked to racial inequalities, his main conclusions are pertinent to the problem stated above. Coleman’s main conclusions included the fact that additional resources provided to schools or the school quality did not seem to have a substantial effect on student performance and that their performance had to do more with the social composition of schools and the student’s family background among others (Coleman 1966). Coleman is widely cited ever since and inspired subsequent work carried out in the United States.
Hanushek has been one of the authors that, inspired by the Coleman report, wanted to dig deeper into finding additional evidence regarding the effects of school resources on student achievement in OECD countries. Since the early 80s he has published his findings of the meta analysis of selected literature on education production functions. He finds that the estimations made of the effects of resources do not provide solid evidence indicating that additional resources will improve student performance (Hanushek 1997). Moreover he finds a methodological bias showing a pattern where resources seem to have increased effects as the level of aggregation is increased at the various levels, from student, to school, to district to state etc (Hanushek et al 1996; Hanushek 1997). Levacic & Vignoles (2002) reached the same conclusion for selected literature in the UK.
Hanushek’s findings were contested by Greenwald R. et al (1996) who using very similar data sets, reached the exact opposite conclusion: “that school resources are systematically related to student achievement and that these relations are large enough
16 to be educationally important”. They attributed the variance of the findings to the methodology used by Hanushek where the use of different studies analysing the same database were counted as independent observations whereas Greenwald et al make a differentiation for independent datasets (Greenwald et al 1996). This ignited a debate that lasted quite a number of papers. Both currents of thought, however, seemed to agree on the fact that there is no convincing evidence to support either theory. Nevertheless, as even Greenwald et al (1996) recognize, Hanushek’s position remains influential in the subject. It is important to highlight that until then, both currents had focused mainly on schools within the educational system of the United States.
Levacic and Vignoles (2002) make a systematic review of the literature in the UK pointing out the limited availability of strong methodological studies. Out of their short number of acceptable studies according to quality criteria set, they find some evidence that variables of school resources have positive effects on school attainment as well as wages and school quality on educational outcomes, but limited evidence of resource effects on learning outcomes. This means that additional resources seem to impact on the amount of years that students stay in school but not on their results.
Some years later, the discussion took a different turn and researchers began to question whether the theory that school resources had no impact in students’ performance could only be valid in developed countries (Gaviria et al, 2004; Murillo F.J & Roman M 2011). This was supported by the fact that most of the available literature had been produced based on data coming from educational systems in developed countries. Gaviria et al (2004) argue that systems and schools in developed countries receive higher shares of their GDP; in their view, the differences between the quantity and quality of the resources in these schools is relatively low. Their findings confirm the fact that resources do matter and have a significant impact on the performance of students in Math, although their study is limited to Brazilian schools.
A more recent study carried out by Murillo F.J. & Román M. (2011) using the data of the Second Regional Comparative and Explanatory Study carried out by UNESCO which included data from 15 Latin American countries concludes that basic facilities, infrastructure as well as teaching and learning materials do have an effect on 3rd and 6th grade pupils’ performance in Latin American schools.
17 Nevertheless, the literature in developing countries is not as conclusive as it may seem. For instance, a study carried out by Nannyonjo (2007) in Uganda with the support of the World Bank, provides various indications of limited correlations between supplies to schools and learning outcomes, especially when it comes to resources generally viewed as the most important ones, such as funding per pupil, class size and textbooks, among others. Similarly, with the support of the Asian Development Bank, Maligalig et al (2010) measured the education outcomes in the Philippines. Although they conclude that resources do have an effect on school and student performance, they find that the socio-economic characteristics of students are much more significant determinants of pupil achievement.
In an effort to expand the research and address the issue of applicability of the theory in developed and non-developed countries, researchers began to look into international standardized test. For instance, Wossman L. (2003) uses a database of over 260,000 students from 39 countries to estimate the effects of family background, resources and institutions on learning achievements for math and science. His findings include that differences in students’ performance have a limited correlation with differences in school resources.
The lack of evidence to find a correlation with learning outcomes in developed countries is in line with the view that increased expenditure in schooling has taken school systems beyond some minimal threshold (Hanushek 1997). This would point towards the idea that a minimum standard of school facilities is of significant importance but once this level is reached, additional resources seem to have a negligible impact.
There are certainly many limitations to the use of a production function to determine the extent to which some factors affect the outcomes of students’ performance and thus the difficulty to come to a consensual conclusion (Levacic and Vignoles 2002; Gustafsson, no year). Some of the limitations cited by these authors include endogeneity between school resources and student outcomes; omitted variables – particularly those that describe what happens in the classroom- which can result in biased estimates; and levels of analysis or use of aggregated data. Nevertheless,
18 Gustafsson points out that despite the limitations, such an analysis can still reveal which are the most and least important aspects influencing the quality of education especially in developing countries where resources reach schools at a rather basic level.
Moreover, Wenglinsky (1997) argues that the absence of conclusive findings from meta-analysis, points towards methodological limitations of the original studies to begin with. Beyond methodological aspects, Levacic and Vignoles (2002) confirm that “empirical research has so far produced equivocal findings” on the effects that schools resources have on learning outcomes. However, they attribute these equivocal findings in a large extent to the quality of data and highlight that good quality of data is crucial to obtain valid results. Another important issue they highlight is the fact that limited efforts have been made to measure factors related to what happens in school, such as processes, management and the way in which institutional arrangements may also affect schools.
In a study made in South Africa by Vinjevold & Crouch (2001) on learning assessments in grade 3, their findings are inconclusive and they point to socio-economic status (SES) of schools as the possible explanation for this. In a subsequent follow up by Perry (2002) to measure the effects of schools SES, her findings are equally inconclusive and she suggests administrative procedures within schools could be the explanation. Levacic et al (2002) make a strong argument that these processes could be of great importance on the effective use of funds and could thus explain why education production studies ignoring school processes have not managed to identify systematic effects of resources on pupil performance. Some authors are even more critical and question the appropriateness of the production function methodology to measure the equity of educational funding equity such as Fortune and O’Neil (1994).
Wenlinsky (1997) found that expenditures for administration of school districts and instruction were associated with student performance. In his hypotheses he presents a chain of effects starting at the administrative and management level. Certain managerial or administrative choices could lead to low teacher-student ratios and increased level of education of teachers and positively influence the school environment which subsequently influences positively on student achievement. It is
19 interesting to see an effort to look at administrative and institutional issues and their resulting processes, although he fails to explain how he measures this ‘cohesive environment’ which raises mathematics achievement.
In his 2003 study Wossman finds that international differences are significantly related to institutional arrangements. Established central examinations, school autonomy in certain decisions, teacher influence over teaching methods among others seem to be institutional arrangements with positive effects on test scores (Wossman 2003). Similarly, Hanushek (1997) stated that his findings did not mean that all schools were the same and thus ‘schools don’t make a difference’. He rather interpreted that some schools used resources in a more effective way than others and in his view, the policy implications needed to be geared towards creating incentives for schools to use resources in a more effective way rather than just pouring additional resources.
In the past decade, the Southern and Eastern Africa Consortium for Monitoring Educational Quality, also known as SACMEQ, has been conducting assessments to evaluate the schooling conditions and the quality of education in 14 African countries (15 when Tanzania mainland and Zanzibar are counted separately). Hungi and Thuku (2010) carried out a multilevel analysis using SACMEQ data to determine which are the factors that matter the most in the variations of students’ achievement in reading across these countries. They found that some of the factors with the most significant impact include grade repetition, pupil socio-economic background, speaking the language of instruction at home, pupil age and pupil sex. In the specific case of Mozambique, boys seem to outperform girls, and in relation to grade repetition Mozambique was one of the two exceptions of countries that did not show a significant difference between students that had repeated years and students who hadn’t (Hungi and Thuku 2010).
Castanheira (2007) carried out a research thesis looking into the quality of Education in Mozambique using the SACMEQ data of 2000. He found that socio economic status of students strongly influences reading scores but not math ones. Another conclusion he reached was that “pupil-teacher ratio had a negative impact on reading scores” but decreasing this ratio would not have significant effects on the outcomes.
20 Presence of school facilities and female teachers increased the reading scores. Big class size also impacted negatively on performance.
Similarly, Passos (2009), using the same 2000 dataset from SACMEQ, aimed in her doctoral thesis to determine the extent to which teacher competence influenced student performance across countries but giving emphasis to Mozambique. She concludes that the model used is consistent across all 14 countries, were teacher competence is a predictor for reading scores and to a lesser extent for math. In Castanheira’s research (2007) the regressions for math scores proved rather poor as well; this was quite surprising keeping in mind that in the teachers’ competence test, teachers in general scored better in math than in reading. Passos (2009) also found positive correlations between students’ socio-economic status, school resources and parent involvement with scores for reading and math. She also found pre-existing pupil’s characteristics to be among the main predictors of students’ reading scores and students speaking the language of instruction at home tend to score higher in both math and reading.
So far, the literature has covered the production function and the effects of school inputs in general on the learning outcomes. However, it is important to have a framework for the individual interventions or external support (School feeding, use of local languages, early childhood development, community mobilisation and educational packages) that schools receive in order to address the second research question as well.
School feeding programmes are largely aimed to act as incentives for students to attend school and address nutritional challenges that could hinder students’ development and their subsequent capacity to learn. Powell (1998) finds that children receiving breakfast at school have better improvement on weight, height and attendance compared to the control group. However, none of the two groups made significant progress in wide range achievement test scores. Greenhalg (2007) on the other side found that “school feeding programmes significantly improve the growth and cognitive performance of disadvantaged children”. According to Meir (2005) enrolments and attention spam are increased by school feeding programmes. Baxter
21 (2005) sustains that the school feeding on its own has no impact on the quality of education if other underlying issues are not tackled as well.
The literature in general points towards positive effects of early education programmes on subsequent achievement. Campbell and Ramey (1994) find positive effects of preschool programmes on intellectual development and academic achievement through age 12. Similarly, Currie (2001) based on an analysis of various initiatives (small and large scale) in the United States, concludes that early childhood programmes have “significant short and medium-term benefits” especially for disadvantaged students. These benefits include attainment, success and earnings, though it is not specific or conclusive on academic achievement.
According to Saville-Troike (1984) the use of the first language (L1) enhances conceptual development which is key in the learning and understanding processes regardless of whether it will be subsequently tested through the medium of the L2. Swain et al (1990) carried out a study to determine the effects of learning in L1 in a bilingual context on learning a third language. Results showed that literacy in L1 has a strong positive impact on learning a third language. Students who had undergone literacy in L2 did not have this positive effect which would suggest that learning in mother tongue should have positive effects on academic results.
The literature regarding the effects that community mobilization has on learning outcomes or academic achievement is not very extensive. Conley (1998) argues that “increasing community participation in education is not a sufficient condition for improving the quality of teaching and learning” she suggests that the teachers must be at the centre of any initiative to improve teaching methods and techniques suggesting that the impact of these kinds of interventions is limited.
The Global Monitoring Report on Education For All (EFA 2010) points out the fact that “many countries are failing the quality test” and underlines the large disparities among and within countries, with low income states showing the weakest results. If education systems in these countries fail to provide the minimum skills to students, their possibility of benefitting from further education is undermined. Moreover, despite the improvements made in adult literacy in Mozambique, close to 50% of the
22 adult population is still illiterate. This means that most parents lack the skills to support any schooling opportunity that their children are involved in. UNESCO BREDA (2007) did a study in 22 African countries and found that adults with 5-year-school attainment had a 40% chance of being illiterate. If quality issues are not addressed, and students in Mozambique do not get the minimum literacy and numeracy competences, the illiteracy – and poverty- cycle is prone to remain undisturbed.
Every year, the United Nations Development Programme (UNDP) measures a number of indicators to calculate a Human Development Index in most of the member states. Some of the indicators include life expectancy at birth, mean years of schooling, expected years of schooling and the Gross National Income (GNI) per capita, Mozambique was ranked 184th out of 187 countries by the 2011 Human Development report (UNDP 2011). This places Mozambique as one of the poorest countries in the world with very low schooling years. Given the limited resources available and the low quality baseline where the system currently stands, the literature review above suggests that additional resources are likely to have an effect on learning outcomes.
23
Methodology
The study entails a quantitative investigation of a sample of schools, which will be looked at in detail further below, including schools which receive additional support from programme implemented by non-government actors plus a control group of schools getting the basic support from the government. Programmes were considered as part of the sample if they provide support to at least 20 schools in order to ensure that possible differences were not just coincidental.
Sampling
The sample of schools includes the following six categories:
Aga Khan Foundation (AKF)
The Aga Khan Foundation does not provide direct support to schools. However, it has been implementing an Early Childhood Programme (ECD) with 74 pre-schools in five districts in Cabo Delgado Province. The ECD programme is part of an integrated programme on Education, Health and Agriculture in order to provide a holistic framework aiming to tackle rural poverty that includes Adult Literacy to support parents with child care; Food Security with home gardening promoting diversity along with nutritional education; and health skills for parents to provide early stimulation to the children. The pre-schools have also adopted regular snacks under the health component.
The intervention of Aga Khan began in 2001 in a small scale and eventually expanded. However, there have been fluctuating populations due to drought, poverty and other reasons for which it has been more challenging to implement activities in some districts. In order to take the most representative sample of AKF, only the two districts
24 were AKF’s presence is most significant were included in the sample. These are Macomia and Pemba Metuge. It is important to highlight that AKF has targeted these districts for being among the most deprived in one of the poorest provinces in Mozambique. While the AKF intervention is aimed at pre-school, the study looks at whether it has had an impact on the subsequent primary school quality in the districts in which it operates. The total number of EP1 schools in these two districts was 76; however, following some of the limitations from the data base (described in the limitations section below) the final sample of schools from AKF of 60 schools in Cabo Delgado province.
Concern-supported government schools (CON)
Concern has been supporting schools in a number of districts in Manica and Sofala Provinces by helping to improve access to education for vulnerable children. Concern works mainly with school councils, providing training for school council members on planning and designing school plans and management. They also provide education materials to orphans and vulnerable children. Working with district authorities, they provide ethics and regulations training for teachers and school councils as well as helping school councils to design user-friendly codes of conduct and to hold teachers and principals accountable to these councils.
The original list of schools supported by Concern consisted of 126 schools in 9 districts in the Provinces of Manica and Zambezia. The final sample consisted of 102 schools distributed as follows: 56 schools in Manica Province and 46 schools in Zambezia Province.
Government Schools with no additional support (GOV)
A control group of government schools with no additional support was included in the sample. However, deviation of funds in government schools could undermine the reliability of the results of this research. In order to overcome this issue, Public Expenditure Tracking (PET) studies from the Public Integrity Centre (Centro de
25
Integridade Publica - CIP) were analyzed to determine which the districts with the best track records were.
The CIP carried out small PET studies in 15 districts in Mozambique in 2011 in order to track and monitor the expenses of 2010. In most cases the funds allocated to the District Directorate for Direct Support to Schools, were fully decentralized to schools. Only a few districts presented mismanagement and deviation of funds at the district level. These districts were automatically dropped from the list as possible samples for the control group.
When moving further to the school level, a whole variety of issues were raised by the CIP. The most common situations they found included the following:
1. Schools not being able to provide the totality of receipts for their expenses 2. Some expenses declared were different from what was stated in the receipts or
vouchers
3. Some schools were able to provide receipts for items but these items were not present in the school
4. Expenses for non eligible costs exceeded the 15% threshold established by the government.
There seems to be no district with a perfect record. Only one district seemed to have no major concerns on the process of ADE funds. In other cases, it was reported that schools were able to account for all their expenses but they had exceeded the 15% threshold of non-eligible items. In most of these cases, schools had used the funds to build additional classrooms or bought roof material.
For the purpose of this study, the 15% threshold has no implications especially if the funds were ultimately utilized for or within the school environment. For this reason, districts with only this concern at school level were considered eligible as well. A total of 4 out of the 15 district studies met the criteria for eligibility as control group. The selected districts are Mavalane in Gaza Province with 28 schools, Homoine district in Inhambane Province with 56 schools, Murrupula district in Nampula Province with 66
26 schools and Mandimba district in Niassa Province with 26 schools for a total of 176 schools for the control group.
Progresso-supported government schools (PRO)
Progresso is a membership based non-profit Mozambican organisation. They are supporting bilingual education programmes and provide the text books and materials for schools in five local languages in Cabo Delgado and Niassa Provinces. They have also carried out training for teachers to use and teach with the bilingual materails provided. The original list of schools from Progresso contained 62 schools from Niassa Province and 59 schools for Cabo Delgado Province. The final sample contains 48 schools in Niassa and 49 schools in Cabo Delgado for a total of 97 schools.
United Nations Children Fund-supported government schools (UNI)
The UNICEF intervention supports schools with a minimum multi-sector package that includes teaching and learning materials, school rehabilitation, teacher training, capacity building to managers and school principals, vaccination campaigns, school health training, water and sanitation, promotion of hygiene practices and community involvement among others (UNICEF 2009). The programme began with schools in Maganja da Costa district in 2006 and by 2008 it had expanded to a total of 5 districts (Buzi and Mossurize in 2007 along with Chibuto and Changara in 2008). Mantepuez and Angoche districts were the last to be added in 2009 for a total of 7 districts. The final sample of UNICEF-supported schools consists of 624 schools
World Food Programme-supported government schools (WFP)
The WFP programme aims to support access to education and reduce the gender gap as well as improving the nutrition and health status of students (WFP 2009). Their activities include school feeding as well as distribution of take-home rations to
27 orphans or vulnerable students considered prone to drop out. The WFP initiative began in 2001 after heavy flooding in affected districts. However, over the time, the initiative expanded to other districts as well until there was a more or less even distribution among Provinces and some of the districts in them. However, as a result of this choice, the sample of WFP-supported schools was rather scattered from a geographical point of view. Their final sample consisted of 108 schools distributed in 47 districts (mainly 2 schools per district) in all ten provinces of Mozambique.
Descriptive and analytical statistics were used to investigate the extent to which four broad categories identified according to the literature review and availability of data influence the pass rates in each of the sample schools. Moreover, beyond looking at the traditional variables that the government dataset allowed, an additional dummy variable was added, linked to the support that schools receive from non-government development partners and agencies described above, which have got different approaches but in general have the common aim to improve educational quality in schools. The above was carried out with the following two main objectives:
Determine which of the selected variables has the strongest effect on learning outcomes and
Determine to what extent the additional programmes implemented in schools are yielding better results compared with the control group using the same variables.
Variables
A description was made of the sample schools in terms of the following variables which were suggested by the international literature and available in the database:
28
Pupils Per Classroom (PPC): is the average number of pupils in a classroom in a specific level at a given point in time. Classrooms refer to the number of covered, constructed spaces dedicated to teaching and /learning activities. This variable is key in determining whether schools have enough learning spaces.
School Building Material (SBM): refers to the material in which each classroom in the school is built with. The database provides information on the number of classrooms in each school and the predominant material that each classroom is built with. Five materials are present in the database and each of them was given a weight from 1 to 5 as follows: Cement (5); bricks/tiles (4); wooden reinforced cob wall (3); wood, bamboo, hay (2); Others (1); the value was applied to each of the classrooms in the schools built with that specific material and the total was subsequently divided by the total number of classrooms recorded for that specific school. As a result, each school was awarded a School Building Material score representing the average score of the various classrooms which ranges from 1 to 5, being 5 the highest value (better, safer and more durable school building material) and 1 being the lowest value.
Variable 2: Learning resources
Text Books per Student (TBS): is the average number of textbooks per pupil at a specific level in a given subject at a specific point in time.
Dropout rate (DOR): it refers to the proportion of pupils from a cohort enrolled in a given grade at a given school year who are no longer enrolled in the following school year. The dropout rate has a direct effect on the internal efficiency of educational systems. In addition, it is one of the key indicators for analysing and projecting pupil flows from grade to grade within the educational cycle. It has been considered within the resources variable because high drop-out rates represent significant resources that get lost to the investment made in the system.
29 Where
Dropout Rate at grade in school year Promotion Rate at grade in school year Repetition Rate at grade in school year
Variable 3: Human Resources
Pupil-Teacher Ratio (PTR): is the average number of students enrolled per teacher at a specific level in a given point in time. According to the UNESCO Institute for Statistics (UIS online) it is used “to measure the level of human resources input in terms of the number of teachers in relation to the size of the pupil population”
Formula (UIS)
Where
Pupil-teacher ratio at level of education in school year
Total number of pupils or (students) at level of education in school year Total number of teachers at level of education in school year
Teacher Qualification Score (TQS): The Database from the Ministry of Education collects data on of the type of qualification that each teacher in public schools has. It records the highest recognized qualification that a teacher has, meaning that the same teacher, even if holding several of the diplomas present in the database, will only appear as having one (the highest) qualification. There are 19 possible entries recognized as teacher qualifications listed (one of them is “no training” though).
30 Some of these qualifications receive higher remunerations while other groups of qualifications receive the same denominator within the Ministry’s salary scale even though some qualifications within the same denominator are slightly more advanced than others. The Directorate of Human Resources Department within the Ministry has got an illustrating document of Teacher Professional Training (ANNEX 1) which shows the course characteristics for each of the qualifications. Based on this, it was possible to rank these qualifications including entry level, duration and what grade should teachers exercise in. Salary scales along with this document were used to rank all qualifications, (even those within the same denominator and salary scale) from 1 to 16.
In a similar process as the one carried out for the school building material, each teacher was attributed a score based on his/her qualification adding to the school score and the total score for the school was divided by the number of teachers. In this way, each school received a teacher qualification score (TQS).
Percentage of Multi-level Classrooms (PMC): Multi-level classrooms are in many cases a consequence of limited resources and poor planning. Nevertheless, Multi-level classrooms have the potential to have positive impacts such as expanded access, cognitive achievement effects on learners as well as social and personal effects on students (UNESCO 2005). However, for these effects to be verified, some minimum requirements need to be met for multi-level classrooms to bring beneficial effects on learners (UNESCO 2005) including awareness, curriculum adaptation, and teacher preparation among others. Without these, as Mason and Burns (1996) point out, a bias selection and lower quality of education are two factors that can result from multi-age classes
There is limited literature that indicates that the Government of Mozambique is making a bet on multi-level classrooms along with limited evidence of efforts to provide teachers with specific skills to manage multi-level teaching activities. This suggests that multi-level classrooms would have a negative rather than a positive impact on learning outcomes in the Mozambican context.
31
Variable 4: Socio-economic conditions
All the socio-economic data is aggregated at district level, which represents the smallest unit of geographic area with socio-economic data to which each school (and student) falls into.
District Literacy Rates (DLR): the literacy rate was taken at district level and was applied to schools falling under each district.
Households with Electricity (HHE): refers to the number of households that have access to electricity in a specific location at a given point in time expressed as the percentage of the total amount of households in the sample.
Households with access to water (HHW): is the number of households that have access to improved sources of water expressed as the percentage of the total amount of households in the sample.
Housing Materials (HOM): District profiles with data from 2007 contain information on the percentage of households that are constructed with a variety of materials for the roofing, walling and flooring. Based on these percentages, each district was given a housing material score.
Household Assets (HAS): In a similar way, the district profiles contain data on the assets present in each household. The key items that were surveyed were possession of a car, motorcycle, bicycle, TV, radio. Each of these items was given a score (shown in parenthesis) and based on that, each district received a score for the assets present in each household.
There is limited evidence to suggest that one variable is more important than the other in the Mozambican context. Moreover to keep the statistical process simpler, it is important to note that the variables were not weighted.
32
Learning Outcomes
The learning outcomes were measured by pass rates in grade 5 which mark the completion of the first degree of primary education (EP1) into the second degree of primary education (EP2). The relationship between these outcomes and the factors listed above was tested with correlations.
Finally an Education Production Function was used in order to carry out a regression to determine the extent to which each of the variables and factors within them impacts the most on the learning outcomes. The traditional education production function can be expressed as follows:
L = f (I, R, H, S)
Where
L are the learning Outcomes I is the infrastructure
R are the learning resources in schools H are the human resources
S socio-economic background
The study is a non-experimental research. Data sets from the following sources were used to populate selected variables described above:
Annual school survey of the Ministry of Education
Data from the EMIS system from the Ministry of Education
33
Limitations of the research
A number of limitations in the use of education production functions have already been outlined in the literature review. The limitations in this section will not touch upon those but will look into limitations that are specific to the local context and that were found during the research, based on the use of the data in Mozambique.
Database Quality
The UNESCO Institute for Statistics (UIS) has carried out a Data Quality Assessment framework aiming to evaluate the quality of educational statistics in countries around the world. Despite the fact that the Education Management of Information System (EMIS) in Mozambique scores relatively well in the methodological soundness, the accuracy and reliability dimension score very low (68% and 26% respectively in comparison with international norms) (UIS 2009). Countries are evaluated in six dimensions; Mozambique’s EMIS is given an overall score of 41% compared to international standards. The weaknesses in the system pose a limitation in terms of quality of the educational data that was analysed.
Transparency and accountability on funds transferred to schools
Funds directed to schools (ADE) have had various transparency concerns raised. The Centre for Public Integrity (CIP) has been carrying out since 2010 public tracking expenditure exercises at district level. Many of these exercises have pointed out that the flow of ADE funds between District Directorates and schools has several leakages. For example, in the exercise conducted in the Bilene district for 2010, the monitoring team found that schools did not receive the total funds that were allocated to them according to the distribution manuals (CIP 2011). Inaccuracies in the funds allocated and funds actually received by schools could undermine the whole exercise. In order to mitigate this potential discrepancy, the studies of districts which have had a public
34 tracking expenditure exercise carried out were analysed and schools in districts which have received the best feedback available were included in the sample.
Aggregated data and lack of information on test scores at central level
The difficulty of triangulating different methods of measuring learning outcomes is known. Moreover, in Mozambique, there is no systematic way of collecting data at school level on individual student performance throughout the year for which promotion is based on the final national exams performed in grades 2, 5 and 7. These national exams are produced at central level but are administered and corrected at school level. Data on tests scores is only available at schools and not at central level. The absence of test scores by subject at central level made it impossible to have a secondary research based on them. The only data available at central level which could be related to learning outcomes were the pass rates..
Pass Rate calculation
The use of pass rates in itself presented a number of challenges. Throughout the research, it was found that even though automatic promotion is the rule for the grades that do not have national examinations (classes 1, 3, 4 and 6), the results of previous years are taken into account to calculate the results of students in grades that require examinations (classes 2, 5 and 7).
Figure 1 Structure of Primary Education and its Examinations
Class National Examination Automatic promotion 1 no Yes 2 Yes* No 3 No Yes 4 No Yes 5 Yes No 6 No Yes 7 Yes No
*Exams for class 2 are not developed at national level
1st cycle
2nd cycle
3rd cycle EP2 EP1
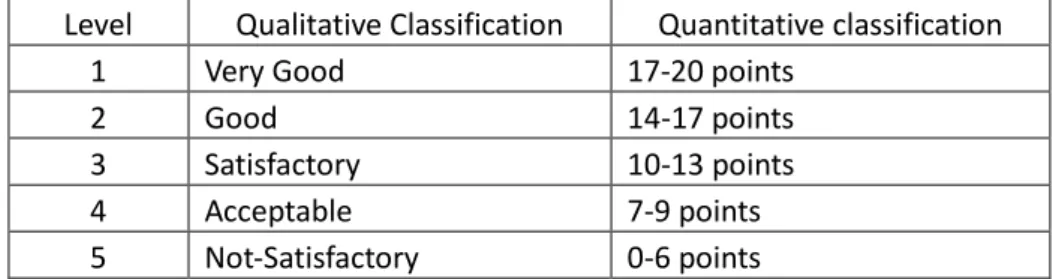
35 Students are assessed on a scale of 0-20 points receiving a classification depending on the amount of points they get.
Figure 2 Levels and Classifications for Test Scores
Level Qualitative Classification Quantitative classification
1 Very Good 17-20 points
2 Good 14-17 points
3 Satisfactory 10-13 points
4 Acceptable 7-9 points
5 Not-Satisfactory 0-6 points
According to the document the first three classifications in Figure 2 above are considered positive while the last two are considered negative. However, students in grade 2 with an acceptable classification will progress into grade 3 even though acceptable is considered a negative.
Levels 1, 2 and 3 (left column) are considered positive making the pass at 10 points out of 20 for grade 5.
At the end of the second and third cycle (class 5 and 7 respectively), three exams are imparted to students in Portuguese, Math and Natural Sciences which aim to measure the student’s learning and competences according to the curriculum.
Calculation of the final score for grade 5 which determines the pass is calculated in the following way:
Each student receives a classification for each of the subjects. The classification for 5th grade (end of second cycle) is the following:
CC2= 2 x MC2 + Exam 3
Where
36 and
MC2 is the average of the scores obtained in class 3, 4 and 5 as expressed below:
MC2= Average of Class 3 + Average of Class 4 + Average of Class 5 3
At the end of the second cycle the pass grade is conceded to students with:
a. A global classifications (all subjects) equal to or above satisfactory b. A classification equal to or above satisfactory in Portuguese and Math c. A classification equal to or above acceptable in the remaining subjects
The above has been taken literally from the General Evaluation Rules of the Basic Education schools. Despite the fact that the above can be confusing to some extent, clarification was requested from Ministry Officials and what this means is that B applies provided that C is verified so they should not be listed as separate points.
This presents a number of challenges. The first one is that only the end of cycle 2 and 3 (5th and 7th grade exams are prepared at national level). This means that any assessment carried out prior to that are not necessarily harmonized at national level for which assessments can be of different type and quality sprouting different results which are later taken into account to calculate the final score.
Despite the fact that the examination for grade 5 is developed at national level, the actual final grade is computed by multiplying by two the average grades of previous class 3, 4 and 5 which are not standardized (see formulae above).
Moreover, progression in these classes is semi-automatic, children with results equal or above acceptable, even though they may not have reached the desired level, will still progress to the next level, which could add to their burden and accumulate weak results. Students accumulating weak results over time will have more difficulties both in terms of their competences but also in terms of calculations to achieve a passing score in fifth grade.
37 On the other hand, schools with limited rigour in their own assessment processes may have students who are ill-prepared receiving positive assessments. In an opposite way, these students will be likely to receive a passing final score even if the final examination is weak.
Data Collection
The data collected for each of the schools came from four different excel files provided by the Ministry of Education. One on enrolments at the beginning and end of the year and number of passing students; another one with teacher information, a third one with classroom and infrastructure data and the last one regarding books and their distribution. However, difficulties and in some cases discrepancies between the files led to the deletion of some of the schools. All schools supported by the various organisations were included in the initial sample. The following are the main reasons why some schools were dropped from the sample:
Some Primary schools offer only a few grades. Since the pass rate in grade five was going to be one of the measures of learning outcomes, schools that did not have at least all five grades of the EP1 cycle were dropped from the sample
In some cases schools had the same name but a different school code in the pass rates file. However, in the teachers’ file there was only one record for the school with that name and no school code. In these cases, both schools were dropped from the sample to avoid double counting.
The WFP school feeding programme was very scattered from a geographical point of view. Since district data needed to be taken from a different database than the school data, each district had to have its own calculations. In some cases WFP would be supporting one school in one district. These schools were not representative of the district and were only adding on to the database
38 workload without any added value. These lone-standing schools were also dropped from the sample.
In some cases the names of the schools provided by the organisations did not match any school in the government data base. These schools were dropped as well. In other cases same names with different spellings were provided. After close scrutiny, only when there was no doubt the school was the same, was it added. In dubious cases, the school was dropped.
In some cases, even though schools had data on the number of students and pass rates teacher etc, the same school would not appear in another one of the files, for example the school building materials or number of classrooms. In these cases, given the lack of data from one or another file, these schools were dropped as well.
Findings
The following chapter covers the findings of the data and is divided into five sections. The first one looks into descriptive data, mainly the pass rates and compares them to the various factors within the variables. The second section analyses whether some of the initial findings could be explained by changes over time. The third section looks into the correlations. The forth section goes into a deeper analysis of each of the interventions and analyses their individual regressions. And finally an overview of all the regressions is made to determine whether there are any interesting patterns by looking at the regressions globally and analysing the regression of the whole dataset.
The research sample covered a total of 1167 schools which represent 11.4% of the total EP1 schools in all provinces in 2010 which amount to 10,195. Note that this value does not include government schools in Maputo city which are further 107 EP1 schools. Often, research carried out in Maputo city is regarded as non-representative