Computational approaches to the
analysis of the T cell receptor
repertoire
Katharine Best
A dissertation submitted in partial fulfillment of the requirements for the degree of
Doctor of Philosophy
Division of Infection & Immunity University College London
2 I, Katharine Best, confirm that the work presented in this thesis is my own. Where information has been derived from other sources, I confirm that this has been indicated in the work.
3
Abstract
The T cell receptor (TCR) repertoire has the potential to be a highly personalised biomarker of historic or current immune challenges, and may hold clinically relevant information. This thesis reviews aspects of the measurement and analysis of the TCR repertoire, including approaches to obtaining high-throughput sequencing data and us-ing these data to investigate features of the repertoire in health and disease. The thesis then considers three topics related to computational and experimental analysis of the TCR repertoire.
First, this thesis explores a technical challenge in obtaining accurate quantitative TCR repertoire sequence data, observing substantial heterogeneity in the PCR amplification step essential for most current high-throughput sequencing protocols. An important conclusion of this chapter is that single molecule barcoding before amplification is essential to obtain robust quantification of clone abundances from sequence data. The second chapter considers the challenges of producing an effective TCR repertoire which can provide broad coverage of potential pathogens while maintaining tolerance to self-peptides. A computational model is explored which incorporates a linear pro-gramming representation of peripheral tolerance, with dendritic cells acting as the cen-tral agents reshaping the T cell population. The model is shown to maintain a pop-ulation with restricted responsiveness to self-peptides while retaining a diverse and cross-reactive repertoire.
In the final results chapter, TCR repertoire data from immunised mice is used to demon-strate that within a simplified animal model of immune response, the antigen responsive CDR3βs are almost completely private. However, exploration of the protein sequences of the antigen associated CDR3βs suggests that there may be amino acid motifs
defin-ing the antigen response.
Overall, this thesis demonstrates the application of computational and modelling ap-proaches to address questions regarding the TCR repertoire, facilitating interpretation of high-throughput sequencing data and providing insight into maintenance of diversity in the peripheral T cell population.
Acknowledgements
Firstly, thanks must go to my primary supervisor, Prof. Benny Chain, for his continued support and encouragement without which this thesis wouldn’t exist. Thanks also go to my secondary supervisor, Prof. John Shawe-Taylor and to Dr. Maddy Noursadeghi who have both provided invaluable input and advice during my PhD.
I am particularly grateful to Dr. Chris Watkins, with whom the model presented in Chapter 3 was developed, and to Prof. Nir Friedman and his group who generously provided the data analysed in Chapter 4.
Thanks go to everyone in the Chain and Noursadeghi lab groups, for their help and particularly for their patience in the face of my frequent questions.
The support of my family and friends has also been essential throughout this time and I’m immensely grateful to all of them.
Contents
1 Introduction 13
1.1 The TCR repertoire . . . 13
1.1.1 TCR recognition of antigen . . . 13
1.1.2 Generation of a diverse TCR repertoire . . . 16
1.1.3 Clonal differentiation and expansion . . . 19
1.1.4 Peripheral regulation of the T cell population . . . 19
1.1.5 Studying the TCR repertoire . . . 23
1.2 TCR repertoire sequencing and analysis pipeline . . . 23
1.2.1 Library preparation protocols . . . 24
1.2.2 Processing of HTS TCR data . . . 26
1.3 Analysis of TCR repertoire sequence data . . . 31
1.3.1 Global properties of the TCR repertoire . . . 31
1.3.2 Antigen specific T cells . . . 38
1.4 Scope of this thesis . . . 41
2 Computational analysis of stochastic heterogeneity in PCR amplification efficiency revealed by single molecule barcoding 43 2.1 Introduction . . . 44
2.2 Materials and Methods . . . 46
2.2.1 Sample collection and processing . . . 46
2.2.2 Data analysis . . . 49
2.2.3 PCR simulator . . . 51
Contents 6 2.3.1 Heterogeneous amplification efficiency demonstrated by
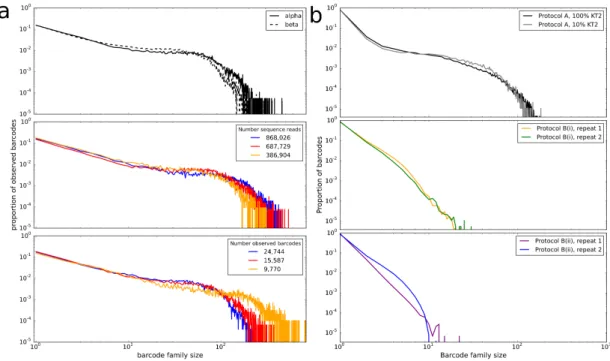
unique molecular barcoding of cDNA molecules. . . 52
2.3.2 Barcode family size is not dependent on barcode sequence, bar-code clash or non-uniform barbar-code primer frequencies . . . 55
2.3.3 Inherited differences in PCR efficiency are necessary to explain the observed diversity in barcode family size. . . 59
2.4 Discussion . . . 64
3 Immune tolerance maintained by cooperative interactions between T cells and antigen presenting cells shapes a diverse TCR repertoire 69 3.1 Introduction . . . 70
3.2 Methods . . . 73
3.2.1 A simple computational model . . . 73
3.2.2 Assessing the potential for an immune response . . . 79
3.3 Results . . . 80
3.3.1 Clone size adjustment algorithm reaches a solution of the reper-toire constraints: violations are resolved rapidly and reperreper-toire is optimised slowly . . . 80
3.3.2 Positive selection of clonotypes based on self-profile binding strength is required for successful immune tolerance . . . 82
3.3.3 Total population size homeostasis but increased clonotype abundance heterogeneity as a function of time . . . 85
3.3.4 Increased number of T cell clonotypes provides greater reper-toire coverage . . . 86
3.3.5 Clonotype diversity and spMHC profile cross-reactivity are preserved by the update algorithm . . . 88
3.3.6 New clonotypes can establish themselves in a stable repertoire . 91 3.4 Discussion . . . 96
4 Heterogeneity in the antigen-specific T cell response at the level of the T cell receptor 101 4.1 Introduction . . . 101
Contents 7
4.2.1 Sample collection and sequencing . . . 102
4.2.2 Data processing . . . 103
4.2.3 Data analysis . . . 105
4.3 Characteristics of the TCR repertoire . . . 106
4.4 TCR repertoire changes onin vivoimmunisation . . . 111
4.4.1 Known OVA-responsive CDR3βs do not distinguish reper-toires from OVA-immunised mice . . . 111
4.4.2 OVA-responsive TCRs are not public between mice . . . 112
4.4.3 Expansion with respect to unimmunised samples identifies pri-vately responding CDR3βs . . . 114
4.5 In vivoTCR repertoires: discussion . . . 120
4.6 TCR repertoire changes onin vitrostimulation . . . 121
4.6.1 Known OVA-responsive CDR3s are not increased in frequency in OVA stimulatedin vitrocultures . . . 122
4.6.2 In vitrostimulation of pools of spleen cells with different antigens122 4.6.3 Expansion relative toex vivospleen sample identifies privately OVA associated CDR3βs . . . 123
4.7 In vitrodata: discussion . . . 129
4.8 Identifying amino acid based motifs of OVA-associated CDR3βs . . . . 130
4.9 Discussion . . . 134
5 Discussion 139 Bibliography 145 Appendices 162 A PCR amplification heterogeneity: Supplementary Information 163 A.1 Empirical distribution of barcodes . . . 163
A.2 Supplementary Figures . . . 165
B PCR simulator code 170
Contents 8 C.1 Model and update algorithm . . . 183 C.2 On-line minimisation of a convex function . . . 187
D Short Read Decombinator 190
D.1 Short Read Decombinator (‘SRD’) Algorithm . . . 190 D.2 V region pairing . . . 191
List of Figures
1.1 TCR structure and recognition of peptide-MHC complexes . . . 15
1.2 Recombination of TCR gene segments . . . 17
2.1 Schematic of the PCR amplification study . . . 53
2.2 Long-tailed distribution of barcode family sizes observed. . . 55
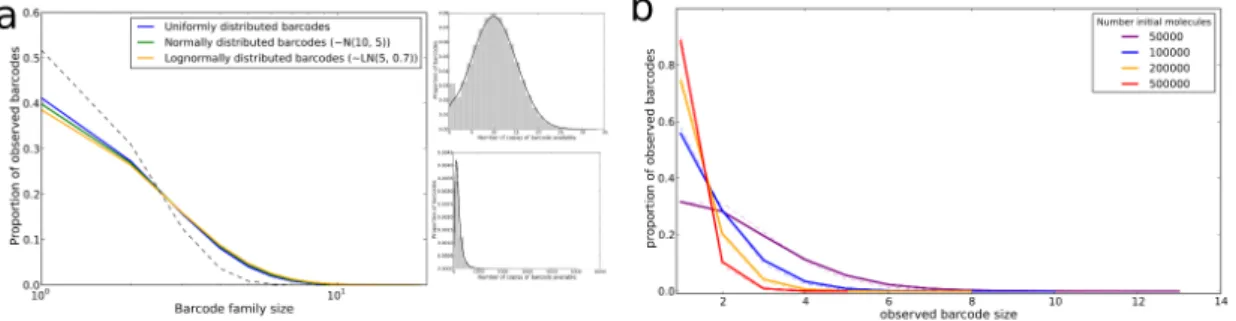
2.3 Final barcode family size is unrelated to proporties of the sequence being amplified . . . 57
2.4 Barcode clashes do not explain the observed PCR amplification hetero-geneity . . . 58
2.5 Non-uniform barcode availability does not explain observed PCR am-plification heterogeneity . . . 59
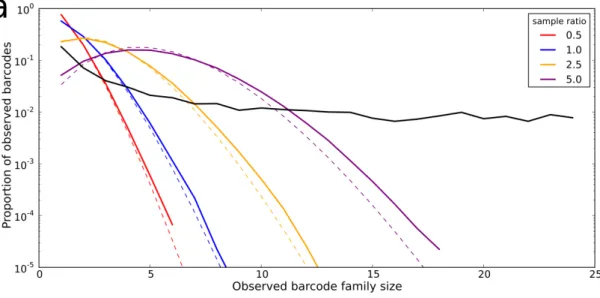
2.6 PCR simulator software . . . 61
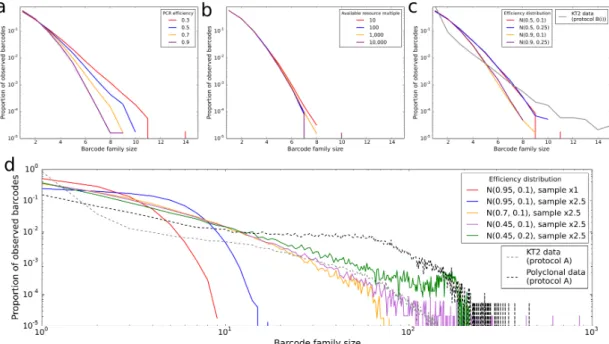
2.7 Barcode family size distributions with fixed amplification efficiency . . 62
2.8 Barcode family size distributions under different models of PCR het-erogeneity . . . 65
3.1 Optimisation of the T cell population to avoid autoimmunity while maximising T cell numbers in a simplified system. . . 81
3.2 Evolution of the repertoire under the constraints of dendritic cell de-pendent T cell deletion. . . 84
3.3 Broad coverage to non-self is maintained during the development of a self-tolerance repertoire. . . 87
3.4 Clonotype diversity and pMHC profile cross-reactivity are preserved by the update algorithm. . . 90
List of Figures 10 3.6 New clonotypes introduced with ‘similar’ affinity profiles to existing
clonotypes demonstrate diverse behaviour . . . 93
3.7 Ability of a clone to establish itself in the repertoire depends on change in affinity profile from template . . . 95
4.1 Numbers of TCR sequences obtained from each sample . . . 106
4.2 Gene usage in TCRβ samples . . . 108
4.3 Repertoire diversity measures . . . 109
4.4 Frequency of known OVA-responsive CDR3s:in vivosamples . . . 112
4.5 Immune response at the CDR3β level is not shared between mice . . . 113
4.6 Expanded CDR3βs identified with reference to frequency in unimmu-nised mice . . . 115
4.7 Identification of OVA-associated CDR3βs inin vivodata . . . 118
4.8 Frequency of known OVA-responsive CDR3s:in vitrostimulated samples122 4.9 Similarity between repertoires . . . 123
4.10 CDR3β clone sizes and expansion coefficients ofin vitrosamples . . . 124
4.11 Correlation between CDR3β expansion coefficients in TB and OVA stimulated samples . . . 126
4.12 Patterns of abundance and expansion of OVA-associated CDR3βs . . . 127
4.13 Sets of OVA-associated CDR3βs demonstrate amino acid sequence similarity . . . 132
4.14 Amino acid motif usage in OVA-associated sets of CDR3βs . . . 133
4.15 Usage of OVA associated duplets and triplets in full CDR3β repertoires 134 A.1 KT2 TCR sequences . . . 165
A.2 Effect of error correction on observed TCR repertoire . . . 166
A.3 Distribution of available barcode oligonucleotides . . . 167
A.4 PCR simulator - models 2 and 4 . . . 168
List of Tables
2.1 Primer sequences used in PCR amplification study . . . 50 4.1 Details of mouse TCR repertoire samples analysed in Chapter 4. . . 103
List of abbreviations
APC antigen presenting cell
ART anti-retroviral therapy
CDR complementarity determining region
CFA complete Freund’s adjuvant
CMV cytomegalovirus
CTCL cutaneous T cell lymphoma
DC dendritic cell
DCR five-part Decombinator classifier describing a TCR
gDNA genomic DNA
GvHD graft vs host disease
HIV human immunodeficiency virus
HSCT haematopoietic stem cell trans-plantation
HTS high throughput sequencing
Ig immunoglobulin
MHC major histocompatibility com-plex
MRD minimal residual disease
mRNA messenger RNA
OVA ovalbumin protein or peptide
PBS phosphate buffered saline
PCR polymerase chain reaction
pMHC peptide/MHC complex
RSS recombination signal sequences
SI Shannon information
spMHC self-peptide/MHC complex
SRD short read Decombinator
T-ALL acute T lymphoblastic leukemia
TB mycobacterium tuberculosis
TCR T cell receptor
TIL tumour infiltrating lymphocyte
Chapter 1
Introduction
1.1
The TCR repertoire
The immune system in an individual needs to protect against harmful pathogens in or-der to avoid disease. The cells of the innate immune system (including monocytes, macrophages, neutrophils and dendritic cells) each act to enable rapid detection of the presence of pathogens and to launch broad immune responses. Additionally, certain cells of the innate immune system are able to initiate an adaptive immune response via activation of T and B lymphocytes in an specific manner. The antigen-specificity of the T and B lymphocytes is determined by their T or B cell receptors, and the repertoire of antigen-specific receptors in the lymphocyte population of an individ-ual provides information about the status of their immune system.
1.1.1
TCR recognition of antigen
T cells recognise antigen through interactions between the T cell receptor (‘TCR’) and peptide fragments in the context of major histocompatibility complex (‘MHC’) on the surface of an antigen presenting cell (‘APC’) such as a dendritic cell. There are a num-ber of factors that influence whether a particular TCR is able to recognise and respond to a particular peptide-MHC (‘pMHC’) [82], and here the recognition is discussed more generally.
1.1. The TCR repertoire 14 and aβ chain, although a minority of T cells express a receptor formed of aγ and a
δ chain. Each chain contains constant (‘C’) and variable (‘V’) regions (Figure 1.1a). The variable portion of the TCR is formed by imprecise rearrangement of gene seg-ments, discussed in more detail in Section 1.1.2. There are a number of areas of the TCR that are responsible for specific recognition of pMHC, each known as a comple-mentarity determining region (‘CDR’). Each chain of the TCR has a highly variable region called the CDR3, which is defined as the section between two conserved amino acid motifs. The CDR3 is highly variable due to non-templated nucleotide additions and nucleotide deletions occuring in this region of the TCR during the rearrangment process. The CDR3 is the part of the TCR which is primarily responsible for contact with, and therefore recognition of, the pMHC and as such is the major part of the TCR defining the antigen specificity of the T cell [71]. Other regions of the receptor are mostly responsible for contact with parts of the MHC, ensuring a stable and productive interaction between the T cell and the APC.
MHC molecules are glycoproteins and come in two different classes, class I and class II. The classes are expressed to different degrees in different cell types, and have dif-ferent structures. However, both are formed of 4 subunits, with the pair of subunits furthest from the membrane forming a ‘groove’ into which a peptide fragment can bind (Figure 1.1b, c). Polymorphisms in both classes of MHC molecules are mostly located in the peptide-binding cleft [20], meaning that individuals with different MHC types will be able to present different peptide fragments to the T cell population.
APCs, such as dendritic cells, process proteins into short peptide fragments that may be able to be presented in groove of MHC molecules and these pMHC complexes are then transported to the surface of the cell [150]. The proteins that are processed and presented can either be cellular or exogenous, in which case they must be endocytosed or phagocytosed into the antigen presenting cells. Only peptide stretches that are com-patible with the MHC molecule are able to be presented, and as such both the overall structure of the MHC and the MHC type of the individual limits the antigens presented to T cells. In general class I MHC can only present a more restricted set of peptides, with the majority of presented peptides being 9 or 10 amino acids long, while class II can accomodate longer peptides [62].
1.1. The TCR repertoire 15
Figure 1.1: TCR structure and recognition of peptide-MHC complexes All panels taken from [107]
(a) The T cell receptor is formed of two chains (generallyα andβ, although some
T cells express a receptor formed ofγandδ chains), each consisting of a constant
region (C) and a variable region (V). The region of the TCR responsible for antigen recognition spans the variable regions of both chains.
(b) MHC Class I molecules are formed of a membrane boundα chain, consisting
of three domains (α1,α2andα3) and aβ2microglobulin.
(c) MHC Class II molecules are formed of two membrane-bound chains (αandβ), each consisting of two domains.
(d) When a TCR expressed on a T cell interacts with sufficient binding strength with a compatible peptide fragment (x) in the context of a compatible MHC molecule presented by an antigen presenting cell there is antigen recognition. (e) When a TCR binds to a peptide:MHC class I complex the TCR interacts with parts of both theα1andα2 domains of the MHC and with parts of the presented
1.1. The TCR repertoire 16 With some exceptions (for example, invariant T cells which recognise non-MHC anti-gen, and activation by super-antigens which does not require costimulation), T cells are activated through interaction between TCR and pMHC on the surface of an APC (Figure 1.1d,e), in the presence of costimulatory signals and appropriate environmen-tal conditions. In order for a TCR-pMHC interaction to yield T cell activation and an immune response there needs to be sufficient affinity between the receptor and the antigen. Understanding the factors that determine whether a TCR will interact with a pMHC with sufficient affinity or for a sufficient duration to initiate activation is there-fore a key question if we wish to understand whether a given T cell population will mount a succesful immune response against a given pathogen, or if we want to know which clones in a repertoire are important in a particular disease setting. However, how to predict the interaction between the TCR and pMHC, and therefore produce a map-ping between TCR clones and the antigens to which they are able to mount an immune response, is not fully understood.
1.1.2
Generation of a diverse TCR repertoire
In order to be able to recognise and respond to the unknown potential pathogens an individual might encounter, the T cell population needs to express a range of TCRs with diverse specificities. This is achieved by stochastic recombination of gene seg-ments in each developing T cell, rather than by expression of germ-line encoded recep-tors, meaning that even two genetically identical individuals will possess different TCR repertoires.
The TCR is a heterodimer, and in most T cells is made of an α chain and aβ chain. Each chain is created through a series of somatic recombination events while the T cell is developing in the thymus, which rearrange one of a number of variable (‘V’) and joining (‘J’) gene segments (and in theβ chain only, one of a number of diversity (‘D’)
segments) together while the intermediary DNA encoding the other gene segments is excised [8]. This rearranged DNA is transcribed and spliced to a constant (‘C’) gene to give the receptor chain (Figure 1.2). The gene recombination is performed by enzymes, particularly RAG, recognising recombination signal sequences (‘RSS’) that flank each of the V, D and J genes.
1.1. The TCR repertoire 17
Figure 1.2: Recombination of TCR gene segments Taken from [107]
Schematic of TCRα andβ chain rearrangement.
In addition to the combinatorial potential to create a large number of different TCRs from the number of different V, D and J genes available in the recombination process, additional receptor diversity is introduced by the imprecise nature of the recombination machinery. At each of the junctions between gene segments (V-J forα, V-D and D-J
forβ), the enzymes involved in the recombination process delete a varying number of the germline nucleotides and include a varying number of non-templated nucleotides [48], allowing for a massive number of potential TCR types.
One study has estimated that there are 1015 potential different α β TCRs [37], using a combinatorial approach considering the gene segment options plus the effect of nu-cleotide deletions and non-templated nunu-cleotide insertions, while Janeway’s Immuno-biology [107] calculates a theoretical α β diversity of 1018. Both of these estimates
of the number of potential TCRs vastly exceed the number of T cells in a human so this level of diversity will never be realised in an individual. An early TCR reper-toire study [11] estimated that there are approximately 106distinctβ chains in human blood, each of which paired with on average 25 different α chains, giving a lower
1.1. The TCR repertoire 18 the vast difference between the theoretical and realised diversity of the TCR repertoire. More recently, a mathematical model has been used to estimate the number of distinct clonotypes present in a human [90], finding that the mean clone size, over the life of a clonotype, is of the order 10. Therefore, since a human contains in the order 1010 T cells an estimate of 109distinct clonotypes is reached.
Given the difference between the potential and realised TCR diversity, only a small fraction of the possible TCRs will be rearranged in any individual. With these re-arranged TCRs, the immune system needs to be able to provide broad coverage of antigens that indicate the presence of dangerous pathogens that the individual might encounter, while avoiding a harmful immune response to self-peptides that are con-tinuously presented on MHC by APCs. To achieve this, the developing T cells pass through two rounds of TCR-dependent selection in the thymus, as reviewed in e.g. [106].
First, developing T cells encounter thymic epithelial cells that present a selection of self-peptides loaded into MHC (‘spMHC’), and they must bind with strong enough affinity to receive necessary survival signals to pass positive selection [80]. Secondly, if a T cell binds too strongly to spMHC complexes presented by thymic APC it is deleted under negative selection [72]. To create tolerance to the full range of self-peptides that peripheral T cells might encounter, the AIRE transcription factor causes expression of a full range of tissue-specific proteins within thymic epithelial cells [9]. Together, these selection processes ensure that the cells that reach the periphery are enriched for those that are able to recognise peptide loaded into MHC molecules without recognising too strongly ‘harmless’ self-peptides.
However, it is now recognised that the thymic selection process is somewhat ‘leaky’ [163] and there are self-reactive T cells present in the periphery, some of which may be at frequencies equivalent to those of nonself-reactive T cells. As such, there needs to be mechanisms in the periphery to ensure the T cell population does not cause auto-immunity through recognition of and response to self-antigens, discussed further in Section 1.1.4. In Chapter 3 we develop a model of maintenance of peripheral immune tolerance and investigate the effects of this model on the repertoire.
1.1. The TCR repertoire 19
1.1.3
Clonal differentiation and expansion
When a T cell encounters cognate antigen (pMHC which is ‘recognised’ by its TCR with enough binding strength), in the presence of costimulation (e.g. from CD80 and CD86 on the antigen presenting cells) and additional ‘danger’ signals [96] from the innate immune system acting either on the APC or the lymphocytes directly, it be-comes activated. Activation of T cells initiates signalling cascades which result in cell differentiation and clonal expansion [27]. Some cells in the activated clone become long-lived memory cells, allowing a more rapid immune response if the same pathogen is encountered by the individual again. Others become effector T cells, providing a tar-geted, antigen-specific immune response against the pathogen that activated the clone. A key feature of this clonal expansion is that all progeny of a given T cell carry the same TCR, allowing them to effectively act to clear, in a targeted manner, the pathogen that initiated the immune response. This clonal expansion also means that the repertoire of TCRs (the size and type of each T cell clone) in an individual contains information about the current and historical immune challenges the individual has faced, and may be able to predict the ability of their immune system to effectively counter future immune challenges. A combination of experimental and computational techniques is necessary to extract and interpret such information.
1.1.4
Peripheral regulation of the T cell population
Thymic selection ensures that peripheral T cells are enriched for those bearing TCRs which are able to recognise, but which do not respond too strongly to, self-peptides presented in the context of MHC. However, this system is not perfect, and as such both T cells that are self-responsive and T cells that are unable to recognise MHC-presented peptides may be present in the periphery. In order to maintain an optimal T cell pop-ulation and to avoid harmful auto-immunity, both positive and negative processes of T cell population regulation are required outside the thymus.
In [142], thymuses from wild type mice are grafted into RAG deficient mice, who do not produce their own mature T or B cells, that either do or do not express MHC class II molecules. It was found that newly generated CD4+ T cells are able to proliferate
1.1. The TCR repertoire 20 in the periphery even in the absence of MHC class II, but that long term maintenance of the peripheral pool of CD4+ T cells is compromised in those mice. In [112] it is demonstrated that the presence of MHC Class I expressing cells is required for CD8+ T cells to successfully survive in the periphery. Both these studies suggest a form of positive regulation of the peripheral T cell population, with T cells that are not able to interact with self-peptides presented in the context of MHC molecules being deleted.
More recent evidence of the requirement for naive T cells to recognise self-peptide MHC complexes is reviewed in [141], including the observation that maintenance of the naive T cell population in the absence of MHC appears to be very context depen-dent. For example, the studies mentioned above used lymphopenic mice, in which the response of T cells to signals that normally induce homeostatic proliferation is known to be altered. In a study where polyclonal naive T cells are transferred into various non-lymphopenic mice, it is seen that in MHC-deficient hosts phosphorylation of TCRζ (as
a measure of TCR signalling) in donor cells is rapidly lost but survival over a month is equivalent to the survival seen in wild type hosts [41], suggesting that interactions between TCR and MHC are not essential for survival of naive T cells.
In [23], a review of experimental evidence demonstrates considerable support for the idea that survival of naive T cells requires survival signals from MHC in conjuction with IL-7 signalling, and that there is considerable competition in the periphery for self-peptides presented on MHC. However, maintenance of the memory T cell population does not require MHC signalling.
If recognition of self-peptide-MHC complexes is required for long-term survival of naive T cells, the homeostatic abundance of a T cell clone in the periphery should be dependent on availability of peptide that its receptor is able to interact with. It has been shown experimentally that the precursor number does affect the maintenance of naive and memory T cells in non-lymphopenic hosts [57]. Cells of clones with lower abundance are more likely to survive than cells from large clones, suggestive of intra-clonal competition for peptide and therefore of dependence on MHC for T cell mainte-nance. Competition between different clones for peptide has been modelled [138, 137], showing that clones which have greater overlap of self-peptides recognised with other
1.1. The TCR repertoire 21 clones tend to become extinct more rapidly. This competition for peptide results in a diverse repertoire, where the most successful clones occupy ‘niches’, with few other clones recognising the same self-peptides. An alternative modelling approach is used in [97], where the ‘optimal’ repertoire is found to be sparse when cross-reactivity between clonotypes is present.
In addition to positive regulation of the peripheral T cell population, removing cells which are unable to recognise peptide in the context of MHC, negative regulation is also required in order to avoid dangerous immune response to self-peptides. Avoidance of self-response is known to involve regulatory T cells (‘Tregs’), which suppress the function of conventional T cells. The role of Tregs in the maintenance of self-tolerance and the avoidance of autoimmunity has been thoroughly reviewed (e.g. [128, 129]) and is not considered further here.
The ‘danger model’, first proposed by Matzinger in 1994 [95], suggests that APCs are activated by alarm signals from injured or infected cells, and that only TCR interactions with peptide presented by activated APCs are able to stimulate a T cell response. A possible extension of this model is that APCs that have not been activated by these alarm signals would have the potential to be tolerogenic, ensuring no immune response is initated following interaction with the peptides being presented on resting APCs. The evidence for the existence of tolerogenic DCs is conflicting, but as reviewed in [135] they were first suggested in mouse experiments where an antigen was delivered to DCs without the DC becoming activated [58]. This resulted in proliferation of antigen specific T cells, rapidly followed by contraction of the population and the remaining cells becoming unresponsive to later antigen challenge. However, the evidence for true tolerogenic DCs is still relatively unclear. An additional role of DCs in peripheral regulation of the T cell population is the ability of immature DCs to induce Tregs, as discussed in detail in [92]. Dendritic cells have also been shown to be able to delete CD8+ T cells [166] directly through an MHC dependent mechanism, and a particular subpopulation of DCs which express perforin, a cytolytic protein that forms pores in the cell wall of target cells, have been shown to be important for avoidance of tissue-specific autoimmunity [167].
1.1. The TCR repertoire 22 In addition to dendritic cells, other APCs are able to regulate the peripheral T cell pop-ulation. In secondary lymphoid organs resident stromal cells are involved in recruiting and organising T cells, so that they are able to meet DCs presenting antigen but ad-ditionally, as reviewed in [149], they express and present peripheral tissue restricted antigens, and in doing so tolerise naive T cells to these peptides. There is also consid-erable debate about the role of Langerhans cells (specialised DCs present in the skin and mucosa) in T cell tolerance, with conflicting evidence regarding the role of these cells in the epidermis and their mechanism of action. In some experimental models Langerhans cells have been found to stimulate T cell responses while in other settings they are seen to induce tolerance, as reviewed in [66, 89].
Despite understanding and modelling some of the mechanisms of positive and negative regulation of the T cell population in the periphery, understanding how the immune sys-tem is able to make a robust decision about whether to initiate a response to a presented peptide remains a challenge. The flexibility of the TCR-pMHC interaction results in much cross-reactivity, and there is overlap in the distribution of affinities with which TCRs bind to self or nonself presented peptides. One approach to understanding this is to consider cooperative behaviour between T cells and dendritic cells, and to consider the decision making process as occurring not at a single cell level but at a population level. In [28] an elegant model of quorum-sensing is described, where an immune re-sponse is only initiated if sufficient T cells recognise presented peptide on an APC. Once positive and negative thymic selection has skewed the distributions, across the whole T cell population, of affinity to self and nonself peptides, a carefully selected quorum threshold is then able to accurately discriminate between presented peptides in the periphery.
In Chapter 3, concepts of tolergenic APCs, cooperation between cells of the immune system and cross-reactivity between T cell clonotypes are combined in a model of maintenance of immune tolerance at steady state in the periphery.
1.2. TCR repertoire sequencing and analysis pipeline 23
1.1.5
Studying the TCR repertoire
The majority of studies into the role of T cells in an immune response either consider the T cell population without considering clonal distinctions (e.g. measuring population subset sizes) or investigate the role of antigen-specific lymphocytes in isolation, either in vitro (e.g. using tetramers to isolate antigen-specific T cells) or in vivo using TCR transgenic approaches.
In contrast, deep-sequencing studies covering the whole TCR repertoire provide a holis-tic approach to investigating the role of the T cell population at steady state or in re-sponse to an immune challenge, allowing systems-level questions to be asked about how clones interact and whether these interactions affect the behaviour of the whole system.
1.2
TCR repertoire sequencing and analysis pipeline
Initial studies into the TCR repertoire provided only low-throughput and/or coarse data regarding the receptors present in a sample. For example, spectratyping techniques using Vβ specific primers allowed the distribution of lengths of CDR3 within a Vβ
family to be measured [51, 52] but did not provide any sequence information regarding the different clonotypes within the V gene family. Before the development of high-throughput sequencing, to obtain sequence information about individual TCR clones individual antigen specific T cells were isolated using tetramers. These single cells were then grown up into T cell clones and their receptors sequenced via Sanger se-quencing.
The development of high-throughput sequencing (‘HTS’) has provided the ability to ac-quire the nucleotide sequence of millions of molecules in one experiment, and protocols have been developed to apply this technique to libraries of TCRs. These sequencing data provide a more comprehensive and detailed view of the TCR repertoire in a sam-ple than was previously possible, but require careful processing and analysis to obtain biologically relevant information.
1.2. TCR repertoire sequencing and analysis pipeline 24
1.2.1
Library preparation protocols
Various TCR sequencing protocols have been developed, but all need to include steps to extract the template nucleic acid material from the sample and amplify the template molecules via PCR to obtain concentrations suitable for loading onto the sequencing machine.
TCR sequencing protocols either use genomic DNA (gDNA) or messenger RNA (mRNA) from cells as the template to be amplified and sequenced. The choice of start-ing material affects the experimental protocol, due to different primstart-ing sites available for PCR amplification, as well as data processing decisions, discussed later.
TCR gDNA includes intronic regions, which are removed by splicing following tran-scription and so are not present in mRNA. The most substantial of these introns, and the most relevant in the development of TCR sequencing protocols, is the section between the J gene and the constant region which can be long, especially in comparison to the ca-pabilities of the PCR reaction and of sequencing machines. The presence of this intron means that amplification from gDNA is not feasible using primers against the constant region, shared by all template molecules, and still ensure coverage of the CDR3 which is generally the region of interest. Protocols sequencing from gDNA [125] therefore generally use a panel of J region primers, covering the known functional J genes, to avoid amplifying the intron region.
Similarly, amplification of TCR target molecules, whether from mRNA or gDNA, is complicated by the lack of a conserved sequence at the V-gene end of the molecule that could be used as a primer target. This can be solved by using a panel of V primers cover-ing the known functional V genes. As an alternative to uscover-ing a panel of V gene primers, an adapter containing a known sequence can be added to the V end of the molecule to be used as a priming site. The addition of the adapter is usually performed through a technique known as template switching (e.g. [45, 156] and others), which exploits a property of some reverse transcriptase enzymes, allowing the additon of non-templated nucleotides to the end of the molecule, providing a priming site. Alternatively, as in the protocol developed in our lab, a ligation step can be used to add a primer site onto the V end of the template molecule. Once a known sequence has been added to each
tem-1.2. TCR repertoire sequencing and analysis pipeline 25 plate molecule, PCR amplification for mRNA protocols can be performed between this primer site and a primer site in the constant region of the TCR, meaning only one pair of primers per constant region (α orβ) is needed to amplify all TCR rearrangements found in the sample.
In our lab, the TCR sequencing protocol, as described in [59], uses mRNA and a lig-ation approach to add a known primer site to the V end of the target molecules and amplification of molecules using primers between this site and the constant region. The mouse TCR repertoire data analysed in Chapter 4 from Nir Friedman’s group at the Weizmann Institue is sequenced from mRNA using a PCR reaction between a panel of V primers and the constant region as described in [91].
One of the difficulties with the current high throughput TCR sequencing protocols is that they allow data to be collected regarding both the α and β TCR chains that are
present in a sample of cells, but do not allow identification of which α was paired with which β in a cell. Protocols obtaining paired chain sequencing data have been
developed, which either physically link theαandβRNA from a cell before sequencing (e.g. [148, 99]), amplify both theα andβchains from single cells and Sanger sequence
(e.g. [36]) or alternatively apply a unique cellular barcode to RNA from each cell before sequencing (e.g. [55]). However these techniques are currently much lower throughput and more expensive than the protocols obtaining unpaired sequencing data.
Alternatively, computational approaches are being utilised to obtain paired chain data. PairSEQ [63] is a method that relies on the almost unique nature of clonal TCR rear-rangements within a sample. The cells in a sample are split into multiple subsets andα
andβ chains present in each subset are sequenced following a standard TCR sequenc-ing protocol. Theαandβ chains that were present together in a cell should then appear
in the sequence data from the same subsets, and from no other subsets. In this manner a combinatoral approach can be used to identify theα β pairings present in the sample,
1.2. TCR repertoire sequencing and analysis pipeline 26
1.2.2
Processing of HTS TCR data
After TCR molecules have been sequenced, the sequence data needs to be processed into a usable form before further analysis can be performed. The data processing can be thought of as having three steps: (i) identification of the TCR clone (either at the rearrangement-event level or the CDR3 level) in each sequence read, (ii) sequence error correction and (iii) quantification of clone sizes.
1.2.2.1
Identifying clonotypes from sequence data
In order to perform analyses of the TCR repertoire from HTS data, first the receptor rearrangements, or the CDR3 sequences, corresponding to each sequence read need to be identified. For applications of HTS to germline encoded products, the identifica-tion of the relevant biological product in sequence data is a relatively straightforward sequence alignment problem, only made difficult by the quantity of sequence reads involved. Techniques such as NCBI’s BLAST and its extensions allow for rapid iden-tification of the portion of the genome that a sequence read covers.
In order to identify the TCR rearrangement present in a sequence read, the read needs to be matched to one of a number of V genes, which have very similar nucleotide strings, and to one of a number of J genes which also have high similarity. Additionally, the sequence data from the TCR rearrangement will contain an unknown number of non-templated nucleotides for which no alignment to a genome is possible. Both of these features make it more difficult to identify the appropriate TCR rearrangement for each sequence read, and more diffcult to correct sequence error.
The common approach to this problem is to determine the rearrangement events that a sequence read represents by first identifying the constituent V and J genes. Once these have been decided then the number of nucleotide deletions and non-germline insertions can be predicted and the nucleotide or amino acid sequence of the CDR3 determined. Methods for identifying the genes present in a TCR sequence read are discussed below. It should be noted that the identification of the rearrangement that occurred in the de-veloping thymocyte to produce a particular TCR is not a trivial problem because it is
1.2. TCR repertoire sequencing and analysis pipeline 27 apparent that there is not a one-to-one relationship between rearrangement event and sequenced TCR: the same nucleotide sequence can be created using different V or J gene segments, different numbers of nucleotide deletions and different non-templated nucleotide additions. This is referred to as ‘convergent recombination’ and in [42] probabilistic models are used to infer likely rearrangement events from observed nu-cleotide sequences. If the sequenced TCR data is being used to infer properties of the rearrangment mechanism in developing thymocytes the probability of each of the pos-sible rearrangement events is important to consider. However, if the characteristics of the existing TCR CDR3 repertoire are being investigated it may be sufficient to assign each sequence read to just one possible rearrangement event.
In order to determine the V and J genes present in the sequence read, some form of string-matching algorithm is needed. Many pipelines make use of pairwise local align-ment algorithms to obtain a score for each possible gene and assign the read to the high-est scoring alignment (e.g. [85, 155]). IMGT/HighV-QUEST [5] is a high-throughput implementation of IMGT/V-QUEST [26] in which assignment of gene segments to sequence reads is performed by pairwise alignment techniques. It can be accessed through a web-based interface, and is used in a number of studies including [86, 151].
Alternatives to pairwise alignment are also used to identify V and J genes within a TCR sequence read. MiTCR [21] is software that assigns gene segments to high-throughput TCR sequencing data by first searching for pre-specified ‘seed’ n-mers (generally cov-ering the ends of the CDR3 region from each gene segment) in the sequence read and then attempting to extend the alignments to identify the genes that are present, with each potential gene segment being given an aligment score. In our lab, Decombina-tor [145] is used to process HTS TCR data. DecombinaDecombina-tor utilises the Aho-Corasick algorithm [3] which constructs a finite state machine to enable efficient searching of all sequence reads to look for instances of a set of ‘tags’ which uniquely define the possible V and J gene segments.
1.2. TCR repertoire sequencing and analysis pipeline 28
1.2.2.2
Sequence error correction
The presence of erroneous base pair calls in sequence data due to PCR or sequencer error is a substantial issue, with up to 6% error being observed [113]. Different ap-proaches can be taken to try to minimise the impact of this sequence error on repertoire analysis. Common approaches are outlined below.
Sequence reads in fastq format come with an attached quality score for each base-pair, indicating the probablity of a correct basepair call. Many groups apply a filter to sequence reads depending on this quality score, either requiring a minimum average quality over all base pairs or a minimum per-base quality required. It is also possible to incorporate the quality scores into the assignment of V/J genes, allowing for mis-matches where quality score is low [155]. In addition, many analysis pipelines choose to discard any read where there is an uncalled basepair, any read which is out-of-frame, or any read which does not contain the C-region primer or the expected multiplexing index (e.g. [79, 151]).
After assignment of V/J genes and identification of the CDR3 contained in each read, some groups restrict which TCR clones are taken forward for further analysis by dis-carding ‘small’ clones, considered to be prone to being counted as a distinct clone due to sequence error rather than a true biological difference. Those clones which are dis-carded as being ‘small’ can be defined in a number of ways. Often, clones that appear below a certain number of times are discarded automatically, and in [164] those clones which appear below 0.5בcoverage’ are abandoned, where coverage is defined as the average number of annotated sequence reads per cell of input material. Alternatively, in [156], only those largest clones which account for 96% of the sequence reads are retained, where 96% has been determined to be the ‘best’ cutoff to remove error by analysis of the J genes in each sequence.
Instead of discarding sequences containing error, and therefore potentially losing quan-tification information regarding the clones, another approach commonly used is to group the reads from the same clones and then incorporate satellite reads into larger clones (or discard the smaller clones) according to some algorithm. [124] uses a near-est neighbour algorithm to group reads together into a single clone, while [164] discards
1.2. TCR repertoire sequencing and analysis pipeline 29 small groups of reads if they are different from a larger group in just one position in the CDR3 and if the number of reads in the smaller clone is<5% of the number of reads in the larger clone.
In [22] an error correction algorithm is proposed that starts with creating groups of ‘core’ clonotypes, containing reads with high quality sequences and identical CDR3s. To correct for errors from the sequencing machine, low quality reads are mapped to these core clonotypes with mismatches allowed in positions where the sequence quality is low. Then, to correct for errors introduced during PCR, sequence reads are grouped into larger clonotypes if the only mismatches are in the V or J regions. This approach has been packaged into a piece of software, MiTCR [21].
1.2.2.3
Quantification of clone sizes
Many analyses of TCR sequence data are interested in the size of different clones, both relative to other clones in the same sample or relative to the same clone in a different sample either from a different individual or at a different time.
Simply counting the number of times each TCR clone or each CDR3 appears in a sample, after correction for sequence error using one of the methods described above, can give an estimate of clone size in the sample, but it is important to consider the effect of the starting material choice on the interpretation of this number. Sequencing from gDNA ensures that one copy of the rearranged TCR is observed per cell in the sample, whereas there are multiple copies of mRNA per cell. Observations from our group have suggested that the number of TCR mRNA molecules per cell are in the range 1 - 10 and it has been suggested that the per cell TCR mRNA count may vary with antigenic stimulation [114]. If we can assume that mRNA levels are relatively stable within a cell and consistent between cells in a sample then counts of sequenced mRNA molecules are a proxy for clone size in the same way that sequenced gDNA molecules are, otherwise counts of mRNA molecules should be interpreted as a function of clone size and receptor expression levels.
Protocols that use panels of PCR primers against the V and/or J genes need to account for the potential primer bias that these could introduce. In [111] the bias resulting from
1.2. TCR repertoire sequencing and analysis pipeline 30 PCR using a panel of V region primers is corrected for via a probabilistic method of normalising clone size in sequence data based on sequencing of a synthetic libary of TCRs. In [30], synthetic templates are used to measure the bias in PCR using panels of primers against both the V and J regions. It is found that each gene region has a biased amplification but that there is no interaction between the two gene segements, and an optimal primer mix, minimising the PCR primer biases, is found through titration experiments. The residual bias using this optimised primer mix is measured using the synthetic library and this gives a set of normalisation factors which are then applied to sequenced TCR repertoire data.
Quantification of clone size is also complicated by the inherent stochasticity of the PCR amplification process. Efficiency of amplification by PCR depends on a number of factors, including the GC content of the template. In a heterogenous mix of template, such as a sample of the TCR repertoire, it can’t be assumed that each initial template molecule will amplify at the same rate. Additionally, the stochasticity of the PCR produces a certain amount of noise in the amplified sample. In an experiment where the same sample of T cells in blood is split into two and each is amplified under the same conditions [124] the observed clone sizes in the two split samples are seen to be relatively uncorrelated for ‘small’ clones (observed<100 copies per sample).
Given this observed heterogeneity, the amplified pool of molecules that are sequenced may not be quantitatively representative of the original sample which might affect con-clusions drawn from analysis of the data. In order to account for this heterogeneity, some antigen receptor sequencing studies implement a unique molecular barcoding ap-proach where each molecule in the initial sample is uniquely tagged with a nucleotide string. The particular techniques used to label molecules are discussed in Chapter 2. The unique barcodes allows reads from the final sequencer output to be clustered ac-cording to which initial molecule they are derived from, meaning that variable PCR amplification efficiency can be corrected for and a more accurate estimate of initial clone size can be obtained.
In Chapter 2 we investigate the bias that PCR amplification heterogenity might intro-duce into TCR repertoire sequence data and suggest that single molecule barcoding is
1.3. Analysis of TCR repertoire sequence data 31 vital to ensure quantitative analyses are robust.
1.3
Analysis of TCR repertoire sequence data
Many studies inferring properties of the immune system from TCR repertoire sequenc-ing data can be thought of either as studies into the system-level properties of the T cell population at steady state or under immune challenge, or as studies attempting to identify characteristics of an antigen specific response in the repertoire. We discuss both of these approaches to the study of the TCR repertoire below.
1.3.1
Global properties of the TCR repertoire
Global properties of the TCR repertoire (including diversity, gene segment usage dis-tributions, and repertoire similarity between different samples) are often analysed as indicators of the health, effectiveness or immunocompetence of the T cell population. Many studies consider the TCR repertoire of healthy individuals, to gain insight into the mechanics of the formation of the repertoire or the baseline state of the repertoire, while others consider the repertoire in various disease settings.
1.3.1.1
Diversity: richness and evenness
Many early TCR repertoire studies focussed on estimating the diversity of the repertoire in a healthy individual and additional studies have considered the effect of immune challenge on the diversity of the repertoire, to measure how disease disrupts the T cell population.
Diversity of the repertoire can be thought of in a number of ways, and can be quanti-fied using a number of measures. Two facets of diversity are ‘richness’ and ‘evenness’, and most measures of diversity combine both of these. The richness of a repertoire describes how many clones are present in a sample. This can most simply be measured by counting the observed clones and comparing this number between samples. How-ever this number will depend both on sample size, since the number of small clones that are observed will be affected by sampling, and on sequencing depth, since not all
1.3. Analysis of TCR repertoire sequence data 32 clones present may be sequenced. The evenness of a repertoire describes how uniform the abundance of the different clones are within the population.
The estimated richness of the TCR repertoire in a healthy individual is discussed in Section 1.1.2, and in [79] it is found that the memory compartment is approximately half as diverse (in terms of TCR richness) as the naive compartment in CD4+ T cells, and between 1/3 and 1/10 as rich in CD8+T cells.
The evenness of a TCR repertoire is measured in many studies using the Gini index, an equality measure commonly used in economics and social sciences which describes how equally a resource is distributed amongst a population. A Gini index of zero corre-sponds to a completely equal distribution of resources and a value of one correcorre-sponds to a maximally unequal distribution. In the case of TCR repertoires, it can quantify whether a population is dominated by a few large clones or if most of the clonotypes are of equal size.
A number of diversity metrics, often borrowed from other disciplines, are used in this work and in other studies to describe and compare the diversity (combining richness and evenness) of sequenced TCR repertoires. The Shannon Index, or Shannon Entropy, was first developed with reference to the information in strings of text. In the context of TCR repertoires, it can be thought of as describing the uncertainty involved in predicting what clone a randomly selected read will belong to and is calculated as:
H0=−
R
∑
i=1 pilnpi
whereRis the number of different clones observed andpiis the proportional abundance of theith clone. Sometimes the Shannon Entropy is normalised by dividing by the log of the number of observed clones. Another metric of diversity is the Simpson Index, which calculates the probability that two TCRs, selected at random from a dataset, are of the same clone:
λ = R
∑
i=1 p2i
In a highly diverse sample the Simpson Index gives very small values so often the inverse Simpson, 1/λ is quoted.
1.3. Analysis of TCR repertoire sequence data 33
1.3.1.2
Recombination biases
In [102], many examples of pre-HTS studies demonstrating biases in the recombination of TCRs are reviewed, including studies showing that different promoter sequences upstream of V genes affect the rates at which each is expressed and showing that there is preferential pairing between V and D/J gene segments. All of the biases in the recombination machinery result in non-uniform probabilities for each of the potential TCRs to be rearranged, reducing the diversity of the repertoire.
In [108] a comprehensive study of the recombination events in non-productive rear-rangements (to avoid effects of selection) from HTS data of the TCRβ repertoire is un-dertaken to understand biases in the rearrangement of TCRs. The probabilitistic prop-erties of the recombination process are inferred, using a maximum likelihood approach since single multiple recombination events can lead to the same nucleotide sequence. It is found that the frequencies of V and J genes vary significantly (as many other studies have found and in [111] is attributed to the physical conformation of chromatin), but interestingly no dependence between V choice and J choice was observed, suggesting that previously reported correlations might be a function of selection pressure rather than the recombination process. It is found that the number of deletions from the V and J genes is dependent on the gene used, while the VD and DJ insertions are uncor-related to each other, and the probability of a particular nucleotide insertion depends strongly on the 5’ nucleotide. The derived probabilities are remarkably consistent be-tween individuals, with the greatest variability seen in the gene usage probabilities. This consistent probabilistic model of recombination both reduces the potential reper-toire diversity and is able to account for the number of sequences shared between two individuals.
1.3.1.3
Repertoire similarity and public clonotypes
Given the massive amount of potential diversity in the TCR repertoire, it might be ex-pected that no identical TCRs are shared between two individuals. However, the biased nature of the recombination machinery, as well as the requirements for a TCR to be functional and able to recognise peptide fragments presented in MHC molecules,
im-1.3. Analysis of TCR repertoire sequence data 34 pose limits on diversity and suggest that the same TCR may be generated and selected in multiple individuals. Clonotypes shared between many individuals are described as ‘public’, and have been consistently observed in HTS TCR repertoire data. The extent that public clones arise simply due to highly probable recombination events or whether convergent selection (either thymic or post thymic) is required to explain their presence remains unclear.
The overlap between the sets of clones observed in two samples is often calculated as a metric of repertoire similarity between two individuals or between two samples from the same individual. The Jaccard Index is defined as the size of the intersection between two sets divided by the size of the union i.e. J(x,y) = |∩|∪(x,y)(x,y)||. In terms of TCR reper-toire, it calculates the proportion of distinct clones (total observed across either sample) that are observed in both samples. In some studies an extension to this similarity met-ric is used, where the abundances of the clones each of the samples are used to weight the Jaccard to give more importance to highly abundant clones. Alternatively, the Bat-tacharyya coefficient is another measure of the similarity of two sets which takes into account the clonal abundances, and is calculated asBC(x,y) =∑i
√
xiyiover all clones ipresent in either sample, where xi,yi are the abundances of clonei in the respective samples.
In [126], the naive CD8+ subsets of TCRβ sequences are compared for every pair of seven individuals, finding at least 100,000 CDR3βs shared between each pair,
includ-ing a pair with no shared HLA alleles. The sharinclud-ing within the memory compartment was smaller, although there were still at least 1000 shared CDR3βs found between each
pair. The number of shared sequences in the naive compartments for a pair of individu-als agrees well to the prediction made via a model of biased VDJ recombination. In the same vein, [156] finds that in a pair of HLA-matched individuals, approximately 14% of the CDR3β repertoire is shared. Shared TCRβs were found to tend to have a shorter
CDR3 length as well as being more abundant than private sequences.
In another study considering the overlap in TCR repertoires, the naive and memory compartments in four individuals [153] were sequenced. In this study, a lower amount of sharing was observed, with less than 10% of the unique TCRβ amino acid sequences
1.3. Analysis of TCR repertoire sequence data 35 from one individual being shared with another individual. The abundance of the clone was again found to be correlated to sharing, both between subsets and between indi-viduals, showing that public clonotypes are more abundant. In [42], models of V(D)J recombination suggest that observed public sequences are due to chance during the bi-ased recombination process rather than any convergent selection. It has been suggested that public clonotypes might be involved in autoimmune responses [91] but the function of these T cells is still not fully understood.
In a study of antigen-specific T cells in mice, analysis of tetramer-sorted influenza CD8+ T cells [152] from C57BL/6J mice also showed that highly shared identical sequences (with identity being defined as Vβ, Jβ and CDR3β amino acid sequence
matches) have fewer nucleotide additions, and highly shared sequences are present with more different encoding nucleotide sequences, suggesting a high level of convergent recombination. A similar finding is demonstrated in full repertoire analysis (rather than just within a tetramer positive subset) in [91].
1.3.1.4
Perturbations to the TCR repertoire in disease
Diversity and disease
The diversity of the response to a particular pathogen is thought to be related to disease outcome. C57BL/6 mice infected with a herpesvirus (HVH-1) have a poorer survival rate than mice (referred to as ‘bm8’ mice) that differ in the MHC class I molecule by 4 amino acids within the peptide binding site [100]. This difference is found to be CD8+ T cell dependent, and the T cell response of C57BL/6 mice mostly utilises TCRs of the Vβ10 and Vβ8 families, while the bm8 mice use a broader range of Vβ families, and more diverse clonotypes within the families.
In [88], spectratyping of the TCR repertoire is used to show that TB patients have a more restricted repertoire than healthy volunteers, and the complexity of a patient’s repertoire is negatively correlated with their disease severity, suggesting that a diverse TCR repertoire may be required for control of disease.
1.3. Analysis of TCR repertoire sequence data 36 In a study of the TCR repertoire in peripheral blood of patients undergoing anti-CTLA4 treatment (tremelimumab) for cancer it was shown that there was a significant increase in richness (measured by the absolute number of TCR rearrangements observed) after treatment for the majority of patients [122]. However, there did not appear to be a change in the distribution of the repertoire, as measured by Pielou’s evenness index. The increase in richness was not correlated to the response of the patient to treatment, but those patients with most increased richness were those that experienced most tox-icity, leading to the suggestion that the increase in richness of the repertoire might be non-specific expansions, perhaps related to autoimmune clones, rather than expansion of clones against the cancer.
The TCR response to anti-PD1 treatment (pembrolizumab) for metastatic melanoma is considered in [147]. Regression of tumours is found to be associated with proliferating CD8+ T cells localising to the tumour, and when theβ chains of the TCRs present in
the tumour pre-treatment are sequenced it’s found that a higher ‘clonality’ is indicative of a better response on treatment. In this study, the clonality metric is calculated as 1−
normalised entropy, where normalised entropy is the Shannon entropy divided by the log of the number of different clones observed. In the same study, comparison of the TCRβ clone sizes pre- and during treatment shows that the patients that successfully respond to the anti-PD1 treatment have 10×more clones expanding during therapy.
A HTS TCR study of patient samples following haematopoietic stem cell transplanta-tion (‘HSCT’) [151] showed that TCR repertoire diversity, as measured by the inverse Shannon, was reduced in comparison to healthy volunteers following transplant with a T cell depleted graft and even a year after treatment the population diversity had not recovered. However, this appears to be dependent on whether CD4+ or CD8+ cells are considered. The T cell repertoires in patients receiving T-cell depleted autologous stem cell transplants to treat systemic juvenile idiopathic arthritis are studied in [161]. Spectratyping showed that the diversity in the CD4+ TCRβ repertoire is restored by 12 months after transplant, while diversity is only restored in some of the CD8+ Vβ
families by the same time point. High throughput sequencing of samples indicates that some clones appear to survive the conditioning process, or are grafted back into the patient during transplant.
1.3. Analysis of TCR repertoire sequence data 37 In work from our lab [59], the TCR repertoire in HIV+ patients before and during an-tiretroviral treatment (‘ART’) was studied, showing that HIV+ patients have a perturbed repertoire, with much lower diversity than healthy controls and that this is not restored after three months of ART despite viral loads becoming undetectable.
TCR repertoire sequencing providing insights into disease mechanism
In a study of TCR repertoire in colorectal tumours [131] it is seen that although the absolute diversity (the number of distinct TCR clones observed) is similar between tumour and nearby mucosal tissue from the same patient, the normalised Shannon is higher in the tumour. This suggests that the repertoire present in the tumour is less polyclonal than that found in surrounding tissue, perhaps due to antigen specific T cell recruitment to the tumour or retention in the tumour. However, the amount of repertoire overlap between tumour and nearby tissue in this study was not related to the physical distance between the two samples. Additionally no differences in V and J gene usage or CDR3 length were found between tumour and nearby tissue repertoires, suggesting that the observed difference in normalised Shannon cannot be fully explained by a skewed repertoire at the global level.
In a study considering the repertoire in patients with rheumatoid arthritis, samples were taken from multiple affected joints as well as from blood [78]. The highly expanded clones are shared between different affected joints in a patient, but are not shared be-tween joints and blood, again suggesting antigen specific recruitment or retention.
In a study of the repertoire in ovarian cancer [44], multiple samples from primary tu-mour, metastatic sites and blood are taken from each patient. A weighted Jaccard approach is taken to measure the similarity between repertoires observed at different sites, and it is found that within a single metastatic site the repertoire is very similar, but between a metastatic site and the primary tumour there is less similarity. All the repertoires from tumour samples show little similarity to the repertoire in blood.
1.3. Analysis of TCR repertoire sequence data 38
1.3.2
Antigen specific T cells
The global properties of the whole TCR repertoire are able to provide information regarding the status of the immune system, as discussed above, but considering the properties of the individual T cells that comprise the immune response to a particu-lar antigen can provide additional information regarding disease status, correlates of protection and patient stratification. Even when an epitope (a specific peptide/MHC complex) is known, it is not currently known how to map this to the TCRs that will recognise it, and in many disease situations the antigenic peptide is unknown or prone to mutations. As such, experimental techniques to identify, isolate and sequence re-sponsive T cells are used in many studies to answer questions regarding the magnitude, breadth and effectiveness of the T cell response.
Identification and tracking of antigen specific clones in diagnosis and treatment
One of the first applications of HTS of TCRs was in T cell leukaemias, where T cell clonal expansion occurs independent of antigen. In the context of cutaneous T cell lymphoma (‘CTCL’), the TCRβ and TCRγ repertoire is sequenced from punch biopsies [76], demonstrating that the normalised entropy (referred to as the ‘clonality’) of the full repertoire is correlated with disease severity, with the biopsies from more advanced disease having a less polyclonal repertoire. This study also showed that the repertoire in a skin lesion from a patient with CTCL is dominated by the single malignant TCRβ clone. This is also the case in other diseases, such as psoriasis and dermatitis, but is more severe in CTCL and the proportion of the repertoire occupied by the largest clone can distinguish between CTCL and other skin conditions. The malignant clone in CTCL patients could be tracked over time and in multiple sites in the same patient, informing clinical treatment, for instance in one patient recurrence of disease after stem cell transplant was identified rapidly by sequencing of the same malignant clone in a skin lesion, allowing prompt treatment. Similarly, identification of a single clonally expanded TCRγ in patients with mycosis fungoides was found to be a more sensitive diagnostic than the current standard, suggesting this could be used to inform earlier or more accurate clinical diagnosis [140].
1.3. Analysis of TCR repertoire sequence data 39 (‘MRD’) in patients with acute T lymphoblastic leukemia (‘T-ALL’) [160]. Here, pre-treatment HTS TCR samples were used to identify the TCR sequence of the patients’ neoplastic T lymphoblast clones, and HTS of TCR repertoire was then able to detect MRD in post-transplant samples with more sensitivity than the commonly used flow cytometric method. A more recent study [87] has sequenced both TCR and Ig to quan-tify MRD in blood samples from B-ALL patients undergoing allo-HCT treatment. The quantified level of MRD in pre-conditioning samples is predictive of transplantation failure, while MRD quantified above a particular threshold in a post-transplant sam-ple was 100% positively predictive of eventual relapse. However, patients with MRD quantified below the threshold did not all avoid relapse. These studies suggest that TCR and Ig HTS data could inform clinical intervention before symptoms of relapse present clinically and therefore improve patient outcome.
Graft vs host disease (‘GvHD’) is a frequent complication after bone marrow transpla-tion, and is the result of inappropriate immune response against unknown self antigens. The standard approach is to treat with steroids, but some patients are not responsive. The TCR repertoire in the blood of GvHD patients, after HSCT, does not predict pa-tients which respond to steroid treatment [101]. Instead, a method tracking particular clones in patients over a timecourse was developed. Patient specific ‘indicator clones’ were identified as the largest clones in a pre-treatment sample from diseased tissue. Then the number of indicator clones in blood after 30 days of steroid treatment is re-lated to the success of treatment, with the patients who require secondary treatment being those that have fewest present.
Properties of antigen-specific clones
In [81], various functional assays of T cell responses to a CMV peptide are used to sort CMV responsive from CMV non-responsive cells. The TCR repertoires of the unsorted cells as well as the CMV responsive and CMV non-responsive subsets are sequenced. For each of the functional assays considered, those clonotypes that are highly enriched in the CMV responsive sample above the unsorted and CMV non-responsive samples are taken to be CMV specific. There is good overlap in the sequences defined as CMV specific in the sequence data from pentamer staining, CD137 and CD107 functional
1.3. Analysis of TCR repertoire sequence data 40 assays, showing that the same clones are responsive under different functional tests. In addition, using CFSE staining as the functional assay allows identification of CMV specific TCRs that are initially present at low frequency but proliferate strongly in the presence of antigen, which are otherwise lost in the sequence analysis technique pre-sented in the study. It is found that sets of CMV specific TCRs identified using the combination of functional assay and HTS demonstrate sequence-level similarity be-tween themselves and with previously described CMV responsive clones. However, whether there is a sequence-level motif of CMV-specificity that is strong enough to predict whether a cell will respond to antigen is not explored in this study.
The repertoire of tumour infiltrating lymphocytes (‘TILs’) in melanoma is studied in [53], and the properties of those TILs that are tumour-reactive are explored. The tumour-reactive CD8+ TILs are differentiated from other TILs by PD-1 expression, and PD-1 positive TILs have a more skewed TCR repertoire, with the repertoire be-ing more dominated by a few large clones, than other TIL subsets. The thirty most frequent PD-1+ TILs occupy over half of the subset, while the equivalent in the PD-1− subset is just 5%. Additionally, within the most frequent PD-1+ TILs are found known mutation-specific clonotypes, while these clonotypes are only found at lower frequency in the PD-1− subset. This study therefore suggests that PD-1 expressing abundant clones may represent tumour-reactive TILs.
MHC alleles HLA-B*27 and HLA-B*57 have been associated with ability to control viral load of HIV, but most people expressing these molecules are unable to control viral load without treatment. In [33], the differences between T cells from people who express HLA-B*2705 and are either able (controllers) or unable (progressors) to control HIV load without treatment are studied. A dominant epitop
![Figure 1.1: TCR structure and recognition of peptide-MHC complexes All panels taken from [107]](https://thumb-us.123doks.com/thumbv2/123dok_us/529368.2562362/15.892.195.748.135.772/figure-tcr-structure-recognition-peptide-complexes-panels-taken.webp)