Appreciating the Renminbi
Rod Tyers and Iain Bain College of Business and Economics
Australian National University Working Paper No: 483
ISBN: 086831 483 8 July 2007
Key words:
Chinese economy, real exchange rate, economic growth, productivity JEL codes:
C68, C53, E27, F21, F43, F47, O11
*
Funding for the research described in this paper is from Australian Research Council Discovery Grant No.DP0557889. Thanks are due to Jane Golley, Bu Yongxiang, Huang Yiping, Ross Garnaut and Wing Thye Woo for useful discussions on the topic and to Hsu Pingkun for research assistance.Appreciating the Renminbi
Abstract
International pressure to revalue China’s currency stems in part from the expectation that rapid economic growth should be associated with an underlying real exchange rate appreciation. This hinges on the Balassa-Samuelson hypothesis, which sees growth as stemming from improvements in traded sector productivity and associated rises in wages and non-traded prices. Yet, while evidence on China’s productivity and prices supports this hypothesis, its real exchange rate has shown no long run tendency to appreciate. The use of a global numerical model allows extensions of the hypothesis, including failures of the law of one price for tradable goods, which point to WTO accession trade reforms and China’s high saving rate as key depreciating forces since the late 1990s. With a continuing flat trajectory for the underlying real exchange rate in prospect, the same model is then applied to the implications of premature nominal (renminbi) appreciation. It is shown that, unless this is achieved in association with the repatriation of foreign reserves, which would require thus far unavailable financial depth in the Chinese economy, unilateral RMB appreciation would be destructive of both Chinese and global interests.
1 Introduction
China’s apparently low Renminbi (RMB) is now very prominent in political debates over current account imbalances. This is particularly so in the US, where the Congress is
considering a draft bill to penalise China unless it revalues.i In more scholarly circles, while a few, including McKinnon (2006), argue that a RMB appreciation would not address the imbalances of concern to the US, numerous studies have supported the view that the currency is undervalued, by margins ranging from ‘small’ to as high as 50%,ii and a number conclude that a unilateral appreciation of the RMB is essential.iii Expectations that China’s underlying real exchange rate should be appreciating are based commonly on the Balassa (1964) – Samuelson (1964) hypothesis. This implies a positive relationship between economic growth and the underlying real exchange rate, driven by productivity catch-up in developing
countries’ tradable sectors and, in association, rising wages and prices in their non-traded sectors. Evidence in support of these suppositions in the case of China lends weight to the expectation that the real exchange rate should be appreciating.iv Yet, during the decade and a half to 2006, when the economy grew at between eight and ten per cent per year, there was no significant long term appreciating trend.
The resolution of this puzzle requires a number of generalisations of the Balassa-Samuelson hypothesis; most significant amongst which is the relaxation of the assumption that the law of one price applies for all traded goods. This greatly broadens the set of determinants of the real exchange rate. Although productivity changes are influential in the medium to long run,
so also are factor endowment changes, such as relative labour force growth, and demand switching policy reforms, such as trade liberalisation. For similar reasons, short run
movements in the real exchange rate prove to be dominated by financial flows on the balance of payments. Thus, the net effect of China’s rapid economic growth on its real exchange rate depends on the sources of that growth and the consequent pattern of endowment changes and sectoral distributions of productivity growth and tradability. Of considerable importance in resolving the puzzle is the short run impact of China’s widening current account surplus, which stems from its extraordinarily high total saving rate.
This paper summarises recent research on the reasons for China’s stable real exchange rate, including modelling work that apportions changes since the 1990s amongst the strongest appreciating and depreciating forces. The role of China’s macroeconomic policy regime is then reviewed. It is argued that this regime is not mercantilist but rather averse to the exchange rate volatility that could stem from premature financial liberalisation while legal and institutional reforms to the commercial banking system are incomplete. While ever the underlying real exchange rate is stable, nominal appreciations are undesirably deflationary and so the central bank maintains a correspondingly stable nominal exchange rate. Beyond this, a central plank of the stabilising regime is capital controls, from which stem the other controversial element of China’s macroeconomic policy, its accumulation of foreign reserves. Their growth is forced by high savings, which cause China’s current account surplus, and the capital controls, which constrain the interest of commercial banks in foreign currency. Finally, the US pressure for faster RMB appreciation is discussed and further global
modelling is applied to the issue. Were it possible to relax the capital controls more quickly, reserve accumulation could slow as private holdings of foreign assets grow. Reserve
management could then bring about an underlying real appreciation, which would make an orderly RMB revaluation relatively easy. Without this, however, a premature appreciation, brought about solely via a monetary tightening, would prove to be very contractionary in China and generally deleterious to the rest of the world. An alternative approach would be for China to use border distortions like an export tax on manufactures. This proves also to be contractionary in China and undesirable for its trading partners. Moreover, interestingly, it would not necessarily narrow China’s current account surplus. The gradualism preferred by the Peoples Bank of China (PBC) is therefore supported.
The next section briefly reviews China’s real exchange rate puzzle and its resolution. A more general treatment of real exchange rate determination is then offered in Section 3, where
elasticities to various determinants are calculated using a simulation model of the global economy and this model is used to decompose the path of China’s real exchange rate 1997-2006 in search of the strongest appreciating and depreciating forces. The role of China’s macroeconomic policy is discussed in Section 4 and scenarios for short term appreciation of the RMB are offered in Section 5. General conclusions and policy implications are presented in Section 6.
2 China’s real exchange rate puzzle
If the nominal exchange rate, E, is defined as the number of units of foreign exchange obtained for a unit of the domestic currency, the real exchange rate, eR, can be defined correspondingly as the rate of exchange between the home product bundle and corresponding bundles produced abroad. It follows that the bilateral real exchange rate for a focus (home) country with foreign trading partner i can be approximated as the common currency ratio of the gross domestic product (GDP) prices (deflators) of the two countries, PY
(
pN,pT)
and(
,)
/Y N T
i i i i
P p p E, where pTand pN are indices over all the focus country’s non-traded and traded goods and services, respectively.v
(1)
(
)
(
, ,)
/(
(
,,)
)
Y N T Y N T R i Y N T i Y N T i i i i i i i P p p P p p e E P p p E P p p = =This is the fundamental relationship between the real and nominal exchange rates. Consider the case in which prices at home and abroad are measured in a common currency, the share of non-traded products in GDP, θ, is the same at home and abroad, prices are aggregated
appropriately using a Cobb-Douglas index and the law of one price applies to all traded goods. The latter implies that trade is costless and undistorted, so that T T
i
p = p . Under these conditions, the real exchange rate becomes
(2)
( ) ( )
( ) ( )
1 1 N T N R N T N i i i p p p e p p p θ θ θ θ θ − − ⎛ ⎞ = = ⎜ ⎟ ⎝ ⎠From this, the key role of non-traded goods prices is clear. When prices are measured in a common currency, or relative to a common numeraire, it is the ratio of the home and foreign non-traded goods prices that matters in determining the real exchange rate.
To illustrate the associated dependence on productivity, imagine that labour is the single fixed factor and that the rates of output per worker in the home traded and non-traded sectors are
T
A and AN. In trading partner i, the corresponding rates are T i
A and N i
A . The relationships between the wage rate and product prices in the traded and non-traded sectors follow from equating the wage in both sectors with the values of the marginal products of labour in each:
,
T T N N T T N N
i i i i i
W = A P =A P W = A P = A P , from which it follows that the divergence in wage rates between trading partners depends only on their tradable productivities: T T
i i
W W =A A . If the non-traded productivity level is the same in all trading partners ( N N
i A =A ∀i), we then have that (3) NN TT i i i P A W P = A =W and N T R i N T i i i p A W e p A W θ θ θ ⎛ ⎞ ⎛ ⎞ ⎛ ⎞ =⎜ ⎟ =⎜ ⎟ =⎜ ⎟ ⎝ ⎠ ⎝ ⎠ ⎝ ⎠ .
Under the assumptions of the Balassa-Samuelson hypothesis, then, an economy that is growing faster than its trading partners also has 1) faster tradable productivity growth ( ˆT ˆT
i
A >A ), 2) faster wage growth ( ˆW W> ˆi), 3) relative service price inflation ( ˆN ˆN i
p > p ), and 4) an appreciating real exchange rate ( ˆeR >0). The hypothesis then implies that, if
developing countries are poorer because their tradable labour productivity is lower, then their comparatively rapid growth should be associated with real appreciations against their richer trading partners.
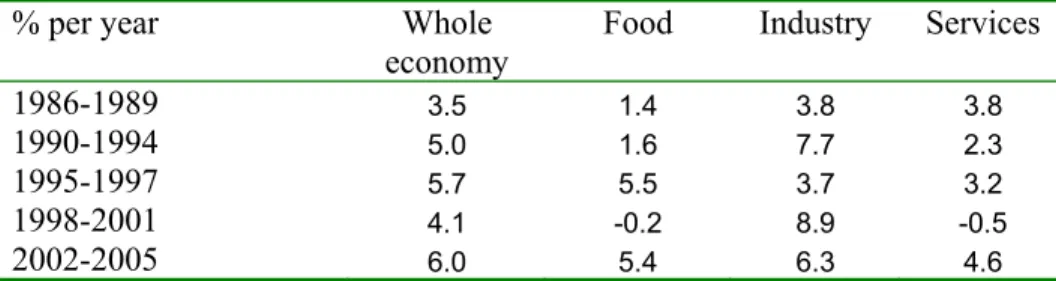
Support for the hypothesis requires, however, that all four of its predictions be observed. For the case of China, that about productivity is examined by Tyers et al. (2006) by deriving Solow residuals for the economy as a whole and for three sectors: ‘Food’, ‘Industry’ and ‘Services’. They adjust the officially published urban employment data for its omission of the floating or non-hukou population, following Cai and Wang (2006).vi The average annual changes in the Solow residuals for each sector that emerge from this analysis are given in Table 1. These show strong productivity performance by the Chinese economy since the mid 1980s, with a slow-down in the 1998–2001 period associated with the East Asian financial crisis. Consistent with other studies by Lu (2006) and Fogel (2006), productivity growth appears to have been strongest in the export orientated industrial sector and weakest in the largely non-traded service sector.vii When it is borne in mind that US productivity growth during the past decade has averaged no higher than three per cent per year (Gordon 2003, 2006, 2007), China’s tradable productivity growth has clearly been comparatively high.
The second prediction, that of faster wage growth, is also supported by the data, as evidenced by the summary of sectoral real wage growth statistics in Garnaut and Huang (2007: Table 2.2). In 2000-2005, real wages grew on average by 9.9 per cent per year for rural workers and 12.5 per cent per year for manufacturing workers. The third, that of relative service price inflation, is also consistent with the BSH, as indicated in Figure 1. The prices of construction and other services have clearly risen faster than the GDP price since 1990. Yet, as shown in Figure 2, no such appreciating trend has emerged. Indeed, as shown in Figure 3, if producer prices are compared between China and the US, a real depreciating trend is shown in the same period.
3 Determinants of the path of China’s real exchange rate
The resolution of China’s real exchange rate puzzle is to be found in the BSH assumptions. We begin with a critique of these and go on to analyse the wider determinants of real exchange rate movements using a numerical model of the global economy. Finally, we use that model to decompose the forces affecting it in the period 1997 to 2006.
Generalising the BSH assumptions
Tradable productivity gap: During some periods and in some developing countries,
productivity growth has been observed to be higher in the non-tradable sector,viii leading to
ˆN ˆN i
A >A and tending to depreciate the real exchange rate. Modern transport, financial, health and education services offer considerable potential for productivity catch-up. Whatever the relative performance of China’s services sector in the past, recent evidence suggests
substantial potential for catch-up and accelerated productivity growth in the future (Ma 2006). The law of one price for tradable goods: Failures of the law of one price have been observed for tradable goods in specific instances.ix Goods and services are not homogeneous across countries but are differentiated at minimum by country of origin.x Supply and/or demand side factors that raise the volume of tradable production move the home country down the global demand curves for its product varieties, reducing its supply prices and resulting in
deterioration in the terms of trade and a depreciation of its real exchange rate. Factor endowment growth and changes in policy that lead to substitution in demand for home products depreciate real exchange rates and the magnitudes of their effects depend crucially on the degree of substitutability between the differentiated products.
Labour arbitrage: In most developing economies, the marginal product of industrial labour
exceeds that of rural labour due to the more rapid accumulation of industrial capital. There is, therefore, a Harris-Todaro gulf between wages in the expanding and contracting sectors. If labour mobility between the rural and industrial sectors is inferior to that between the rural and service sectors (particularly the construction sector), then industrial productivity growth does not necessarily drive up service wages or service costs.xi
Closed capital account:xii The assumption that the real exchange rate depends only on
interactions among countries associated with trade in merchandise is clearly violated in many of today’s developing countries, and particularly in China. Its violation, in concert with failures of the law of one price for traded goods, means that any influx of payments (in the form of a foreign direct investment or portfolio capital flow) raises aggregate demand. Since traded goods are supplied more elastically via imports than are non-traded goods—which depend on home resources—such an influx must raise relative non-traded prices and therefore appreciate the real exchange rate. Conversely, effluxes will cause depreciation.
Not surprisingly then, wider empirical evidence in support of the Balassa-Samuelson
hypothesis is mixed. Choudhri and Khan (2004), for example, find favourable evidence using a small sample of developing countries that does not include mainland China, Taiwan or Hong Kong. Bergin et al. (2006) find a positive association between price levels and real per capita income that is strong only in large samples of countries. Miyajima (2005) uses a sample of 15 Organisation for Economic Cooperation and Development (OECD) countries between 1970 and 2000 to establish that the hypothesis does not always hold during growth surges, which on numerous occasions were led by productivity growth in non-traded sectors. The East Asian evidence since 1980 also appears mixed. Only Japan showed a rapid real appreciation following the demise of the Bretton Woods system in 1972 and in association with its correspondingly rapid export-led growth. The same pattern is not observed for Korea, Taiwan or for any of the larger Southeast Asian economies.xiii
Another key potential driver of China’s growth is education and training. Fogel (2006) emphasises this point, which is also well recognised by China’s leaders (as in the eleventh Five-Year Plan). He shows that increasing secondary and tertiary enrolment ratios has a sizeable impact on the per capita GDP growth rate.xiv To the extent that services are skill intensive (as they are according to past data), this will boost performance in the service sector—again, tending to depreciate China’s real exchange rate.
Allowing for failures of the law of one price for tradable goods, there are numerous other forces tending to depreciate the real exchange rate in the long term. During the past two decades one such force has been China’s ‘demographic dividend’, stemming from the high proportion of working-aged people in the total population. This, according to Cai and Wang (2005), accounted for about one-quarter of per capita GDP growth between 1980 and 2003.xv It has played a critical role in keeping wages and hence the real exchange rate low, thereby enabling the rapid expansion of labour-intensive manufactured exports. In the future, however, the ageing of the population and the consequent decline in the labour supply will have the opposite effect, placing upward pressure on real wages and the real exchange rate.xvi
Modelling the impacts of growth shocks on the real exchange rate
Here we examine quantitatively the relationship between shocks associated with China’s economic growth and its real exchange rate. To do this effectively, a numerical model is required that is global in scope and that incorporates the generalisations of the Balassa-Samuelson assumptions discussed above. Recall that these included productivity growth in non-tradable as well as tradable sectors, departures from the law of one price for tradable goods, a more sophisticated representation of the labour market and an open capital
account.xvii With these generalisations, almost all shocks to the economy have implications for the real exchange rate.
We use a multi-region, multi-product dynamic simulation model of the world economy adapted from Tyers and Shi (2007).xviii It subdivides the world into 14 regions, with China defined to include Taiwan and Hong Kong.xix Industries are aggregated into three sectors: food (agriculture, including processed foods), industry (mining and manufacturing) and services (including construction)—the latter being little traded in comparison with the other two. Failures of the law of one price are represented by product differentiation, so that consumers substitute imperfectly between products from different regions. As in other dynamic models of the global economy, the endogenous component of simulated economic growth is physical capital accumulation. Technical change is introduced in the form of exogenous productivity growth that is sector and factor specific, allowing the analysis of productivity performance that differs between tradable and non-tradable sectors. Consistent with the results indicated in Table 1 for China, baseline productivity in food sectors in most regions grows more rapidly than that in services. This allows continued shedding of labour by agriculture as part of the development process.xx
Regional capital accounts are open and investors have adaptive expectations about real regional net rates of return on installed capital. In each region, the level of investment is determined by a comparison of expected net rates of return on domestic installed capital with borrowing rates yielded by a global trust, to which each region’s saving contributes, adjusted by calibrated region-specific interest premiums. Lagged adjustment processes ensure,
however, that financial capital is not fully mobile internationally in the short term, but that the paths of domestic and global interest rates become parallel, separated only by exogenous premiums in the long term. In representing China, however, one caveat is that no explicit control is imposed on the outflow of private financial capital. General financial reform is represented by a diminution of the interest premium and this causes an unambiguous influx of financial capital to China.
To augment the model’s characterisation of changes in labour supply and quality, it encompasses demographic and economic change. It tracks populations in four age groups, two genders and two skill categories: a total of 16 population groups in each of the 14 regions. The skill subdivision is between production labour (unskilled) and professional labour
(skilled).xxi Each age–gender–skill group is represented as a homogeneous sub-population with a group-specific birth and death rate, labour force participation rate and rates of immigration and emigration. Because the non-traded sector is relatively intensive in skill, trends in skill composition prove to be particularly important. These depend on the rate at which each region’s education and social development institutions transform unskilled (production-worker) families into skilled (professional-worker) families. Each year a particular proportion of the population in each production-worker age–gender group is transferred to professional status. The initial values of these proportions depend on the regions’ levels of development, the associated capacities of their education systems and the relative sizes of their production and professional labour forces. Rates of transformation change through time in response to corresponding changes in real per capita income and the skilled wage premium.xxii
The 16 age–gender–skill groups differ in their shares of regional disposable income, consumption preferences, saving rates and labour force participation behaviour. While the consumption–savings choice differs for each group, it is dependent for all on group-specific real per capita disposable income and the regional real lending rate. Governments are assumed to balance their budgets while saving and borrowing are undertaken by the private
sector. The baseline scenario is a ‘business-as-usual’ projection of the global economy until 2030.
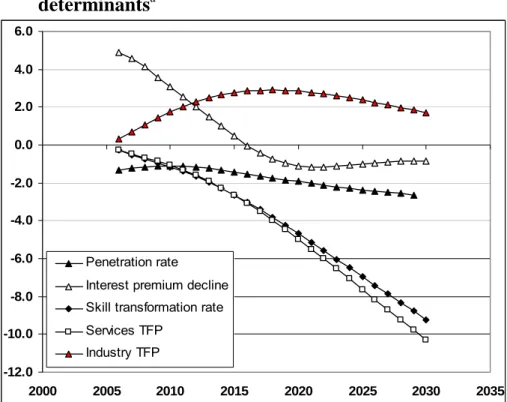
Our focus is on how shocks that enhance the rate of GDP growth impact on the real exchange rate.xxiii The most significant of these are once-and-for-all productivity increases, skill transformation rate increases, interest premium decreases (increases in net financial inflows) and tariff decreases (increases in openness). In each case, we run a new simulation in which the determinant in question is shocked once and for all, as of 2005. We then extract the elasticity of China’s real exchange rate to each shock, tracking the values through time to 2030. We focus on the bilateral real exchange rate, measured as in Equation (1), between China (including Taiwan and Hong Kong) and ‘North America’ (including Canada and Mexico), since this best parallels China’s nominal exchange rate policy and the renminbi valuation debate. The results are summarised in Figure 3.
Sectoral total factor productivity: The elasticities shown represent the percentage departure of the projected real exchange rate for each percentage per annum increase in total factor
productivity. Because manufacturing is by far the greatest contributor to China’s trade industrial productivity is more significant for the real exchange rate than that of ‘food’. The appreciating effects of tradable productivity increases are consistent with the Balassa-Samuelson hypothesis and are, as expected, due to wage growth and relative service price inflation. They are bolstered in the short term by increased investment and hence greater net inflows on the capital account. In the long term, however, the enlargement of the industrial capital stock reduces costs and hence offsets the real exchange rate gains. Also, as expected from the dominance of non-traded sector prices in Equation (2), faster service productivity growth depreciates the real exchange rate—modestly in the early years but to a dominant extent in the long term, when it is reinforced by associated capital accumulation.
Skilling of the labour force: When the skill acquisition rate is increased in developing regions such as China, where the unskilled (or production) worker population is larger than its skilled (or professional) counterpart, the proportional boost to skilled workers is larger than the proportional loss of unskilled workers. The result is greater output and, other things being equal, a real depreciation. This tendency is enhanced by the fact that the services sector is comparatively skill intensive, so that the shock causes a relatively large boost to service output and hence a relatively large fall in the home service price (relative to North America). The result is a relatively large real depreciation in the long run. The elasticities in this case are percentage departures of the real exchange rate for each per cent of the production-worker
(unskilled) population that is transformed each year. Defined this way, skill transformation places downward pressure on the real exchange rate of a magnitude similar to total factor productivity in services.
Financial influx: This is induced by a decline in China’s interest premium. It raises
investment and therefore increases aggregate demand and the real exchange rate. A positive demand-driven effect is therefore expected in the first instance. In the long term, however, when the effect of the investment on the capital stock is realised, the supply side dominates. More abundant and hence cheaper capital reduces production costs, yielding a real
depreciation. The elasticity to premium decline (financial capital inflow) is large and positive in the short term, with the lag to the switch in sign measuring at least 15 years.
Trade liberalisation: This switches demand away from home-produced goods and services towards imported varieties. For a single region, the supply of goods and services from the much larger foreign market is more elastic than that of home varieties, constrained as they are by local factor supplies and technology. The effect of the demand switch, then, is to reduce the relative prices of the home varieties and hence to depreciate the real exchange rate. The elasticity is constructed by dividing the percentage change in the real exchange rate by the percentage point change in the import penetration ratio (the ratio of the value of imports to the total value of domestic consumption). The shock on which it is based is a marginal reduction in all China’s merchandise trade barriers.xxiv The elasticity, also shown in Figure 3, has the expected negative sign, and its magnitude grows through time. The growth in the magnitude of the elasticity through time is due to increased investment and hence capital growth. This occurs because the industrial sector, while it suffers from reduced protection, benefits more from lower tariffs on imported intermediate inputs.xxv
1997-2006 decomposition
While the analysis in Section 2 makes it clear that the Balassa-Samuelson appreciating force has been in action in China, our generalisations allow consideration of countervailing forces and it is these that must have prevented any significant real appreciation between the early 1990s and 2006. Strong depreciating forces that might have caused this include skill
acquisition, which helps control wage costs in the skill-intensive services sector, trade reforms and financial flows on the balance of payments.
In terms of elasticities, Figure 3 confirms that financial flows dominate in the short to medium run. From Figure 4, however, it is evident that, since the mid-1990s there has in fact been an
expansion in net outflows on these accounts, and so the effect has been to apply downward pressure on China’s real exchange rate. To see this, note that the equality of net flows on the capital accountxxvi to the investment–saving gap follows from the standard aggregate
expenditure and disposal identities.xxvii Defining net inflows as positive, the capital accountxxviii surplus can be written as:
(4) KA S= NF− ∆ = −R I SD
where I is investment, SD is total domestic saving, SNF (net foreign saving) is net private inflow on the financial account and ∆R is the annual addition to official foreign reserves. In the presence of capital controls, SNF is roughly equal to inward FDI.xxix Both sides of the equation are negative in the case of China, indicating net outflows. Extraordinarily, even though investment accounts for 45 per cent of China’s GDP, more than half of its GDP is saved. While these outflows have surely been a depreciating force, the other two candidates may also have been important. The recent surge in overall income growth and urbanisation has seen an acceleration of skill acquisition and a boost to the service economy. At the same time, the lead-up to China’s WTO accession saw a substantial reduction in trade distortions. To separate the effects of each of these forces on the real exchange rate we begin with the baseline model simulation over the decade 1997-2006. This simulation incorporates all measured changes in sectoral productivity, skill acquisition and trade liberalisation.xxx Finally, the trade reform shocks associated with the WTO accession are from Rees and Tyers (2004: Table 3). The actual and simulated paths of the bilateral real exchange rate between China (incorporating Taiwan and Hong Kong) and North America (incorporating the US, Canada and Mexico) are illustrated in Figure 5. Note, first, that these paths differ from that of the bilateral real exchange rate between mainland China and the US shown in Figure 2. The real exchange rate depreciates further with these aggregations because Hong Kong and Taiwan experienced larger real depreciations against the US in this period and Canada and Mexico both experienced real appreciations against the US. The simulated real depreciation falls slightly short of that recorded, yet, as the figure shows, the model does reproduce the shape of the observed real depreciation through 2006.
The independent effect of each of the forces on the bilateral real exchange rate between China and North America is then discerned by making a number of additional model simulations over 1997-2006. The first is a “no forces” simulation, in which changes to all of the key forces determining the bilateral real exchange rate are removed. Saving rates are shifted to
ensure that the ratios of total investment to total saving in China and North America are held constant, restraining the expansion in net outflows on China’s capital account and net inflows on North America’s;xxxi productivity growth rates in all sectors are set at North American levels throughout; no trade policy reforms occur; and skill acquisition rates are shifted to ensure that labour forces and skill shares grow in both regions at the North American rates for the period. Then this no-forces simulation is augmented by each of the individual forces separately, to evaluate their independent effects. The results are summarised in Table 2. Higher Chinese productivity growth offers the expected appreciating force. Net financial outflows on China’s balance of payments and inflows on the North American balance of payments (their current account ‘imbalances’) both tend to depreciate the Chinese real exchange rate. Similarly, skill acquisition and trade reform offer the expected depreciating forces. In combination, the current account imbalances in both China and North America contribute a depreciation of more than five per cent by 2006. Skill acquisition is a small force in the short run, consistent with the elasticities in Figure 3. Surprisingly significant, however, is the depreciating effect of WTO accession trade reforms, which contribute more than four per cent to the overall real depreciation. In the end, the current account imbalances prove to be, in combination, the most important depreciating forces during 1997-2006.
4 Macroeconomic policy and the renminbi
The exchange rate reforms launched by the Chinese authorities in July 2005 were intended to at least demonstrate a departure from the de facto fixed US dollar peg, nominally allowing the currency to fluctuate by up to 0.3 per cent each day. The rate of appreciation has accelerated in 2007, with the daily band expanded to ±0.5 per cent from the “middle” of 15 qualified early morning bids. To September 2007, the net nominal appreciation had amounted to about 10 per cent. Expressing a widely held view outside China, Lardy (2006:85) argued that: ‘As the world’s second largest surplus country, China must allow its currency to appreciate against the dollar and it must take steps to allow a transition to a growth path driven more by
domestic consumption than by further increases in its external surplus.’ Consistent with this view, since the gross outflows on its capital account are dominated by reserve accumulation, China, in combination with other Asian economies that are also raising reserves, has been accused of ‘monetary mercantilism’.xxxii It is implied that reserve accumulation is chosen freely in order to keep the real exchange rate low.
In our view the monetary mercantilist critique is misplaced. The root of its unfairness is evident from the identity (4) which transforms as ∆ =R SD− +I SNF. As long as total
domestic savings exceed investment and capital controls prevent the matching of inward FDI by private outflows, ∆R must be positive. The point is that, if the capital controls are justified on stability grounds, if the high private saving rate is impervious to macroeconomic policy in the short run, if government expenditure is already increasing so quickly that no quality expansion, and hence government dissaving, is feasible, and if investment is already too high at 45 per cent of GDP to permit additional projects that are of quality and manageable, then China’s current account surplus must be matched by reserve accumulation. The PBC has no further discretion in the short run.xxxiii We consider each of the four conditions in turn. The capital controls are conceptually simplest. They stem from “fear of floating” and short memories of the currency run with which China was threatened in the late 1990s during the Asian financial crisis. Moreover, some PBC suspicions remain as to the prudential reliability of China’s commercial banks in exchanging large volumes of foreign currency. Financial institutions are variously perceived as not sufficiently distant from decades of soft budget constraints associated with the channelling of government subsidies to state-owned
enterprises through accumulated debt. And there are concerns that the commercial banks lack access to derivative markets for currency and debt instruments to do the necessary hedging, though these are probably ill-founded in that futures markets are in establishment and these will quickly expand in significance once the stabilising blanket of capital controls is relaxed. Though their continued effectiveness is vouched for by Ma and McCauley (2007), the controls are slowly being relaxed, as indicated by the Qualified Domestic International Investor (QDII) and the Qualified Foreign International Investor (QFII) programs, which impose adjustable quotas on private financial flows.
Next we turn to China’s high saving rate. Household saving is high in China for three reasons. The first is the transition from state to private employment and the associated need for households to prepare for costs previously borne by state owned corporations, namely those of housing, education, health and retirement. Second, housing and health costs have spiralled relative to other prices in China in recent years, motivating still higher household saving. Third, average household income is growing at an extraordinary rate. Above-median incomes are increasing at more than 20 per cent per year. The current surge is less than a decade old and its continuation is not likely to be expected, so that households are saving to smooth their income forward. But all this explains household saving rates of around a third,
far short of total saving as more than half of GDP, indicated in Figure 4. The difference is due to high and rising corporate saving. In a recent study, Azziz and Cui (2007) point to the rising share of Chinese capital income in GNP as one important cause. In turn, an important cause of this is very high corporate income growth in the nominally state-owned sector, particularly since 2000, as shown by Lu et al. (2007). The majority of this has been earned by SOEs in traditional industries, including petroleum, refining, petrochemicals, coal, tobacco, steel and other metals, and transport equipment. These firms are at least two-thirds state-owned, with the remainder listed on stock exchanges. Most are mandated monopolies treated favourably by the government in that, while dividends are paid to stock-holders, none is paid to the government. The level of indirect and household income taxation is therefore larger than it would otherwise need to be, reducing the after-tax share of households in total real income and hence reducing consumption expenditure. Critically, all these causes of the high saving rate are deeply structural and the subject of long term programs of microeconomic policy reform. None is amenable to action by the central bank alone.
Third, as noted by Xiao (2006), it has been suggested that the surplus of saving over
investment implies that the rate of investment is too low. At 45 per cent of its GDP, however, China’s investment is extraordinarily high. It is difficult to imagine how additional projects might be conceived and implemented given service sector planning and facilitation
constraints. Moreover, China’s low official domestic financing rates notwithstanding, recent surveys by the PBC show that a very substantial proportion of investment still takes place through the informal sector at rates that remain high by international standards.xxxiv It will take some time yet for financial intermediation costs in China to fall to developed country levels and so financing costs must continue to be a break on investment.xxxv
Finally, China’s fiscal policy has to date maintained a fairly tight balance between revenue and expenditure. Might not the government dissave to raise consumption expenditure? Public infrastructure investment absorbs a larger share of GDP in China than in any other developing country of comparable income per capita (Roland-Holst et al. 2005). It is difficult to imagine faster growth in such expenditure without encountering the same quality barriers that constrain private investment. Clearly, major reforms and institutional changes are required in the health and retirement insurance sectors. Although such reforms do not require new building and construction investments, they are constrained by the process of
institutional design, which in spite of China’s rapid growth, tends to be slow and careful.
Through 2007 at least, the PBC absorbs foreign currency inflows net of import costs because, short of long term reforms affecting financial depth and while the capital controls remain, the Chinese commercial banks cannot move the required volume of foreign currency. To avoid excess liquidity, annual reserve increments have been sterilised. PBC holdings of domestic credit have been insufficient for this sterilisation, however, so ‘sterilisation bonds’ have been issued on the debit side of the balance sheet shown in Table 3.
Just as the reserves have come to dominate the asset side of the balance sheet, sterilisation bonds have assumed significance on the debit side. In effect, the PBC has acted as a conduit for domestic savers who might otherwise acquire foreign assets but are restricted from doing so by capital controls. The current pressure from abroad to revalue therefore places the PBC in a difficult position for two reasons. First, since the assets of the PBC are primarily in US dollars and its liabilities are in renminbi, too prompt an appreciation of the renminbi would result in substantial losses that would need to be covered in renminbi from the government budget. This concern has very recently been addressed, at least in part, with the issue of US$ 200 billion in government debt to be exchanged with the PBC for reserve assets, the latter to be maintained by China’s new “sovereign wealth fund”, the new state-run China Investment Company (CIC).1
As shown in Figure 7, this sterilisation process has kept a lid on the monetary base as a proportion of GDP. Liquidity growth has nonetheless been substantial in recent years. It is our view that this has stemmed from the on-going financial reforms, which have greatly expanded commercial bank intermediation (in place of pre-existing and relatively costly informal credit structures and credit cooperatives). This has been valuable but the associated expansion in deposits has also boosted overall money supply growth, contributing since 2006 to inflationary pressure. Thus far, the PBC has responded with higher bank reserve
requirements and higher short interest rates. The latter has added to speculative (illegal) private inflows driven by the expectation that the RMB will continue to appreciate steadily, bringing upward pressure on the real exchange rate, as shown in the last year of data displayed in Figure 3. The net effect has been a combination of inflation with the PBC’s modest appreciating trend for the RMB.
The effect of relaxing capital controls
1 The new CIC takes the formerly-established “foreign exchange financial investment company” (the HuiJin Co: literally translated as foreign exchange and gold) as its subsidiary. Hui Jin mainly does equity investment in domestic financial industries while its parent company CIC will focus on overseas investment abroad. Thanks to Bu Yongxiang for this detail.
As capital controls are relaxed, a key issue will be the extent of private outflows on the financial account. Prasad et al. (2005) point to the potential for this to create a depreciating force as Chinese private investors seek to diversify their portfolios. The scale of this force depends on whether the PBC’s existing foreign reserves are the equivalent of the private sector’s desired foreign holdings. A crude assessment of this can be made by comparing the foreign shares of collective portfolios across developed and developing countries. Assets are many and various and net positions are poorly documented, however. For a sample of
countries we have constructed a crude approximation to foreign shares in collective portfolios using estimates of capital stocks and recorded flows on balances of payments. The results require a sceptical eye, since capital stocks are measured differently across countries and foreign shares can be expected to be higher in smaller and more open economies irrespective of their levels of development, as in the cases of Hong Kong, Singapore and the UK.xxxvi The resulting foreign asset shares are listed in Table 4. The countries are then ranked on their estimated foreign shares in Table 5. Most striking is that, large official foreign reserves notwithstanding, China ranks rather low on the list, even when compared with other Asian developing countries. Since 2002, however, its foreign share appears to have doubled and its ranking has risen. By 2005 it ranked above Japan, Korea, Thailand, India and Brazil but below the other developed countries and Malaysia, Taiwan and Chile. Its ranking above Japan and the other two of the world’s very large developing countries, India and Brazil, suggests its foreign share may be on the high side, though none of these economies is as open as China already is to foreign trade and ownership (Lardy 2006). On the other hand, its ranking below the developed countries suggests that continued growth, combined with comparative openness, will take its share higher. At the very least, these results do not lend clear weight to the thesis that financial liberalisation will automatically raise private inflows and appreciate the RMB. Moreover, a surge in private rebalancing outflows could prove a healthy outcome since the PBC could readily offset this by repatriating its reserves and sterilising the inflow by liquidating its “sterilisation bonds”. This would take the pressure off the CIC by restoring the PBC’s balance sheet to something more conventional as well as stabilise the home capital market.
5 Unilateral appreciation scenarios
The tendency toward real appreciation since 2006, indicated in Figure 3, may herald an appreciating trend. Too little time has elapsed to tell. Moreover, if there is an appreciating trend, and it is driven by speculative inflows, the recent crackdown on inward capital controls
will ensure that the effect on China’s real exchange rate is temporary and the flat path indicated in Figure 2 could be resumed for several years.xxxvii In what follows we imagine that the path of the underlying real exchange rate remains flat (as in Figure 2). From Equation (1), any decision by the PBC to revalue would therefore require further monetary tightening and a reduction in the inflation rate. Inflation above 5% per year offers some cushion to accommodate this. Should the rate fall again, however, any significant revaluation would require a monetary tightening sufficient to risk a return to the growth-sapping deflation of the late 1990s.
McKinnon’s (2004) sage preference for an East Asian dollar standard notwithstanding, the bilateral pressure by the US for an RMB revaluation is understandable in one respect. The benefits accruing to the US economy from Chinese investment notwithstanding, its
government perceives a substantial current account imbalance, a proportion of which stems from its bilateral trade with China, and it expects that a US$ depreciation will help to correct it (Woo 2006). The US$ floats against most of the world’s currencies but, no matter how much it depreciates against those there have been limits to its flexibility against the RMB. This is the more frustrating because the monetary authorities of other Asian trading partners are concerned not to allow significant appreciations against the RMB.xxxviii Not only does the inflexibility of the RMB rate frustrate the US government, inciting the critical rhetoric (Bernanke 2006) and the draft legislation to “punish” China (Callan 2007), but it also causes frustration in Europe, where the burden of appreciation against the US$ is greatest.xxxix Ironically, while the refusal by some other Asian countries to appreciate their currencies significantly against the RMB might well be motivated by “monetary mercantilism”, as argued in Section 4, we believe that the sluggishness of China’s appreciation against the US$ is motivated internally. The sticking point is a fear of financial (including exchange rate) volatility and a lack of faith in its immature commercial banking sector to manage large scale currency exchange with due prudence.xl Although the PBC has no wish to hold additional reserves, it continues to accumulate them in order to avoid unnecessary reliance on its commercial banks (RGE Monitor, 2007c). This bodes ill for the prospect of a partial repatriation of these reserves any time soon, since repatriation requires a significant home market for the exchange of foreign currencies for the RMB. Yet such an influx, or at least a reduction in the rate of reserve accumulation, is an essential element of a healthy unilateral appreciation of the RMB. Short of this, the Chinese government has two options: a
Appreciation by monetary contraction
Were a repatriation of reserves or an accumulation slowdown possible, the real exchange rate would appreciate (as discussed in Section 3) and the nominal exchange rate could then be allowed to appreciate without causing domestic deflation (Equation 1). In the absence of reserve repatriation, and without any substantial upward movement in the underlying real exchange rate, the PBC could simply declare a higher US$/RMB rate. This is the option advocated by Tung and Baker (2004), who suggest a 15% one-off revaluation and argue that the risk of consequent deflation is minimal, due to inflationary pressure from other sources. In the absence of an underlying appreciation of the real exchange rate, this argument lacks foundation.
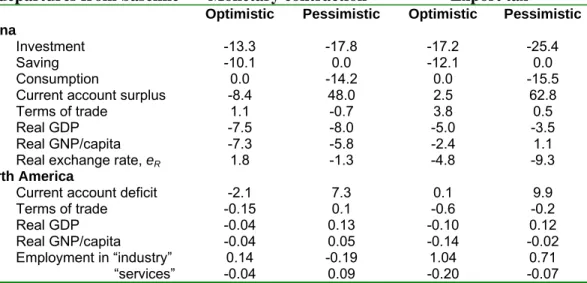
The defence of the stronger RMB would require a contraction of the domestic money supply (or a slowdown in its growth) and a boost to domestic interest rates and other financing barriers. If the revaluation were as large as 15%, the result would likely be a return to the deflation of the late 1990s and this would squeeze profitability in the tradable goods sectors, leading to a slow-down in employment growth or an increase in under- or unemployment. Income would decline (or grow more slowly), as would consumption and saving. Slower employment growth in the modern sector would reduce capital returns and, combined with higher financing costs, this would also contract investment (or reduce its growth), and so the implications for China’s external imbalance would then depend on the relative size of the saving contraction. For external balance there are, therefore, two cases to consider.
First, if Chinese households are optimistic they expect that the contraction is temporary and unrestrained growth will be restored in the future. Faced with reduced current income they would then smooth consumption by reducing current saving. Even with such a reduction in the saving rate, however, our simulation shows that the effect of lower employment growth on capital returns causes a larger fall in investment than in saving. Total domestic saving is initially larger than investment, so the net effect is to reduce China’s current account surplus. This result is indicated in the first column of Table 6. There is a real appreciation against North America and a slight reduction in the latter’s current account deficit. In addition, there is a slight addition to North America’s politically sensitive industrial employment, though this comes at the expense of a service sector employment contraction due to North America’s real depreciation against China. Both China and North America suffer losses in overall GDP and real income per capita. The loss in China is substantial, however, amounting to almost a year’s growth.xli
A second possibility is that Chinese households are pessimistic and believe that the
contraction is permanent. In response to the monetary contraction and reduced income they would then exhibit behaviour seen in Japan in the 1990s, smoothing their consumption forward and raising their saving rate.xlii As shown in the second column of Table 6, this exacerbates the contraction in Chinese economic activity and income. Moreover, because saving does not fall and investment does, China’s current account surplus is raised. The additional financial outflow causes a real depreciation, suggesting that, to achieve a particular nominal appreciation target, the monetary contraction in this case would need to deliver a larger deflation than before (Equation 1). Internationally, this shock reduces global interest rates and raises North America’s current account deficit. Even though there are small gains in North America’s terms of trade and real income, the exacerbation of current account
imbalances and the associated decline in industrial employment would further frustrate the US politically. It is difficult to conclude other than that there is little to be gained from RMB appreciation by monetary contraction.
Taxing trade
The other “unhealthy” approach to a unilateral appreciation is via trade distortions. We can dismiss a rise in import tariffs as fanciful, since China’s WTO accession conditions offer very little room between applied and bound tariff rates. In any case, the returns from the resulting openness have been so considerable that it is difficult to imagine any policy reversal. Export restraints are possible, however, since these are not directly protectionist and hence would not attract mercantilist objections from abroad.xliii In principle at least, like import tariffs, they might be expected to divert domestic demand from foreign to home products and thereby appreciate the real exchange rate, allowing the central bank to also appreciate the nominal exchange rate. The downside is that they would also be a tax on the most rapidly expanding sectors in the economy and so they would sacrifice growth in urban employment and income. Our simulation is of the short run (2010) impacts of an export tax of 15% graduated over 2007-2009 and levied only on industrial exports. As previously we consider scenarios with both optimistic and pessimistic households. Surprisingly, as shown in the final two columns of Table 6, in both cases China experiences robust real depreciations against North America. This is because China’s current account surplus rises even in the optimistic case in which the saving rate falls temporarily. This contradicts the expected story because that emphasises substitution in final demand. The true story is about intermediate demand. China’s export manufacturing sector relies to an extraordinary extent on imported components, mostly from
Asian trading partners.xliv When the export tax contracts this sector, imports are similarly contracted. Total exports, in fact, contract by a smaller proportion because there is offsetting expansion in agricultural and service exports that are not intensive in imported inputs. The net effect is an expansion in China’s trade surplus.
In North America the current account deficit rises and, as before, there are only small changes in real GDP and real per capita income. Importantly, however, China’s export restraints do raise North American industrial employment, again at the expense of services employment, even though North America experiences a real appreciation against China that would otherwise advantage the services sector. In either case, at least in the short run, export restraints would not make it easier for the PBC to appreciate the RMB; in fact quite the opposite.
6 Conclusion
The Balassa-Samuelson hypothesis is borne out for China, in that, relative to the US,
productivity has apparently grown faster in the tradable than in the non-tradable sectors, real wages have growth faster and there has been relative service price inflation. The flat
trajectory of its real exchange rate between 1990 and 2006 is therefore a puzzle, the resolution of which requires the generalisation of the hypothesis to incorporate failures of the law of one price for tradable goods and a more sophisticated representation of the labour market. This opens the way for depreciating forces that have been offsetting the Balassa-Samuelson effect, including net financial outflows on the balance of payments, trade and other microeconomic reforms and the rising number of skilled workers.
To examine these forces, a dynamic model of the global economy is used to construct a baseline business-as-usual simulation to 2030. The principal determinants of China’s economic growth are then shocked separately and their independent effects on the real exchange rate observed over time. In the short term, the key determinant is net financial capital influx, which appreciates the real exchange rate, or efflux, which depreciates it. In the medium term, scope does emerge for Balassa-Samuelson real appreciation, if services lag sufficiently behind industrial productivity. In the long term, however, if services remain relatively skill intensive on average, their performance will be bolstered by both direct productivity improvements and skill acquisition, and the result will be a substantial depreciating force.
The model is then used to decompose the flat trajectory of the real exchange rate 1997-2006. The results suggest that the Balassa-Samuelson force is offset most strongly by the rise of China’s total savings relative to its investment and the associated expansion of net outflows on its capital account, with a significant contribution from WTO accession trade reforms. While much attention is paid in the literature to the “undervaluation” of the renminbi, it is in our view incorrect to blame this on China’s monetary policy and, in particular, to the PBC’s accumulation of foreign exchange reserves. The PBC’s monetary stance is motivated by concern about financial (and exchange rate) stability in the face of the relative immaturity of its commercial banking sector. While ever deeply structural issues cause China’s savings to exceed its investment, the reserves and capital controls merely alter the public–private composition of external financial flows but need not significantly affect their magnitudes. In the short term, unless the total saving rate falls suddenly, contracting the current account surplus, reducing reserve accumulation and appreciating the underlying real exchange rate, there will be no “healthy” way to unilaterally appreciate the RMB. We show that unilateral appreciation by monetary contraction would be very costly to China, and it would most likely hurt the rest of the world by tightening capital markets and changing the terms of trade adversely. Moreover, if Chinese households were to react pessimistically to the shock, the current account surplus could be enlarged, backfiring on those who clamour for an
appreciation to address global imbalances. The other conceptually feasible, but no more healthy, approach to a unilateral appreciation is via the imposition by China of a tax on manufactured exports. As it turns out, because China’s export manufacturing sector relies so heavily on imported components, such a tax would actually exacerbate the trade surplus by cutting imports in proportion with manufactured exports while expanding other less import-dependent exports. This would increase China’s current account surplus while sacrificing considerable growth. It would hurt the North American economy overall, though it would also raise the number of North American workers in politically sensitive industrial
employment.
In the near term, since without an appreciating trend in the underlying real exchange rate there is no scope for healthy unilateral appreciation of the RMB, international pressure would best be focussed on the remaining financial reforms and smooth transitions to policies that better regulate large state owned enterprises and address the need for uniform systems of retirement and health insurance. China’s saving rate must eventually decline and this will reverse the net flow on its capital account, allowing non-speculative appreciating forces to dominate the path
of its real exchange rate. In the long term, whether there is a sustained upward trend in China’s real exchange rate will depend on the relative strengths of appreciating forces, including savings and labour force declines, and depreciating forces that include the performance of its services sector.
References
Aizenman, J. and Lee, J., 2006. “Financial versus monetary mercantilism: long run view of large international reserves hoarding”, Working Paper WP/06/280, International Monetary Fund, Washington, DC.
Athukoralla, P.-C., 2005. “Components trade and implications for Asian structural
adjustment”, Chapter 13 in R. Garnaut and L. Song (eds.), The China Boom and its Discontents, Canberra: Asia-Pacific Press.
_______, 2007. “The rise of China and its consequences for East Asia: is the fear of export competition warranted?” presented at the Conference on Reforms for Korea’s Sustained Growth organized by the East West Center and Korea Development Institute, Honolulu, July 12-13.
Azziz, J. and L. Cui, 2007. “Explaining China’s low consumption: the neglected role of household income”, International Monetary Fund Working Paper WP 07/181, Washington DC.
Balassa, B., 1964. ‘The purchasing power parity doctrine: a reappraisal’, Journal of Political Economy, 72(6):584–96.
Bergin, P.R., Glick, R. and Taylor, A.M., 2006. ‘Productivity, tradability and the long run price puzzle’, Journal of Monetary Economics, 53(8):2,041–66.
Bergsten, F.C., 2004. “Risks ahead for the world economy”, The Economist, September. Bernanke, B., 2006. Speech to the Chinese Academy of Social Sciences, Beijing, Friday 15
December, www.federalreserve.gov/BoardDocs/Speeches/2006/20061215.
Bloom, D.E. and Williamson, J.G., 1998. ‘Demographic transitions and economic miracles in emerging Asia’, World Bank Economic Review, 12(3):419–55.
Cai, F. and Wang, D., 2005. ‘Demographic transition: implications for growth’, in R. Garnaut and L. Song (eds), The China Boom and its Discontents, Asia Pacific Press, The Australian National University, Canberra.
——, 2006. ‘Employment growth, labour scarcity and the nature of China’s trade expansion’, in R. Garnaut and L. Song (eds), The Turning Point in China’s Economic
Development, Asia Pacific Press, The Australian National University, Canberra. Callan, E., 2007. ‘Clinton and Obama back China Crackdown”, Financial Times 5 July
(www.FT.com).
Chang, J. andTyers, R., 2003.‘Trade reform, macroeconomic policy and sectoral labour movement in China’, in R. Garnaut and L. Song (eds), China 2003: new engine for growth, Asia Pacific Press, The Australian National University, Canberra.
Choudhri, E.U. and Khan, M.S., 2004. “Real exchange rates in developing countries: are Balassa-Samuelson effects present?”, Working Paper, No.WP/04/188, International Monetary Fund, Washington, DC.
Cline, W., 2005. The Case for a New Plaza Agreement, Institute for International Economics, Policy Briefs 05-4, Washington DC.
Coudert, V. and Couharde, C., 2005. “Real equilibrium exchange rate in China”, Working Paper, No.2005-01, CEPII, Paris.
Crucini, M.J., Telmer, C.I. and Zachariadis, M., 2005. ‘Understanding European real exchange rates’, American Economic Review, 95(3):724–38.
Dimaranan, B.V. and McDougall, R.A., 2002. Global Trade, Assistance and Production: the GTAP 5 data base, May, Center for Global Trade Analysis, Purdue University, Lafayette.
Dixon, P.B., Parmenter, B.R., Sutton, J. and Vincent, D.P., 1982. ORANI, a Multi-Sectoral Model of the Australian Economy, North Holland, Amsterdam.
Dixon, P.B. and Rimmer, M.T., 2002. Dynamic General Equilibrium Modelling for Forecasting and Policy: a practical guide and documentation of Monash, North Holland, Amsterdam.
Drine, I. and C. Rault, 2005. ‘Can the Balassa-Samuelson theory explain long run real exchange rate movements in OECD countries?’ Applied Financial Economics, 15(8):519–30.
Fan, G., 2006. ‘Global imbalance, China and the international currency system’, in R. Garnaut and L. Song (eds), The Turning Point in China’s Economic Development, Asia Pacific Press, The Australian National University, Canberra.
Fogel, R., 2006. “Why is China likely to achieve its growth objectives?”, Working Paper W12122, National Bureau of Economic Research, Cambridge, Mass.
Frankel, J., 2004. “On the renminbi: the choice between adjustment under a fixed exchange rate and adjustment under a flexible rate”, Working Paper 11274, National Bureau of Economic Research, Cambridge, Mass.
Garnaut, R. and Y. Huang (2007), “Mature Chinese growth leads the global platinum age”, Chapter 2 in R. Garnaut and L. Song (eds), China: Linking Markets for Growth,
Asia-Pacific Press, July: 9-29.
Golley, J. and R. Tyers, 2006. ‘China’s growth to 2030: demographic change and the labour supply constraint’, Chapter 8 in R. Garnaut and L. Song (eds), The Turning Point in China’s Economic Development, Asia Pacific Press, Canberra.
_______,2007. ‘China’s real exchange rate’, Chapter 16 in R. Garnaut and L. Song (eds.) China: Linking Markets for Growth, Asia-Pacific Press, July: 316-343.
Goldstein, M., 2004. “Adjusting China’s foreign exchange rate”, revised version of a paper delivered at the International Monetary Fund’s seminar on China’s Foreign Exchange Rate System, Dalian, China, 26–27 May. Available from www.iie.com (accessed September 2006).
Gordon, R (2003), “Exploding productivity growth: context, causes and implications”, Brookings Papers on Economic Activity, 2: 207-297.
______ (2006), “The US productivity growth ‘explosion’: dimensions, causes, consequences and aftermath”, 48th Annual Meeting of the NABE, NBER Session, Boston, 11 September.
______ (2007), “Comments on ‘A retrospective look at the US productivity growth resurgence’”, American Economics Association Conference session, 6 January.
Hertel, T.W. (ed.), 1997. Global Trade Analysis Using the GTAP Model, Cambridge University Press, New York.
Holtz, C.A. (2006), “New capital estimates for China”, China Economic Review 17: 142-185. Ianchovichina, E. and McDougall, R., 2000. Theoretical structure of Dynamic GTAP, GTAP
Technical Paper, No.17, Purdue University, Lafayette.
International Monetary Fund (IMF), 2007a. International Financial Statistics, April, International Monetary Fund, Washington, DC.
——, 2007b. World Economic Outlook Database, April, International Monetary Fund, Washington, DC.
Ito, T., 2001. The Japanese Economy, Cambridge MA: The MIT Press.
Lardy, N., 2006. ‘China’s interaction with the global economy’, in R. Garnaut and L. Song (eds), The Turning Point in China’s Economic Development, Asia Pacific Press, The Australian National University, Canberra.
Liu, J., Van Leeuwen, N., Vo, T.T., Tyers, R. and Hertel, T.W., 1998. Disaggregating labor payments by skill level in GTAP, Technical Paper, No. 11, September, Center for Global Trade Analysis, Department of Agricultural Economics, Purdue University, Lafayette.
Lu, F., 2006. “China’s productivity growth, an international comparison”, China Center for Economic Research Working Paper C200604, April, Peking University, Beijing, (in Chinese).
Lu, F., G. Song, J. Tang, H. Zhao and L. Liu, 2007. “Profitability of Chinese firms, 1978-2006”, China Center for Economic Research, Peking University, Beijing.
Ma, G. and R.N. McCauley, 2007. “How effective are China’s capital controls?”, Chapter 14 in R. Garnaut and L. Song (eds), China: Linking Markets for Growth, Asia-Pacific Press, July: 267-289.
Ma, Y., 2006. “A comparative study of the competitiveness of the domestic and foreign-invested service industries in China”, Centre for Public Policy Studies Working Paper, No. 176, Lingnan University, Hong Kong, December; presented at the ACE
International Conference, APEC Studies Centre, City University of Hong Kong, 18– 20 December 2006.
McKibbin, W.J. and Sachs, J., 1991. Global Linkages: macroeconomic independence and cooperation in the world economy, Brookings Institution.
McKinnon, R.I., 2004. “The East Asian dollar standard”, China Economic Review, 15: 325-330.
______, 2006. “China’s exchange rate appreciation in the light of the earlier Japanese experience”, Pacific Economic Review, 11(3): 287-298.
Miyajima, K., 2005. “Real exchange rates in growing economies: how strong is the role of the non-tradables sector”, Working Paper05/233, International Monetary Fund,
Washington, DC.
National Bureau of Statistics (China), 2007. China Statistical Abstract2006., China Statistics Press.
People’s Bank of China, 2006. Balance Sheet of Monetary Authority, People’s Bank of China, Beijing.
Prasad, E., Rumbaugh, T. and Wang, Q., 2005. “Putting the cart before the horse: capital account liberalization and the exchange rate in China”, Policy Discussion Paper 05/01, International Monetary Fund, Washington, DC.
RGE Monitor, 2007a. “Excessive liquidity and credit growth in emerging markets”, 11 May,
_______, 2007b. “Europe: Euro strong and getting stronger”, 13 July, [email protected]. _______, 2007c. “China: swelling reserves”, 13 July, [email protected].
Rees, L. and R. Tyers (2004), “Trade reform in the short run: China’s WTO accession”, Journal of Asian Economics 15(1): 1-31, January-February.
Rodrik, D., 2006. “What’s so special about Chinese exports?”, Working Paper, No. 11947, National Bureau of Economic Research, Cambridge, Mass.
Roland-Holst, D., D. Brooks and F. Zhai, 2005. “Asia’s long term growth and integration: reaching beyond trade policy barriers,” Policy Brief No. 38, Economic Research Department, Asian Development Bank, Manila.
Roubini, N, 2007a, “Asia is learning the wrong lessons from its 1997-98 crisis and is now following policies that may lead to a new and different type of financial crisis”, RGE Monitor, rgemonitor.com, May.
_______., 2007b, “The Bretton Woods 2 debate”, RGE Monitor, rgemonitor.com, 3 July. Samuelson, P., 1964. ‘Theoretical notes on trade problems’, Review of Economics and
Statistics, 46(2):145–54.
Tung, C.Y. and S. Baker, 2004. “RMB revaluation will serve China’s self-interest”, China Economic Review 15: 331-335.
Tyers, R. and I. Bain (2006), “The global economic implications of freer skilled migration”, Working Papers in Economics and Econometrics No 468, Australian National University, Canberra, June, revised July 2007.
Tyers, R.and J. Golley (2008a), “China’s real exchange rate puzzle”, Journal of Economic Integration, forthcoming.
______ (2008b), “China's growth to 2030: the roles of demographic change and financial reform”, Review of Development Economics, forthcoming.
Tyers, R., Bu, Y. and Bain, I., (2008). ‘China’s equilibrium exchange rate: a counterfactual analysis’, Pacific Economic Review, forthcoming March.
Tyers, R., Golley, J., Bu, Y. and Bain, I., 2006. “China’s economic growth and its real exchange rate”, Working Papers in Economics and Econometrics, No. 476,