( 19 ) United States
( 12 ) Patent Application Publication ( 10 ) Pub . No .: US 2020/0279043 A1
Thornton et al .
( 43 ) Pub . Date :
Sep. 3 , 2020
( 54 ) DETECTING MALICIOUS SOFTWARE USING SENSORS
( 71 ) Applicant : Southern Methodist University ,
Dallas , TX ( US ) GOON 99/00 ( 2006.01 ) GOON 5/02 ( 2006.01 ) ( 52 ) U.S. Cl . CPC G06F 21/568 ( 2013.01 ) ; G06F 21/567 ( 2013.01 ) ; G06F 21/566 ( 2013.01 ) ; G06F 2221/034 ( 2013.01 ) ; GO6N 99/005 ( 2013.01 ) ; GOON 5/022 ( 2013.01 ) ; G06F 21/57 ( 2013.01 )
( 72 ) Inventors : Mitchell Thornton , Dallas , TX ( US ) ; Michael Taylor , Dallas , TX ( US ) ;
Kaitlin Smith , Dallas , TX ( US ) ( 57 ) ABSTRACT ( 21 ) Appl . No .: 15 / 812,663 ( 22 ) Filed : Nov. 14 , 2017 Publication Classification ( 51 ) Int . Ci . G06F 21/56 ( 2006.01 ) GO6F 21/57 ( 2006.01 )
In some implementations , a method includes retrieving data
from multiple sensors in a computing device , and the
multiple sensors comprise different types of sensors . The
sensor data is analyzed based on a predictive model , and the predictive model is trained to detect malware . Initiation of
malware is determined based on the analysis . In response to the determination , the malware is terminated .
602
COLLECT SENSOR DATA
DURING NORMAL OPERATIONS
604
SIMULATED RANSOMWARE ENCRYPTION
606
COLLECT SENSOR DATA DURING SIMULATION
608
82
TRAIN PREDICTIVE MODEL USING DATA SETS
MONITOR OPERATIONS USING PREDICTIVE MODEL
610
612
DETERMINING INITIATION OF ENCRYPTION
USING SENSOR DATA AND MODEL
SUSPEND ENCRYPTION PROCESS
614
Patent Application Publication
Sep. 3 , 2020 Sheet 1 of 3
US 2020/0279043 A1COMPUTER 100
TEMPERATURE RPMs
SENSOR SENSOR VOLTAGE SENSOR
104b
4
1040
SENSOR POWER CURRENTSENSOR
104C
104a
102
MONITOR SENSOR104e
FIG . 1
200
9000
8000 NO ATTACK 0.92533 0.07467 7000 6000 5000 4000 3000 UNDER ATTACK 0.019252 0.980748 2000 1000NO ATTACK UNDER ATTACK
PREDICTED STATE
300 ( a )
1.0 0.8 0.6 0.4 0.2 0.0FIG . 3A
0 2000 4000 6000 8000 10000 12000 14000 16000300 ( b )
1.0 0.8 0.6 0.4 0.2 0.0FIG . 3B
0 2000 4000 6000 800010000
12000 14000 16000400
14000 12000 NO ATTACK 0.9712410.022759
10000 8000 6000 UNDER ATTACK 0.002718 0.997282 4000 2000FIG . 4
NO ATTACK UNDER ATTACK PREDICTED STATE
Patent Application Publication
Sep. 3 , 2020 Sheet 3 of 3
US 2020/0279043 A1500 ( a )
1.0 0.8 0.6 0.4 0.2 0.0FIG . 5A
0 5000 10000 15000 20000 25000500 ( b )
1.0 0.8 0.6 0.4 0.2 0.0FIG . 5B
0 5000 10000 15000 20000 25000602
COLLECT SENSOR DATA DURING NORMAL OPERATIONS604
SIMULATED RANSOMWARE ENCRYPTION606
COLLECT SENSOR DATA DURING SIMULATION608
TRAIN PREDICTIVE MODEL USING DATA SETSMONITOR OPERATIONS USING PREDICTIVE MODEL
610
DETERMINING INITIATION OF ENCRYPTION USING SENSOR DATA AND MODEL
612
SUSPEND ENCRYPTION PROCESS
614
DETECTING MALICIOUS SOFTWARE
USING SENSORS
BACKGROUND
[ 0001 ] Effective defense against a ransomware attack is typically a multi - tiered or layered approach . Detection of the
malware when downloading to the victim computer is an outer defense , and if possible , can prevent the ransomware
from ever entering the system . This defense attempts to
prevent an attack vector from penetrating a victims host
computer . Packet signature monitoring via an intrusion
detection system ( IDS ) or file signature monitoring via a
local antivirus software program can provide this capability ,
but only if these methods are capable of recognizing the
malware through knowledge of the data signatures . While this defense is a desirable , it is notoriously difficult to prevent infection with previously unknown ransomware versions , or so - called zero - day attacks . In the case of zero
day ransomware , data signatures and other corresponding
characteristics are unknown by definition . Furthermore , the
increasing presence of polymorphic malware is causing
signature - based approaches to become less effective than they once were .
SUMMARY
[ 0002 ] In some implementations , a method includes retrieving data from multiple sensors in a computing device , and the multiple sensors comprise different types of sensors .
The sensor data is analyzed based on a predictive model , and
the predictive model is trained to detect malware . Initiation
of malware is determined based on the analysis . In response to the determination , the malware is terminated .
[ 0003 ] The details of one or more embodiments of the
invention are set forth in the accompanying drawings and
the description below . Other features , objects , and advan
tages of the invention will be apparent from the description
and drawings , and from the claims .
computer , mobile device ) during the initiation of its payload
execution . In these instances , data streams from on - board
sensors in the host can be monitored and ransomware
infections can be detecting using these data streams and
predefined criteria . In this sense , a physical side channel can
be used where the victim's files are not directly monitored .
The behavior of the victim machine is monitored andonboard sensor - provided data is used as side - channel infor
mation that can indicate when an encryption operation is
occurring . In other words , encryption detection depends upon the use of small yet distinguishable changes in the
physical state of a system as reported through onboard
sensor - provided data . In some implementations , monitoring
can be accomplished through a background process that is
loaded at boot time and thus continuously monitors the
system for suspicious behavior . Once this suspicious behav
ior is detected , the user can be alerted and the suspicious processes can be suspended . The central difference between
this approach and other previous approaches is that this
approach uses secondary effects to detect the presence of
malware rather than a direct effect , such as measuring increases in file entropy .
[ 0014 ] In some implementations , a feature vector can be
formulated consisting of various sensor outputs that is
coupled with a detection criterion for the binary states of
ransomware present versus normal operation . In this instances , previously unknown or zero - day versions of ran somware are vulnerable since no a priori knowledge of the
malware , such as a data signature , is required . Experimental results from a system which underwent testing with 16
different test configurations comprised of different simulated system loads unknown to the model and different AES encryption methods used during a simulated ransomware
attack showed an average true positive prediction rate of 98.82 % and an average false positive prediction rate of 1.57 % for predictions made once every second about the
state of the system under test .
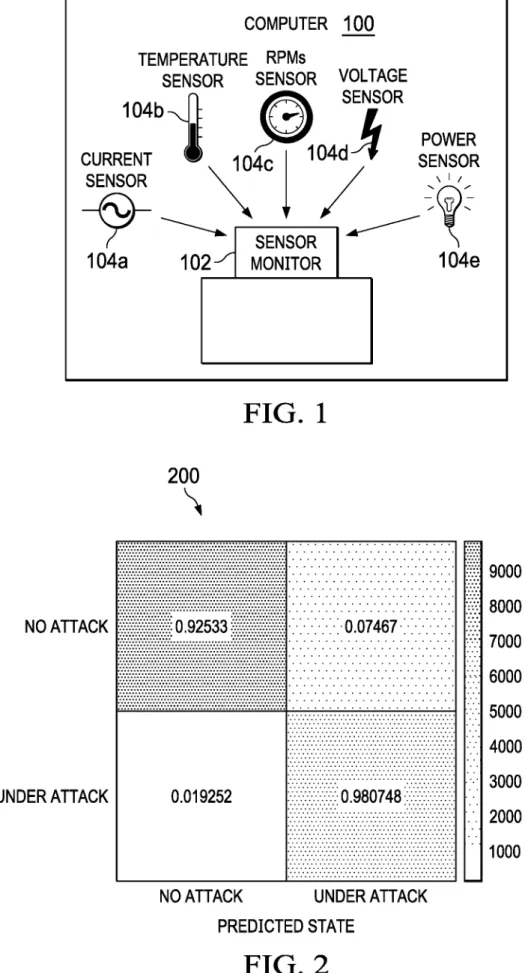
[ 0015 ] FIG . 1 illustrates an example computing device 100 for detecting ransom where in accordance with one or
more implementations of the present disclosure . In some
implementations , the computing device 100 uses sensor data to detect initiation of encryption of data . In the illustrated , the computing device 100 includes a sensor - monitoring module 102 communicably coupled to sensors 104a - e to
detect operating conditions of the device 100. As illustrated ,
the sensors 104a - e include a current sensor 104a , a tem perature sensor 1046 , RPM sensor 104c , a voltage sensor
104d , and a power sensor 104e . The computing device 100
may include the same , some , or different sensors to detect malware ( e.g. , ransomware ) without departing from the
scope of the disclosure .
[ 0016 ] In general , the computing device 100 includes
sensors 104a - e to monitor the state of internal hardware components . These sensors 104a - e can , in some implemen
tations , continuously or periodically gather and supply sen
sor data that is communicated with other devices and
subsystems to substantially maintain the device 100 within
specific operating specifications . If sensor data reveals that
a device component is approaching a boundary for a rec ommended value of an operational specification , safety mechanisms can be engaged to correct the internal environ
ment and prevent or otherwise reduce malfunctions . For example , when the data from the temperature sensor 1045
of , for example , a computer's central processing unit ( CPU )
DESCRIPTION OF DRAWINGS
[ 0004 ] FIG . 1 is an example computing device including
sensors for detecting ransomware .
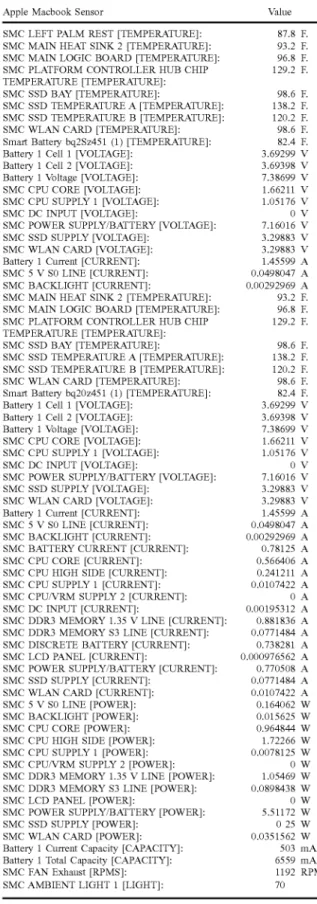
[ 0005 ] FIG . 2 is an example confusion matrix representing
machine state versus ransomware detection model predic tion for a Window machine .
[ 0006 ] FIG . 3A is a plot of encryption activity versus time for a Window machine .
[ 0007 ] FIG . 3B is a plot of ransomware detection model
prediction versus time for a Window machine .
[ 0008 ] FIG . 4 is a confusion matrix representing actual
machine state versus ransomware detection model predic tion for an Apple machine .
[ 0009 ] FIG . 5A is a plot of encryption activity versus time for an Apple machine .
[ 0010 ] FIG . 5B is a plot of ransomware detection model
prediction versus time for an Apple machine .
[ 0011 ] FIG . 6 is a flowchart illustrating an example method for detecting ransomware .
[ 0012 ] Like reference symbols in the various drawings
indicate like elements .
DETAILED DESCRIPTION
[ 0013 ] The present disclosure is directed to a system and method for detecting ransomware in an infected host ( e.g. ,
US 2020/0279043 A1
Sep. 3 , 2020
2
TABLE I - continued
APPLE MACBOOK INTERNAL SENSORS AND READINGS
Apple Macbook Sensor Value
87.8 F. 93.2 F. 96.8 F. 129.2 F.
begins to increase , a signal can be sent to the CPU cooling fan . This signal causes the fan to either become active or to
increase the fan speed in order to cool the CPU . Addition
ally , the sensors 104a - e can provide input to other subsys tems such as internal power management units , PMUs , to
conserve power usage .
[ 0017 ] Typically , computing - device components are fre
quently designed to be compact in size through the use of
transistors with feature sizing often in the nanometer scale . As a direct result , whenever computations become more complex , more stress in placed on the components . This increased stress occurs because a large number of transistors
are frequently switching in a circuit that correspondingly
cause an increase in dynamic power consumption and , in turn , more heat dissipation especially during heavy compu tational activity . Thus , monitoring the side channels of the computing device 100 with the embedded sensors 104a - e
that measure operating conditions such as temperature ,
power consumption , and battery voltage levels can indicate
the type of processing that is underway on a computer at a
given time . As a result , monitoring a computer's side
channels through periodic observations of sensor output data can , in some implementations , indicate when a resource
heavy task , such as encryption , is occurring . Since ransom
ware utilizes encryption in its payload to deny its victims
access to their files , trends to emerge in regard to how a
computer behaves while under ransomware attack based on
analyzing data from a computer's side channel sensor data . [ 0018 ] Conventional computers are comprised of the same set of basic internal devices to enable their operation . However , manufacturers may choose to use different and / or unique sets of components for their various computer mod
els . Due to this variation among different product models ,
corresponding differences among the readings of the internal
onboard sensors can occur when they are queried . In theillustrated implementation , the senso nsor - monitoring module 102 can include any software , hardware , and / or firmware configured to access sensor data ( e.g. , main memory power usage ) . For example , the sensor - monitoring module 102 can
be accessed sensor data via the command line and / or
through calls to the operating system and interpret the onboard sensor data . During experimentation , the Hardware Monitor and the Open Hardware Monitor applications were used to provide information from systems running Apple's
OSX® and Microsoft's Windows® operating systems . As an
example of large number of available on - board sensors , a list
of the 59 sensors and their readings from an Apple Mac book® is provided below in Table 1 .
98.6 F. 138.2 F. 120.2 F. 98.6 F. 82.4 F. 3.69299 V 3.69398 V 7.38699 V 1.66211 V 1.05176 V 0 V 7.16016 V 3.29883 V 3.29883 V 1.45599 A 0.0498047 A 0.00292969 A 93.2 F. 96.8 F. 129.2 F. SMC LEFT PALM REST [ TEMPERATURE ] :
SMC MAIN HEAT SINK 2 [ TEMPERATURE ] :
SMC MAIN LOGIC BOARD [ TEMPERATURE ] :
SMC PLATFORM CONTROLLER HUB CHIP
TEMPERATURE [ TEMPERATURE ] : SMC SSD BAY [ TEMPERATURE ] :
SMC SSD TEMPERATURE A [ TEMPERATURE ] :
SMC SSD TEMPERATURE B [ TEMPERATURE ] : SMC WLAN CARD [ TEMPERATURE ] : Smart Battery bq2Sz451 ( 1 ) [ TEMPERATURE ] : Battery 1 Cell 1 [ VOLTAGE ] :
Battery 1 Cell 2 [ VOLTAGE ] :
Battery 1 Voltage [ VOLTAGE ] : SMC CPU CORE [ VOLTAGE ] :
SMC CPU SUPPLY 1 [ VOLTAGE ] : SMC DC INPUT [ VOLTAGE ] :
SMC POWER SUPPLY / BATTERY [ VOLTAGE ] :
SMC SSD SUPPLY [ VOLTAGE ] : SMC WLAN CARD [ VOLTAGE ] :
Battery 1 Current [ CURRENT ] : SMC 5 V SO LINE [ CURRENT ] :
SMC BACKLIGHT ( CURRENT ] :
SMC MAIN HEAT SINK 2 [ TEMPERATURE ] : SMC MAIN LOGIC BOARD [ TEMPERATURE ] :
SMC PLATFORM CONTROLLER HUB CHIP TEMPERATURE [ TEMPERATURE ] : SMC SSD BAY [ TEMPERATURE ] :
SMC SSD TEMPERATURE A [ TEMPERATURE ] :
SMC SSD TEMPERATURE B [ TEMPERATURE ] :
SMC WLAN CARD [ TEMPERATURE ] :
Smart Battery bq202451 ( 1 ) [ TEMPERATURE ] : Battery 1 Cell 1 [ VOLTAGE ] :
Battery 1 Cell 2 [ VOLTAGE ] : Battery 1 Voltage [ VOLTAGE ] : SMC CPU CORE [ VOLTAGE ] : SMC CPU SUPPLY 1 [ VOLTAGE ] :
SMC DC INPUT [ VOLTAGE ] :
SMC POWER SUPPLY / BATTERY [ VOLTAGE ] :
SMC SSD SUPPLY [ VOLTAGE ] : SMC WLAN CARD [ VOLTAGE ] : Battery 1 Current [ CURRENT ] : SMC 5 V SO LINE [ CURRENT ] : SMC BACKLIGHT ( CURRENT ] : SMC BATTERY CURRENT ( CURRENT ] : SMC CPU CORE ( CURRENT ] : SMC CPU HIGH SIDE [ CURRENT ] : SMC CPU SUPPLY 1 [ CURRENT ] : SMC CPU / VRM SUPPLY 2 [ CURRENT ] : SMC DC INPUT ( CURRENT ] :
SMC DDR3 MEMORY 1.35 V LINE [ CURRENT ] :
SMC DDR3 MEMORY S3 LINE [ CURRENT ] : SMC DISCRETE BATTERY [ CURRENT ] :
SMC LCD PANEL ( CURRENT ) :
SMC POWER SUPPLY / BATTERY ( CURRENT ) : SMC SSD SUPPLY ( CURRENT ) :
SMC WLAN CARD [ CURRENT ] :
SMC 5 V SO LINE [ POWER ] :
SMC BACKLIGHT [ POWER ] : SMC CPU CORE [ POWER ] :
SMC CPU HIGH SIDE [ POWER ] : SMC CPU SUPPLY 1 [ POWER ] : SMC CPU / VRM SUPPLY 2 [ POWER ] :
SMC DDR3 MEMORY 1.35 V LINE [ POWER ] : SMC DDR3 MEMORY S3 LINE [ POWER ] : SMC LCD PANEL [ POWER ] :
SMC POWER SUPPLY / BATTERY [ POWER ] :
SMC SSD SUPPLY [ POWER ] :
SMC WLAN CARD [ POWER ] :
Battery 1 Current Capacity [ CAPACITY ] : Battery 1 Total Capacity [ CAPACITY ] : SMC FAN Exhaust [ RPMS ] :
SMC AMBIENT LIGHT 1 [ LIGHT ] :
98.6 F. 138.2 F. 120.2 F. 98.6 F. 82.4 F. 3.69299 V 3.69398 V 7.38699 V 1.66211 V 1.05176 V 0 V 7.16016 V 3.29883 V 3.29883 V 1.45599 A 0.0498047 A 0.00292969 A 0.78125 A 0.566406 A 0.241211 A 0.0107422 A ? ? 0.00195312 A 0.881836 A 0.0771484 A 0.738281 A 0.000976562 A 0.770508 A 0.0771484 A 0.0107422 A 0.164062 W 0.015625 W 0.964844 W 1.72266 W 0.0078125 W 0 W 1.05469 W 0.0898438 W 0 W 5.51172 W 0 25 W 0.0351562 W 503 mAh 6559 mAh 1192 RPM 70 TABLE I
APPLE MACBOOK INTERNAL SENSORS AND READINGS Apple Macbook Sensor Value
136.4 F. 102.2 F. 87.8 F. 111.2 F. SMART Disk APPLE SSD SD0128F
( 135251405113 ) [ TEMPERATURE ] :
SMC AIR INLET [ TEMPERATURE ] : SMC BATTERY [ TEMPERATURE ] :
SMC BATTERY CHARGER PROXIMITY
[ TEMPERATURE ] :
SMC BATTERY POSITION 2 [ TEMPERATURE ] :
SMC BATTERY POSITION 3 [ TEMPERATURE ] : SMC CAMERA PROXIMITY [ TEMPERATURE ] :
SMC CHARGER PROXIMITY TEMPERATURE [ TEMPERATURE ] :
SMC CPU A PROXIMITY [ TEMPERATURE ] :
87.8 F. 87.8 F. 113 F. 100.4 F. 120.2 F.
-continued
// set condition to under attack if positive predictions
// increase above threshold if attack count > threshold :
under_attack = True
[ 0019 ] In some implementations , the sensor - monitoring module 102 can determine prediction models using Machine
Learning ( ML ) techniques . In these instances , the sensor monitoring module 102 trains models using a large amount of data gathered and processed from an experimental envi
ronment . The sensor - monitoring module 102 can use the
sensor data , such as that provided in Table 1 , to form a
feature vector that differentiates between the binary machine
states of “ normal operation ” versus “ ransomware payload
execution ” ( i.e. , unauthorized encryption activity ) . Instead
of relying one type of sensor data , the feature vector can combine multiple types of sensor data . In response to thesensor - data feature vector indicating a specific state of
encryption , the sensor - monitoring module 102 can issue
alerts and suspend the corresponding encryption processes .
[ 0020 ] In some instances , the sensor - monitoring module
102 can use a simple logistic regression approach as the ML
classification algorithm to discriminate between the binary states of “ normal operation ” versus “ ransomware payload
execution . ” Other alternative classification algorithms can be used without departing from the scope of the disclosure . In addition , the feature vector may be refined using tech niques such as Principal Component Analysis ( PCA ) , Linear
Discriminant Analysis ( LDA ) , and others . In some imple
mentations , the sensor - monitoring module 102 can train the prediction models using different methods of encryption
such as Electronic Code Book , Cipher - Block Chaining ,
Cipher FeedBack , XOR encryption , and others .
[ 0021 ] In some aspects of operations , the sensor - monitor ing module 102 receives a training set of hardware sensor
data . The hardware sensor data can include data when how
the sensors behave on the host computer under normal
operating conditions as well data when a covert encryption
process is executed . After the sensor training data has been
retrieved , the sensor - monitoring module 102 can perform
logistic regression to fit the model to the training data . Due
to the slight variation between the components of each computer , the resulting ransomware detection model may be
different for different devices . Once determined , the sensor
monitoring module 102 can use the model to classify the
state of the computing device 100 whenever the hardware
sensors are routinely polled . If the model predicts that a suspicious encryption process is executing , the sensor - moni
toring module 102 can notify the user and suspend or
terminate the suspicious process . In some implementations , the detection algorithm can run as a background process to allow normal usage of the system . A pseudocode version of the detection algorithm is provided below .
[ 0022 ] FIGS . 2-5 illustrate example results for testing
conducted on two different computing devices . Testing was
conducted on two mputing devices , one running Apple
OSX® and the other running Microsoft Windows® . Spe cifically , the Apple OSX machine was a Macbook Air with a 1.3 GHz Intel® i5 processor and 4 GB of main memory and the Windows® machine was an Intel® i7 processor with 32 GB of main memory .
[ 0023 ] Training data was collected on both computing
devices and the data was used to generate a prediction model
for each computing device . The new encryption detection method was tested utilizing a ransomware simulation testing script written in Python . The size of the directory and the
method of encryption were selected by randomly picking a
number between 1 and 100. All values of 60 and below
caused encryption of the small directory , all values from 61
to 90 encrypted the medium directory , and all values from 91
to 100 encrypted the large directory . The particular encryp
tion method used was randomly selected among the four
types we implemented in our experiments .
[ 0024 ] After a particular directory has been encrypted , the
script waits a random amount of time before performing
additional encryption . The amount of time it waits is pro portional to the size of the directory it previously encrypted . After encrypting a small directory , a random amount of time
between 1 and 60 seconds is selected , a time between 5 and 10 minutes is selected for the medium directory , and a time
between 15 and 30 minutes is selected for the large directory . The script also randomly selects a value between 5 and 15
and waits for an hour and a half after encrypting that many gigabytes of data . Randomness and wait times are utilized in
order to simulate the attempts made by an adversary to avoid
detection of ransomware payload execution . During theencryption process , the script searches for files by recur
sively starting from a given path . Files that have extensions
matching a list of common user file types are read and their
data is encrypted . After encryption the data is copied over
the existing data in the original file . After testing theWindows® machine for 5 hours 94.2 % of sensor polls were
accurately predicted as either “ under attack ” or “ no attack ” . The confusion matrix in FIG . 2 shows the relationship
between the predictions made by the model and the actual
state of the computing device . During the periods the script
was performing encryption 98.1 % of polling predictions
correctly identified a state of under attack . During the
periods , the script was not performing encryption 92.5 % of
polling predictions correctly identified a state of no attack .
[ 0025 ] 1.9 % of the checks that occurred during periods ofencryption incorrectly predicted that there was no attack
( i.e. , a false negative error ) while 7.5 % of periods with noencryption incorrectly predicted that there was an attack ( i.e. , a false positive error ) . The classification method was
tuned in a conservative fashion to focus more upon the reduction of false negative errors than the case of false positives as the former error type is assumed to be more
critical than the latter . ==
// load model from binary file
model load ( " ./ model , pkl ' )
attack_count = 0
previous_prediction 0
under_attack False
Il check sensor data and make prediction
while True
data monitor.read_sensors ( )
prediction = model.predict ( data )
Il determine action based on current and // previous data if prediction : attack_count + = 1 else : if previous_prediction 0 : attack_count 0 under_attack False previous_prediction = data
US 2020/0279043 A1
Sep. 3 , 2020
4
[ 0026 ] The overall accuracy of the encryption detection
method is illustrated in FIG . 3. The uppermost graph , ( a ) , of the figure represents the actual periods of encryption or
“ truth data ” while the plot on the bottom , ( b ) , represents the
actual predicted periods of encryption . These graphs depict the machine state on the vertical axis with zero indicating
normal operation and one indicating under attack . The
horizontal axes depict time . The Apple computing device was tested by only encrypting the large directory after a random wait period between 30 and 60 minutes over a 6 - hour period . This method gives a clear indication of how well the new detection method can detect periods of high volume encryption . The confusion matrix in FIG . 4 shows the relationship between the predictions made by the model
and the actual state of the computing device .
[ 0027 ] After testing the Apple machine , 98.2 % of the sensor polls resulted in accurate predictions . During the
periods the script was actually performing an encryption
operation , 99.7 % of the polling predictions correctly iden tified a state of “ under attack . ” During the periods the script
was not performing encryption , 97.7 % of polling predictions
correctly identified a state of “ no attack . ” A false negative rate of 0.27 % of the checks that occurred during periods of
encryption incorrectly predicted that there was no attack
while a false positive error rate of 2.3 % of observations with no encryption incorrectly predicted that there was an attack .FIG . 5 shows the periods of actual encryption in the upper
most portion , ( a ) , and periods of predicted encryption in the
lower portion , ( b ) . As in FIG . 3 , the vertical axes depict
machine state and the horizontal axes depict time . [ 0028 ] Upon further analysis of the results , most periods of false positive predictions occurred directly after a correct
attack prediction . This can be observed in FIG . 5 which contains false positive periods after the second and fourth
encryption periods . Implementing additional testing and
filtering techniques that more closely scrutinize predictions being made for a short period directly following a positive
prediction period can result in increased overall
accuracy . Insome implementations , temporal or history data regarding
past recent predictions may be included in the analysis .
[ 0029 ] Legitimate encryption can be accounted using
white - listing or other methods that notify the detection
process that legitimate encryption operations are in process .
For example , system registry data can be used to label processes that employ legitimate encryption and the ran somware detection process can be augmented to verify if a detection is the result of a legitimate process or not before a state of “ ransomware payload execution ” is declared .
[ 0030 ] In some implementations , experimental ransom
ware detection algorithm can use a simple polling or sam
pling method wherein the operational phase of the detection
method would periodically query the sensors to obtain
readings . This approach suffers from potential aliasing prob lems , particularly if the malware payload were to be imple mented in short bursts or use some other form of intelligence about the state of the victim system before encryption is executed . In some implementations , the schedule sensor
queries can be an event - based technique . In these instances ,
error rates can be reduced while also reducing the average
computational overhead since ransomware payload execu
tion is a relatively rare event .
[ 0031 ] The method can be applicable to both previously
known as well as zero - day instances of ransomware that employ encryption in the payload . The detection method
results in very low , if any , data loss since encryption
detection can occur very early in the timespan of the malicious encryption activity . For example , the data loss
may be less than 5 % , 1 % , or 0.1 % . The method is based
upon monitoring on - board , hardware sensor data streams
rather than characteristics of the targeted data . The new
technique may not include modification to hosting computer
systems because most computing devices include pre - exist
ing physical sensors , supporting circuitry , and access to the
sensor readings .
[ 0032 ] FIG . 6 is a flow diagram illustrating an example
method 600 of analyzing a partial software program , accord ing to an implementation . For clarity of presentation , the description that follows generally describes method 600 in the context of the other figures in this description . However , it will be understood that method 600 may be performed , for
example , by any suitable system , environment , software ,
and hardware , or a combination of systems , environments , software , and hardware , as appropriate . For example , method 200 can be performed by the example computing system 100 illustrated in FIG . 1. In some implementations , various steps of method 600 can be run in parallel , in
combination , in loops , or in any order .
[ 0033 ] The method 600 begins at step 602 where sensor
data is collected during normal operations . For example , the sensor - monitoring module 102 can retrieve sensor data during normal operations . Ransomware encryption is simu
lated at step 604 , and the sensor data is retrieved during that
simulation at step 606. Next , at step 608 , a predictive model
is trained using both data sets . Once trained , sensor data of the computing device is monitored , at step 610 , using the trained predictive model and sensor data to detect ransom ware encryption . At step 612 , initiation of ransomware
encryption is detected using the trained predictive model and
sensor data . At step 614 , the encryption is at least suspended . [ 0034 ] A number of embodiments of the invention have
been described . Nevertheless , it will be understood that
various modifications may be made without departing from
the spirit and scope of the invention . Accordingly , other
embodiments are within the scope of the following claims .
1. A method , comprising :
retrieving sensor data from multiple sensors in a comput
ing device , wherein the multiple sensors comprise different types of sensors to monitor an operating condition of internal hardware components of the com puting device , and the sensor data reflective of the
operating condition of the internal hardware compo
nents ;
analyzing the sensor data based on a predictive model ,
wherein the predictive model is trained to detect mal
ware ;
determining initiation of malware based on the analysis ;
and
in response to the determination , terminating the malware .
2. The method of claim 1 , wherein the malware comprises ransomware , and initiation of ransomware encryption is
detected .
3. The method of claim 2 , further comprising :
retrieving sensor data from the multiple sensors during normal operation of the computing device ;
simulating initiation of a ransomware encryption ;
retrieving sensor data from the multiple sensors during the
training the predictive model using the sensor data during the normal operation and the simulation .
4. The method of claim 3 , wherein the predictive model
comprises a feature vector determined using machine learn
ing .
5. The method of claim 1 , wherein the multiple sensors
comprise a sensor for at least one of a main memory power ,
voltage , current , or temperature .
6. The method of claim 1 , wherein the analysis is per
formed at least one of continuously , periodically , or event
triggered .
7. The method of claim 1 , further comprising determining whether an encryption is authorized using a white list .
8. The method of claim 1 , wherein the malware is a zero - day instance of malware .
9. The method of claim 1 , wherein the predictive model comprises a hardware module .
10. The method of claim 1 , wherein at least one of the
multiple sensors is integral to the computing device .
11. A mobile device , comprising :
multiple sensors ;
one or more processors ; and
a non - transitory computer - readable storage medium
coupled to the one or more processors and storing
programming instructions for execution by the one or
more processors , the programming instructions instruct
the one or more processors to :
retrieve data from multiple sensors in a computing
device , wherein the multiple sensors comprise dif
ferent types of sensors to monitor an operating condition of internal hardware components of the
computing device , and the sensor data reflective of the operating condition of the internal hardware
components ;
analyze the sensor data based on a predictive model , wherein the predictive model is trained to detect
malware ;
determine initiation of malware based on the analysis ;
and
in response to the determination , terminate the mal
simulating initiation of a ransomware encryption ;
retrieving sensor data from the multiple sensors during the
simulation , and
training flail the predictive model using the sensor data
during the normal operation and the simulation .
14. The mobile device of claim 13 , wherein the predictive model comprises a feature vector determined using machine learning
15. The mobile device of claim 11 , wherein the multiple
sensors comprise a sensor for at least one of a main memory power , voltage , current , or temperature .
16. A non - transitory computer readable medium storing instructions to cause a processor to perform operations comprising :
retrieving data from multiple sensors in a computing
device , wherein the multiple sensors comprise different
types of sensors to monitor an operating condition of
internal hardware components of the computing device ,
and the sensor data reflective of the operating condition of the internal hardware components ;
analyzing the sensor data based on a predictive model ,
wherein the predictive model is trained to detect mal
ware ;
determining initiation of malware based on the analysis ;
and
in response to the determination , terminating the malware . 17. The non - transitory computer readable medium of claim 16 , wherein the malware comprises ransomware , and
initiation of ransomware encryption is detected .
18. The non - transitory computer readable medium of
claim 17 , the instructions further comprising :
retrieving sensor data from the multiple sensors during normal operation of the computing device ;
simulating initiation of a ransomware encryption ;
retrieving sensor data from the multiple sensors during the
simulation ; and
training the predictive model using the sensor data during the normal operation and the simulation .
19. The non - transitory computer readable medium of
claim 18 , wherein the predictive model comprises a feature vector determined using machine learning .
20. The non - transitory computer readable medium of
claim 16 , wherein the multiple sensors comprise a sensor for
at least one of a main memory power , voltage , current , or
temperature .
ware .
12. The mobile device of claim 11 , wherein the malware
comprises ransomware , and initiation of ransomware encryption is detected .
13. The mobile device of claim 12 , the programming
instructions further comprising :
retrieving sensor data from the multiple sensors during