Thermal-to-visible face recognition using
partial least squares
Shuowen Hu,1,* Jonghyun Choi,2Alex L. Chan,1and William Robson Schwartz3 1U.S. Army Research Laboratory, 2800 Powder Mill Rd., Adelphi, Maryland 20783, USA 2University of Maryland, 3436 A.V. Williams Building, College Park, Maryland 20742, USA 3Federal University of Minas Gerais, Av. Antonio Carlos, 6627, Belo Horizonte 31270-901, Brazil
*Corresponding author: [email protected]
Received July 1, 2014; revised December 18, 2014; accepted January 4, 2015; posted January 12, 2015 (Doc. ID 214888); published February 12, 2015
Although visible face recognition has been an active area of research for several decades, cross-modal face recognition has only been explored by the biometrics community relatively recently. Thermal-to-visible face recognition is one of the most difficult cross-modal face recognition challenges, because of the difference in phenomenology between the thermal and visible imaging modalities. We address the cross-modal recognition problem using a partial least squares (PLS) regression-based approach consisting of preprocessing, feature extraction, and PLS model building. The preprocessing and feature extraction stages are designed to reduce the modality gap between the thermal and visible facial signatures, and facilitate the subsequent one-vs-all PLS-based model building. We incorporate multi-modal information into the PLS model building stage to enhance cross-modal recognition. The performance of the proposed recognition algorithm is evaluated on three challenging datasets containing visible and thermal imagery acquired under different experimental scenarios: time-lapse, physical tasks, mental tasks, and subject-to-camera range. These scenarios represent difficult chal-lenges relevant to real-world applications. We demonstrate that the proposed method performs robustly for the examined scenarios. © 2015 Optical Society of America
OCIS codes: (150.1135) Algorithms; (100.5010) Pattern recognition; (100.2000) Digital image processing.
http://dx.doi.org/10.1364/JOSAA.32.000431
1. INTRODUCTION
Face recognition has been an active area of research in com-puter vision and image processing for the past few decades with broad applications in both military and civilian sectors. Numerous techniques have been developed to perform face recognition in the visible spectrum and to address key chal-lenges that include illumination variations, face poses, and image resolution. Despite the advances in visible spectrum face recognition research, most of these techniques cannot be applied directly to the challenging cross-modal face recog-nition problem, which seeks to identify a face image acquired with one modality by comparing it with a gallery of face im-ages that were acquired in another modality. For cross-modal face recognition, identifying a thermal probe image based on a visible face database (i.e., thermal-to-visible face recognition) is especially difficult because of the wide modality gap be-tween thermal and visible phenomenology, as thermal imag-ing acquires emitted radiation while visible imagimag-ing acquires reflected light. The motivation behind thermal-to-visible face recognition is the need for enhanced intelligence gathering capabilities in darkness, when surveillance with visible cam-eras is not feasible. Electromagnetic radiation in the thermal spectrum is naturally emitted by skin tissue, which allows thermal images to be discreetly collected without any illumi-nation sources. Acquired thermal face images have to be iden-tified using the images from existing face databases, which often consist of visible face imagery exclusively.
We propose a thermal-to-visible face recognition method consisting of preprocessing, feature extraction based on a
histogram of oriented gradients (HOG), followed by partial least squares (PLS)-based model building. We further improve the cross-modal recognition accuracy by incorporating ther-mal cross-examples. An extensive evaluation of the proposed approach has been conducted using three diverse multi-modal face datasets: the University of Notre Dame (UND) Collection X1, a dataset collected by the Wright State Research Institute (WSRI), and a dataset acquired by the U.S. Army Night Vision and Electronic Sensors Directorate (NVESD). We examine thermal-to-visible face recognition performance with respect to four different experimental scenarios: time-lapse, exercise, mental task/expression, and subject-to-camera range. To the best of our knowledge, this is the first work to conduct a multi-condition and multi-dataset performance assessment for thermal-to-visible face recognition. The proposed PLS-based thermal-to-visible face recognition approach achieves robust recognition accuracy across all three datasets. The main emphases of this work are on (1) the proposed thermal-to-visible face recognition algorithm and (2) a detailed performance evaluation across multiple conditions.
The paper is organized as follows. Section2addresses the background and prior work for thermal-to-visible face recogni-tion. Section 3 describes the three stages of the proposed thermal-to-visible face recognition approach: preprocessing, feature extraction, and PLS-based model building. Section4 provides detailed information of each dataset, such as exper-imental factors, number of images, and sensor specifications. Section5reports the thermal-to-visible face recognition perfor-mance for each dataset and the corresponding experimental
conditions. Section6discusses the key findings for thermal-to-visible face recognition and provides some potential insights for future multi-modal data collections, followed by the conclu-sion in Section7.
2. BACKGROUND AND RELATED WORK
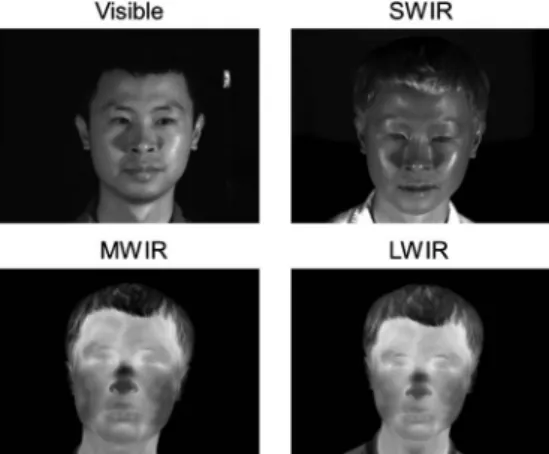
The infrared (IR) spectrum is often divided into a reflection-dominated band consisting of a near IR (NIR, 0.74–1μm) re-gion and a short-wave IR (SWIR, 1–3μm) region, and an emis-sion-dominated thermal band consisting of a mid-wave IR (MWIR, 3–5 μm) region and a long-wave IR (LWIR, 8– 14μm) region. Reflected IR is dependent on material reflec-tivity, while thermal IR is dependent on the temperature and emissivity of the material [1]. Human facial skin tissue is highly emissive, characterized by Wolffet al.as having emis-sivity of 0.91 in the MWIR region and 0.97 in the LWIR region [2]. Wolffet al.also theorized that part of the thermal radiation emitted from the face arises from the underlying internal anatomy through skin tissue in a transmissive manner [2]. Figure1shows an example of facial images of a subject simul-taneously acquired in the visible, SWIR, MWIR, and LWIR spectra. The visible and SWIR facial signatures appear visually similar, because of the common reflective phenomenology between visible and SWIR modalities. On the other hand, the MWIR and LWIR images differ substantially in appearance from the visible image, illustrating the large modality gap between thermal and visible imaging.The earliest efforts in cross-modal face recognition inves-tigated matching between NIR and visible face images. Yiet al.
used principal component analysis (PCA) and linear discrimi-nant analysis (LDA) for feature extraction and dimensionality reduction, followed by canonical correspondence analysis (CCA) to compute the optimal regression between the NIR and visible modalities [3]. Klare and Jain utilized local binary patterns (LBP) and HOG for feature extraction, and LDA to learn the discriminative projections used to match NIR face images to visible face images [4]. Some studies have also focused on SWIR-to-visible face recognition [5,6]. Visible, NIR, and SWIR imaging all share similar phenomenology, as all three modalities acquire reflected electromagnetic radiation. In contrast, thermal imaging acquires emitted radiation in the MWIR or LWIR spectra, resulting in very different facial signatures from those in the visible domain.
Some earlier works that utilized thermal facial imagery for face recognition focused on within-modal face matching or multi-modal fusion of visible and thermal facial signatures for illumination invariance. Socolinsky and Selinger demon-strated that within-modal LWIR-to-LWIR face recognition can achieve even higher performance than visible-to-visible face recognition by using LDA [7]. Buddharajuet al.proposed a physiology-based technique for within-modal thermal face recognition using minutiae points extracted from thermal face images [8]. Konget al.proposed a discrete wavelet transform (DWT)-based multi-scale data fusion method for visible and thermal imagery to improve face recognition performance [9]. However, only recently has cross-modal thermal-to-visible face recognition research emerged in the literature.
To the best of our knowledge, there are only a few studies addressing thermal-to-visible face recognition, other than our preliminary conference article on the topic [10]. Bourlaiet al.
proposed a MWIR-to-visible face recognition system consist-ing of three main stages: preprocessconsist-ing, feature extraction, and matching using similarity measures [11]. For feature extraction, Bourlai et al. investigated pyramid HOG, scale-invariant feature transform (SIFT), and four LBP-based fea-ture variants. Using a dataset consisting of 39 subjects with four visible images per subject and three MWIR images per subject acquired from a state-of-the-art FLIR SC8000 MWIR camera with 1024×1024 pixel resolution, Bourlai et al. re-ported that the best performance (0.539 Rank-1 identification rate) was achieved with difference-of-Gaussian (DOG) filter-ing for preprocessfilter-ing, three patch LBP for feature extraction, and chi-squared distance for matching. Bourlai et al. exam-ined the identification performance of their technique extensively [11].
Klare and Jain developed a thermal-to-visible face recogni-tion approach using kernel prototypes with multiple feature descriptors [12]. More specifically, they proposed a nonlinear kernel prototype representation of features extracted from heterogeneous (i.e., cross-modal) probe and gallery face im-ages, followed by LDA to improve the discriminative capabil-ities of the prototype representations. For thermal-to-visible face recognition, they utilized images from 667 subjects for training and 333 subjects for testing, with MWIR imagery acquired using a 640×480 pixel resolution FLIR Recon III ObserveIR camera (dataset from the Pinellas County Sheriff’s Office). In terms of identification performance, Klare and Jane achieved a Rank-1 identification rate of 0.492. For face verification performance, also referred to as authentication performance, their technique achieved a verification rate of 0.727 at a false alarm rate (FAR) of 0.001, and a verification rate of 0.782 at FAR0.01. Note that their gallery for testing consisted of visible images from the testing set of 333 subjects, augmented by visible images from an additional 10,000 sub-jects to increase the gallery size [12]. A qualitative comparison of our results with those reported in [11,12] is provided. How-ever, an exact quantitative comparison is difficult, as [11,12] utilized different datasets and gallery/probe protocols. Fur-thermore, detailed dataset and protocol descriptions (e.g., ex-perimental setup, factors/conditions and number of images per subjects) are often not specified in previous literature. In this work, we provide an in-depth description of the data-sets and evaluate thermal-to-visible face recognition perfor-mance with respect to the experimental factors/conditions of
Fig. 1. Face signatures of a subject from the NVESD dataset simul-taneously acquired in visible, SWIR, MWIR, and LWIR.
each dataset. We show that the proposed thermal-to-visible face recognition approach achieves robust performance across the datasets and experimental conditions.
3. PLS-BASED THERMAL-TO-VISIBLE FACE
RECOGNITION
The proposed thermal-to-visible face recognition approach has three main components: preprocessing, feature extrac-tion, and PLS-based model building and matching. The goal of preprocessing is to reduce the modality gap between the reflected visible facial signature and the emitted thermal facial signature. Following preprocessing, HOG-based features are extracted for the subsequent one-vs-all model building. The PLS-based modeling procedure utilizes visible images from the gallery, as well as a number of thermal“cross-examples” from a small set of training subjects, to build discriminative models for cross-modal matching.
A. Preprocessing
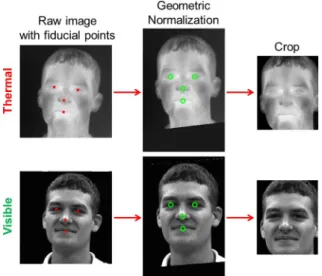
The preprocessing stage consists of four components applied in the following order: median filtering of dead pixels, geomet-ric normalization, difference-of-Gaussian (DOG) filtering, and contrast enhancement. LWIR sensor systems typically exhibit some dead pixels distributed across the image. To remove these dead pixels, a3×3median filter is applied locally at the manually identified dead pixel locations. No dead pixels were observed in any visible or MWIR imagery. Next, the face images of all modalities are geometrically normalized through an affine transform to a common set of canonical coordinates for alignment, and cropped to a fixed size (Fig.2). Four fidu-cial points are used for geometric normalization: right eye center, left eye center, tip of nose, and center of mouth. These points were manually labeled for each modality in the three datasets.
The normalized and cropped visible and thermal face im-ages are then subjected to DOG filtering, which is a common technique to remove illumination variations for visible face recognition [13]. DOG filtering, defined in Eq. (1), not only re-duces illumination variations in the visible facial imagery, but also reduces local variations in the thermal imagery that arises
from varying heat/temperature distribution of the face. There-fore, DOG filtering helps to narrow the modality gap by reduc-ing the local variations in each modality while enhancreduc-ing edge information. For this work, Gaussian bandwidth settings of σ01andσ12are used in processing all the datasets. IDOGx; yjσ0;σ1 1 2πσ2 0 q e−x2y2∕2σ2 0− 1 2πσ2 1 q e−x2y2∕2σ2 1 Ix; y (1)
The last step of preprocessing is a nonlinear contrast normalization to further enhance the edge information of the DOG filtered thermal and visible images. The specific normalization method is given by Eq. (2), which maps the input pixel intensities onto a hyperbolic tangent sigmoid ac-cording to the parameterτ(which is typically set to 15 for this work): ICx; y τ tanh IDOGx; y τ . (2)
Figure3compares the aligned thermal and visible images with the results after DOG filtering and after nonlinear con-trast enhancement. As exhibited in this figure, DOG filtering removes the local temperature variations in the thermal face image and the local illumination variations in the visible face image, thus helping to reduce the modality gap. The nonlinear contrast normalization serves to further enhance edge infor-mation.
B. Feature Extraction
Subsequent to preprocessing, feature extraction using HOG is the second stage of the proposed thermal-to-visible face recognition algorithm. HOG was first introduced by Dalal and Triggs [14] for human detection and shares some similar-ity with the SIFT descriptor [15]. HOG features are essentially edge orientation histograms, concatenated across cells to form blocks, and collated across a window or an image in a densely overlapping manner. HOG features have since proven to be highly effective for face recognition applications as well [16]. In this work, HOG serves to encode the edge orientation features in the preprocessed visible and thermal face imagery, as edges are correlated in both modalities after preprocessing.
Fig. 2. Raw thermal and visible images with manually labeled fidu-cial points from the WSRI dataset are geometrically normalized to canonical coordinates and cropped.
Fig. 3. Comparison of aligned thermal and visible images, showing original intensity images, as well as after DOG filtering and contrast normalization.
In visible face imagery, edges arise because of the reflection of light from the uneven 3D structure of the face, and because of the reflectivity of different tissue types. In thermal face imagery, edges arise because of varying heat distribution, es-pecially at junctions of different tissue types (e.g., eyes, nose, lips, and hair). From Fig.3, the occurrence of edges in both the visible and thermal imagery can be observed to be highly correlated at key anatomical structures, such as the eyes, nose, and lips. For this work, the HOG block size is16×16 pixels and the stride size is 8 pixels.
C. PLS-based Recognition
The final recognition/matching stage of the proposed ap-proach is based on PLS regression. PLS originated with the seminal work of Herman Wold in the field of economics [17], and has been applied effectively in computer vision and pat-tern recognition applications recently [18–21]. PLS regression is robust with respect to multicollinearity [22], which fre-quently arises in computer vision applications where high dimensional features (i.e., descriptor variables) are highly correlated.
In this work, the recognition/matching stage is based on the one-vs-all PLS-based framework of Schwartz et al. [21]. Let Xn×mbe a matrix of descriptor variables, wherenrepresents the number of samples andmrepresents the feature dimen-sionality of the samples, and let yn×1 be the corresponding
univariate response variable. PLS regression finds a set of components (referred to as latent vectors) fromX that best predicty:
XTPTXres; (3)
yUqTy
res. (4)
In Eqs. (3)–(4), the matricesTn×pandUn×pare called scores
and containpextracted latent vectors (tiandui;i1;…; p), Pm×pandq1×pare the loadings, andXresandyresare the
resid-uals. PLS regression finds latent vectorstianduiwith maxi-mal covariance, by computing a normaxi-malized m×1 weight vectorwithrough the following optimization problem:
maxcovti;ui2maxjwi1jcovXwi;y2i1;…; p. (5) Equation (5) can be solved iteratively through a method called nonlinear iterative partial least squares (NIPALS), gen-erating the weight matrixWcontaining the set of weight vec-torswi,i1;…; p[23]. After obtaining the weight matrix, the responseyf to a sample feature vectorf can be computed by Eq. (6), wherey¯is the sample mean ofyandβm×1is the vector
containing the regression coefficients [24]:
yf y¯βTf y¯ WPTW−1TTyf: (6) 1. One-vs-All Model Building
For thermal-to-visible face recognition, the gallery is con-structed to contain only visible face images, similar to most existing government face datasets and watch lists. The probe images (i.e., query set) are provided from the thermal spec-trum exclusively for thermal-to-visible face recognition. Given a visible image galleryG fv1;v2;…;vNgconsisting ofN indi-viduals, a one-vs-all PLS model (i.e., regression coefficientβi,
i1;…; N) is built for each individual, utilizing the feature vectors extracted from the preprocessed visible images of individualvias positive samples and the feature vectors ex-tracted from the visible images belonging to all the other indi-viduals as negative samples [21]. Therefore, each row of the matrixXcontains the feature vector extracted from a prepro-cessed gallery face image, and the corresponding response vector y is a vector containing 1 for a positive sample and−1for a negative sample. Note that for any individual’s model in this one-vs-all approach, an imbalance exists be-tween the number of positive samples and the number of negative samples, as the number of individuals in the gallery is typically greater than the number of images for a given subject. PLS has been demonstrated to be robust to such data imbalance [25].
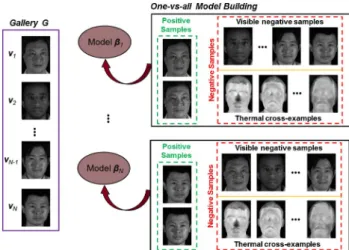
In this work, thermal information is incorporated into the one-vs-all model building process by utilizing“thermal cross-examples” as part of the negative samples. Thermal cross-examples provide useful cross-modal information to the negative set, in addition to the visible imagery, as the results section shows. These thermal cross-examples are the feature vectors extracted from a set of preprocessed thermal training images belonging to individuals not in the gallery, which en-able PLS to find latent vectors that could perform cross-modal matching more effectively by increasing the discriminability between a given subject (positive samples) and the remaining subjects (negative samples). Therefore, the negative samples for each individual’s PLS model consists of feature vectors ex-tracted from the visible images of all the other individuals in the gallery and thermal cross-examples from a set of individ-uals not in the gallery, which stay the same across all the mod-els (illustrated in Fig.4).
2. Matching of Thermal Probe Samples
After the one-vs-all PLS models are constructed for theN indi-viduals in the gallery (i.e., regression coefficientsβ1;…;βN), cross-modal matching is performed using thermal probe im-ages. Let τ be the feature vector extracted from a thermal probe image. τ is projected onto each of the N models, generatingN responsesyiτβTiτ, i1;…;N. For face iden-tification, the individual represented in the probe image is assumed to be one of the individuals in the gallery and the
Fig. 4. Illustration of one-vs-all PLS model building. Note that face images shown here actually represent the feature vectors used for model building.
Rank-K performance is computed by evaluating whether the response corresponding to the true match is among the topK response values. For face verification, where the system is tasked in determining whether or not the person in the probe image is the same as a person in the gallery, the verification rate can be computed by treating each response yiτ as a similarity measure.
4. DATASET DESCRIPTION
Three datasets are utilized in this work to evaluate the perfor-mance of the proposed thermal-to-visible face recognition approach: UND Collection X1, WSRI Dataset, and NVESD Dataset. Each dataset was collected with different sensor sys-tems and contains images acquired under different experi-mental conditions, also referred to as experiexperi-mental factors. Evaluating the performance of the proposed thermal-to-visible face recognition approach on these three extensive datasets enables an assessment of not only the accuracy of the proposed algorithm, but also of how different factors affect cross-modal face recognition performance. Table1 con-tains a summary of sensor resolutions, with a detailed descrip-tion of each dataset in the subsequent subsecdescrip-tions.
A. UND Collection X1
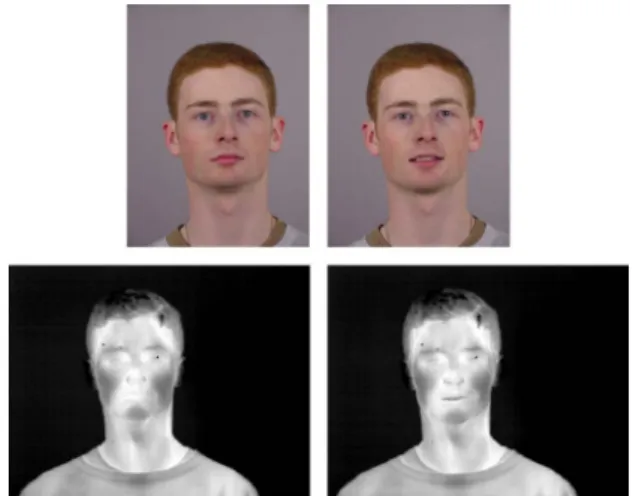
UND Collection X1 is a publicly available face dataset col-lected by the University of Notre Dame from 2002 to 2003 us-ing a Merlin uncooled LWIR camera and a high resolution visible color camera [26–28]. Three experimental factors were examined by the collection: expression (neutral and smiling), lighting (FERET style and mugshot lighting), and time-lapse (subjects participated in multiple sessions over time). Figure5 displays visible and corresponding thermal images of a sub-ject acquired under the two expression conditions (neutral and smiling). The imagery in the“ir”and“visible” subdirecto-ries of UND X1 is used for this work, consisting of visible and LWIR images acquired across multiple sessions for 82 distinct subjects. The total number of images is 2,292, distributed evenly between the visible and LWIR modalities. Note that the number of images for each subject varies, with a minimum of eight and a maximum of 80 across the 82 subjects. As part of the dataset, record files store the metadata for all images, including the manually marked eyes, nose, and center of mouth coordinates.
B. WSRI Dataset
The WSRI dataset was acquired over the course of several studies conducted by the Wright State Research Institute at Wright State University. The dataset was originally collected to perform physiologic-based analysis of the thermal facial sig-nature under different conditions, and has been repurposed for this work to assess the performance of thermal-to-visible face recognition. The dataset was collected using
simultaneous acquisition from a monochrome Basler A202k visible camera and a FLIR Systems SC6700 MWIR camera, and studied three conditions: physical tasks, mental tasks, and time-lapse. Physical tasks consisted of inflating balloon, walking, jogging, and stationary bicycling, inducing various degrees of physiologic changes. Mental tasks consisted of counting backwards in serial sevens (e.g., 4135, 4122, and 4115) and reciting the alphabet backwards. Because of the challenging nature of these mental tasks that require the sub-jects to count or recite verbally, facial expression varied sig-nificantly during the course of each mental task. Note that a baseline was acquired for each subject prior to conducting the physical and/or mental tasks. For the time-lapse condition, the subject was imaged three times per days for five consecutive days. Twelve distinct subjects participated in only one of the time-lapse, mental, and physical conditions, which amount to a total of 36 subjects. Another 25 distinct subjects participated in both mental and physical tasks. For each acquisition of a given condition and task, a video of two to three minutes in length was recorded at 30 Hz using the visible and the MWIR cameras. To form a set of gallery and probe images for face recognition, each video is sampled once per minute, so that the face images extracted from a video sequence exhibit some pose differences. Note that consecutive frames tend to be nearly identical because of the high 30 Hz frame rate, whereas noticeable differences can be observed across one minute.
In addition to the 61 subjects containing multi-condition video data described previously, a pool of 119 subjects with three visible and three corresponding MWIR images is used to increase the gallery size for a more challenging evaluation. Co-ordinates of four fiducial points (left eye, right eye, tip of nose, and center of mouth) were manually annotated and recorded for all visible and MWIR images.
C. NVESD Dataset
The NVESD dataset [29] was acquired as a joint effort between the Night Vision Electronic Sensors Directorate of the U.S. Army Communications-Electronics Research, De-velopment and Engineering Center (CERDEC), and the U.S. Army Research Laboratory (ARL). A visible color camera, a visible monochrome camera, a SWIR camera, a MWIR cam-era, and a LWIR camera were utilized for this data collection.
Table 1. Summary of Sensor Resolutions for
UND Collection X1, WSRI Dataset, and NVESD Dataset
Visible MWIR LWIR UND X1 1200×1600 N/A 320×240 WSRI 1004×1004 640×512 N/A NVESD 659×494 640×480 640×480
Fig. 5. Sample visible and corresponding LWIR images of a subject from the UND X1 database with neutral expression and smiling expression.
For this work, data from the visible monochrome camera (Basler Scout sc640) and the two thermal cameras (DRS MWIR and DRS LWIR) were used in examining thermal-to-visible face recognition. The NVESD dataset examined two experimental conditions: physical exercise (fast walk) and subject-to-camera range (1 m, 2 m, and 4 m). A group of 25 subjects were imaged before and after exercise at each of the three ranges. Another group of 25 subjects did not undergo exercise, but were imaged at each of the three ranges. Each acquisition lasted 15 seconds at 30 frames per second for each camera, with all the sensors started and stopped almost simultaneously (subject to slight offsets because of human re-action time). To form a set of gallery and probe images for face recognition, a frame was extracted at the 1 second and 14 second marks for each video. Therefore, a set of 100 images per modality at each range was generated under the before/ without exercise condition from all 50 subjects, and a set of 50 images per modality at each range was generated under the after exercise condition from the 25 subjects who participated in exercise. Coordinates of four fiducial points (left eye, right eye, tip of nose, and center of mouth) were manually anno-tated and recorded for all visible, MWIR, and LWIR images. Because of the different sensor specifications, the resulting image resolutions vary across the modalities at each range. The resolution of the face images, in terms of average eye-to-eye pixel distance across the subjects, is tallied in Table2 for each of the three ranges and three modalities involved.
5. EXPERIMENTS AND RESULTS
To assess the cross-modal face recognition performance, a challenging evaluation protocol was designed. The proposed thermal-to-visible face recognition method was evaluated us-ing the three datasets described in Section4. In each of these datasets, there are multiple thermal and visible image pairs per subject. Although multiple visible images are available in the datasets for each subject, we used only two visible im-ages per subject to build the gallery in order to emulate the real-world situation, where biometric repositories are likely to contain only a few images for each person of interest. For the probe set, all available thermal images are used to assess the identification rate of the proposed thermal-to-visible face rec-ognition approach, which makes the evaluation protocol even more difficult as the thermal probe images are acquired under multiple experimental scenarios and conditions. The evalu-ation results are discussed in the following subsections. A. Results on UND Collection X1
As described in Section 4.A., 82 subjects from the UND X1 dataset were used for performance evaluation of the proposed thermal-to-visible face recognition method. The pool of sub-jects was divided into two equal subsets: visible and thermal images from 41 subjects (Partition A) were used to serve as
the gallery and the probe images, respectively. Thermal images from the remaining 41 subjects (Partition B) were used to provide thermal cross-examples for model building according to the procedure of Section3.C.1. All images were normalized to110×150pixels. Two visible images per subject from Partition A were used to build the gallery. These two vis-ible images were the first two visvis-ible images of every subject in Partition A, consisting of a neutral expression face image and a smiling expression face image. All thermal images (896 in total) from Partition A were used as probes to compute the Rank-1 identification rate.
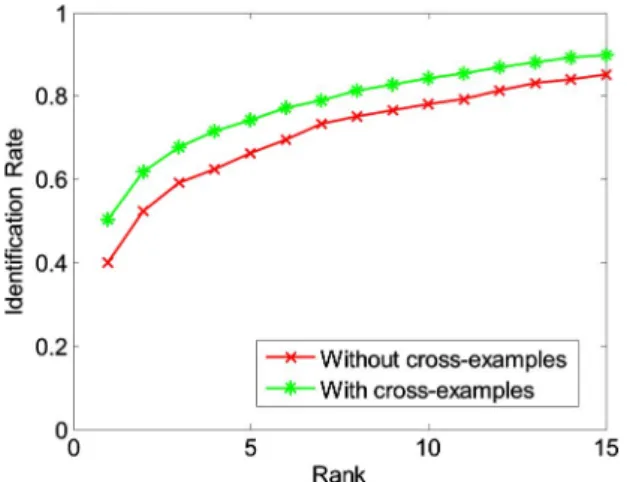
To determine the impact of the number of thermal cross-examples on cross-modal performance, we computed the Rank-1 identification rate for different number of thermal cross-examples–ranging from 0 to 82 (two thermal cross-examples from each of the 41 subjects in Partition B). As shown in Fig.6, a small number of thermal cross-examples improves the recognition rate substantially, from a Rank-1 identification rate of 0.404 with no cross-examples to 0.504 with 20 cross-examples. The curve in Fig.6saturates around 20 thermal cross-examples (two thermal images each from 10 subjects), which suggests that a large number of thermal cross-examples is not necessary and demonstrates that the proposed technique does not require a large corpus of training data. Figure 7 shows the cumulative match characteristics (CMC) curve, plotting the identification performance from Rank-1 to Rank-15, with and without 20 thermal cross-examples. It can be observed that thermal cross-examples consistently improve identification performance across all ranks.
The thermal-to-visible face recognition study by Bourlai
et al.[11] achieved a Rank-1 identification rate of 0.539 with a similar sized 39-subject gallery. The Rank-1 identification rate of 0.504 achieved in this work for the UND X1 dataset compares favorably, taking into consideration the difficulty of the gallery/probe protocol, the time-lapse condition for thermal probe images, and the substantially lower resolution of the LWIR camera that was used to acquire the UND X1 data-set. Note that Klare and Jain [12] achieved a Rank-1 identifi-cation rate of 0.467, but with a substantially larger gallery of 10,333 subjects.
If many visible images (i.e., many positive samples) for each subject are available in the gallery and used for PLS model
Fig. 6. Rank-1 identification rate as a function of the number of thermal cross-examples for the UND X1 dataset.
Table 2. Mean and Standard Deviation (in
Parentheses) of Eye-to-Eye Pixel Distance across Subjects for NVESD Dataset
1 m Range 2 m Range 3 m Range Visible 128.8 (13.9) 73.3 (5.8) 39.5 (2.9) MWIR 114.1 (11.2) 58.4 (4.1) 30.6 (2.3) LWIR 104.9 (9.9) 54.6 (5.6) 28.7 (2.1)
building, face performance can be expected to improve. Using many visible images per subject (average of 28 per subject for the UND X1 dataset), we were able to achieve a Rank-1 iden-tification rate of 0.727 for thermal-to-visible face recognition. Therefore, the availability of many visible images per subject in the gallery can improve cross-modal face recognition performance significantly (although it may be unrealistic for real-world applications). Under the most difficult protocol, in which there is only one visible image per subject for the gal-lery, the proposed approach is still able to achieve a Rank-1 identification rate of 0.463 for the UND X1 dataset.
B. Results on WSRI Dataset
As described in Section4.B., the WSRI dataset consists of 180 subjects, of which detailed multi-condition data were acquired for 61 subjects, while the remaining 119 subjects have three images per modality (visible and MWIR). Similar to the UND X1 database, the dataset was divided into a subset of 170 subjects (Partition A) for evaluation, and the remaining 10 subjects (Partition B) served to provide 20 thermal cross-examples (two per subject). Since results from the UND dataset showed that only a small number of thermal cross-examples are needed, we maximized the number of subjects in Partition A for evaluation. The gallery was constructed by utilizing two visible images per subject from the baseline condition in Partition A. All images in the WSRI dataset were normalized and cropped to390×470pixels in size. To assess the performance of our proposed method, two types of evalu-ation were conducted on the WSRI dataset: overall and condition-specific.
1. Overall Evaluation on WSRI Dataset
To provide an overall measure of the proposed thermal-to-visible face recognition performance, we used all thermal probe images (except those that were simultaneously ac-quired as the corresponding visible gallery images) for the first assessment. Therefore, the thermal probe set for the overall assessment consisted of one thermal image per subject from 119 subjects, and 708 thermal images from the 61 subjects with detailed multi-condition data, for a total of 827 thermal probe images. Using two visible images per subject for the gallery, the Rank-1 identification rate with and without thermal cross-examples are 0.815 and 0.767, respectively.
The resulting CMC curves are depicted in Fig. 8. Under the most difficult protocol of one visible image per subject for the gallery, the Rank-1 identification rate with and without thermal cross-examples are 0.746 and 0.706, respectively. 2. Condition-Specific Evaluation
As described in Section4.B., a subset (61 subjects from Par-tition A) of the WSRI dataset examined three experimental conditions: physical, mental, and time-lapse. In addition, a baseline acquisition was made for each subject. To conduct a detailed performance assessment of the proposed thermal-to-visible face recognition approach, thermal face imagery was divided into condition-specific probe sets. The baseline probe set consisted of the two thermal images corresponding to the two simultaneously acquired visible images of each subject used to construct the gallery. Table3tallies the number of subjects who participated in each condition, the total number of thermal probe images forming the probe set, and the corresponding Rank-1 identification rate. The Rank-1 identifi-cation rate results in Table 3 are obtained using the same 170-subject gallery with 20 thermal cross-examples as before for all conditions.
The baseline condition resulted in the highest Rank-1 iden-tification rate of 0.918, as it used thermal probe images that were simultaneously acquired as the visible gallery images (and thus containing the same facial pose and expression with a slight perspective difference because of sensor placement). Note that the thermal probe images for the exercise, mental, and time-lapse conditions were acquired in a different acquis-ition than the baseline visible gallery images, presenting a more challenging assessment. The exercise condition lowered the Rank-1 identification rate to 0.865, likely because of in-duced physiological changes manifested in the thermal imagery, and because of differences in face pose between the thermal probe and visible gallery images. The mental condition, which involved oral articulation of mental tasks, resulted in a Rank-1 identification rate of 0.800. The time-lapse condition resulted in the lowest Rank-1 identification rate of
Fig. 7. Cumulative match characteristics curves showing Rank-1 to Rank-15 performance for UND X1 dataset.
Fig. 8. Cumulative match characteristics curves showing Rank-1 to Rank-15 performance for the overall evaluation on the WSRI dataset.
Table 3. Number of Subjects Who Participated in
Each Condition, Total Number Of Thermal Images for Each Condition, and the Corresponding Rank-1
Identification Rate for WSRI Dataset
Baseline Exercise Mental Time-lapse Number of Subjects 170 49 49 12 Number of Images 340 244 225 153 Rank-1 ID Rate 0.918 0.865 0.800 0.634
0.634. However, the sample size for the time-lapse condition is the smallest (12 subjects).
C. Results on NVESD Dataset
As described in Section4.C., the NVESD dataset contains vis-ible, MWIR, and LWIR face imagery of 50 distinct subjects at three subject-to-camera ranges (1 m, 2 m, and 4 m). Figure9 shows the preprocessed MWIR and the corresponding LWIR images of a subject at the three ranges. All images were normalized and cropped to a fixed dimension of272×322 pix-els. The dataset was divided into a subset of 48 subjects (Par-tition A) for evaluation, with the remaining two subjects (Partition B) serving to provide thermal cross-examples. To construct the gallery, two visible images at the 1 m range from each of 48 subjects were used.
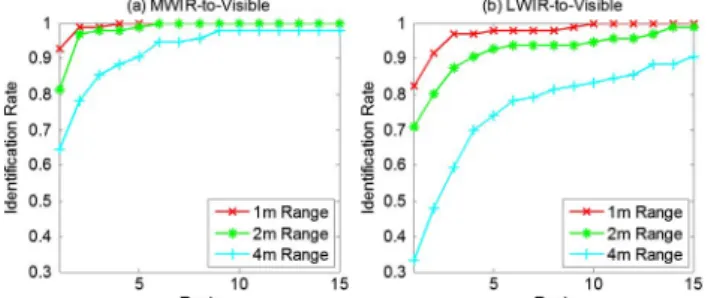
To assess the impact of range, six probe sets were con-structed using the before exercise MWIR and LWIR imagery from each of the three ranges. Each probe set contains 96 ther-mal images (two images per subject). The cumulative match characteristic curves are shown in Fig. 10, with the MWIR-to-visible face recognition results displayed in Fig.10(a) and the LWIR-to-visible results in Fig.10(b). The MWIR-to-visible Rank-1 identification rate is 0.927 at 1 m range, 0.813 at 2 m range, and 0.646 at 4 m range with thermal cross-examples. Without thermal cross-examples, the identification rate is significantly lower: 0.833 at 1 m, 0.740 at 2 m, and 0.552 at 4 m. For comparison, Bourlai et al. [11] reported a Rank-1 identification rate of 0.539 on their database for
MWIR-to-visible face recognition at a standoff distance of 6.5 feet (1.98 m).
The LWIR-to-visible Rank-1 identification rate of the pro-posed approach is 0.823 at 1 m range, 0.708 at 2 m range, and 0.333 at 4 m range with thermal cross-examples. Without thermal cross-examples, the identification rate is 0.771 at 1 m, 0.625 at 2 m, and 0.260 at 4 m. The identification rate associ-ated with LWIR probe imagery is consistently lower than that of MWIR probe imagery across all three ranges. The higher performance achieved with MWIR is expected, as MWIR sensors usually have higher temperature contrast than the competing LWIR sensors [30]. In addition, MWIR detectors typically have higher spatial resolution because of the smaller optical diffraction for the shorter MWIR wavelength [30]. The lower temperature contrast and spatial resolution of the LWIR sensor produce less detailed edge information, as illustrated by the preprocessed LWIR face images in Fig.9. Furthermore, edge information in the LWIR face images deteriorates far more rapidly than in MWIR as subject-to-camera range in-creases, which incur a more significant drop in LWIR-to-visible face recognition performance than for MWIR-to-LWIR-to-visible at 2 m and 4 m.
To assess the effect of exercise on cross-modal face recog-nition performance, we used the before-and-after-exercise data from the 25 subjects who participated in the exercise condition from Partition A. Six probe sets (before and after exercise × three ranges) were constructed using MWIR face imagery from the 25 subjects (50 images total, two images per subjects). Similarly, six probe sets were constructed using LWIR face imagery from the 25 subjects. The gallery set remained the same as before. Tables 4 and 5 show the Rank-1 identification rate at each range for MWIR-to-visible and LWIR-to-visible face recognition, respectively. The after-exercise probe imagery generally results in a slightly lower cross-modal face recognition performance for both MWIR and LWIR imageries.
D. Verification Performance on All Datasets
The previous subsections assessed the identification perfor-mance of the proposed algorithm on three datasets in the form of cumulative match characteristic curves, showing identifica-tion rate versus rank. This subsecidentifica-tion shows face verificaidentifica-tion
Fig. 9. Preprocessed MWIR and LWIR images at 1 m, 2 m, and 4 m ranges for a subject from the NVESD dataset. All images were resized to272×322for display.
Fig. 10. Cumulative match characteristics curve showing Rank-1 to Rank-15 performance at three ranges for (a) MWIR-to-visible face recognition, and (b) LWIR-to-visible face recognition for the NVESD dataset.
Table 4. MWIR-to-Visible Rank-1 Identification
Rate Using Before Exercise MWIR Probe Imagery and after Exercise MWIR Probe Imagery with
Thermal Cross-Examples for NVESD Dataset
1 m Range 2 m Range 4 m Range Before Exercise 0.920 0.700 0.580 After Exercise 0.880 0.680 0.480
Table 5. LWIR-to-Visible Rank-1 Identification
Rate Using before Exercise LWIR Probe Imagery and after Exercise LWIR Probe Imagery with Thermal
Cross-Examples for NVESD Dataset
1 m Range 2 m Range 4 m Range Before Exercise 0.700 0.640 0.300 After Exercise 0.640 0.620 0.280
(also referred to as authentication) results of the proposed technique in the form of receiver operating characteristic (ROC) curves. In verification/authentication, the objective is to determine whether the person in the probe image is the same as a person in gallery [31]. To compute the verification rate, the responses of a thermal probe image to every PLS model built from the gallery serve as similarity scores. At a given threshold, the verification rate and false alarm rate (FAR) are calculated by tallying the number of match scores and mismatch scores above the threshold, respectively. By varying this threshold across the range of similarity scores, an ROC curve can be constructed by plotting the verification rate against the false alarm rate. Figure11shows the verifica-tion performance of the proposed technique on the UND X1 dataset, the WSRI dataset, and both MWIR and LWIR subsets (1 m range, before exercise condition) of the NVESD data. Results were computed using thermal cross-examples for each dataset. When comparing performance across datasets, it is important to keep in mind that gallery sizes and sample sizes are different for each dataset. Typically, larger gallery sizes result in lower performance, as the number of classes and therefore potential confusers are larger. The gallery size (i.e., number of subjects/classes in gallery) is 41 for the UND X1 dataset, 170 for the WSRI dataset, and 48 subjects for the NVESD dataset. At FAR0.01, the cross-modal thermal-to-visible verification rate is 0.4364 for UND X1, 0.8742 for WSRI, 0.8021 for LWIR NVESD, and 0.9479 for MWIR NVESD.
6. DISCUSSION
This work sought to both present a robust PLS-based thermal-to-visible face recognition approach, as well as to assess the impact of various experimental conditions/factors on cross-modal face recognition performance by using multiple data-sets. The following subsections discuss and summarize the key findings of this work.
A. Impact of Thermal Cross-Examples
Incorporation of thermal cross-examples in the proposed approach improved thermal-to-visible identification perfor-mance significantly for all three datasets, which suggests that
the inclusion of thermal negative samples (chosen from a separate set of subjects excluded from the gallery) enhances the inter-class separability for cross-modal classification. Be-cause of the presence of multiple PLS models in the one-vs-all framework, direct visualization of this enhanced separability is difficult, and can only be observed indirectly by comparing the overall identification performance achieved with thermal cross-example and without thermal cross-examples.
To further investigate the mechanism by which thermal cross-examples affect PLS model building, we examine the changes in the weight matrixW fw1;w2;…;wpg in Eq. (5) by computing it with and without thermal cross-examples. Re-call thatwi’s are computed iteratively with a dimensionality of
m×1, wherepis the number of extracted latent vectors and
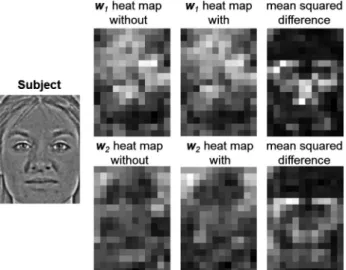
mis equal to the HOG feature vector dimensionality. The HOG feature vector is formed from concatenating overlapping blocks, each of which is a 36-dimensional vector of edge ori-entation histogram, covering a16×16pixel spatial area with an overlap of eight pixels for this work. Therefore, we also organize wis into 36-dimensional segments. Each segment has a spatial location corresponding to the respective HOG block for which the weights are applied in computing the la-tent vectorti. For each 36-dimensional segment, thel2-norm is calculated and repeated for all segments to form a heat map for visualization. Figure12shows the heat maps forw1andw2 for a given subject’s one-vs-all PLS model from the UND X1 dataset, without and with thermal cross-examples, while the mean squared difference is displayed at the rightmost column. The normalized image size for the UND X1 dataset is110×150 pixels, yielding12×17total HOG blocks. The resulting heat maps consist of 12×17 segments, for which the l2-norms are computed and displayed in Fig.12.
As can be observed in Fig.12, inclusion of thermal cross-examples during PLS model building alters the weights to be more concentrated around key fiducial points, such as around the eyes and nose, which are the regions that are most differ-entiable between subjects, instead of the forehead or the chin. Although the overall pattern is similar between the without heat map and the with heat map, the change in weights
Fig. 11. ROC curves showing thermal-to-visible verification perfor-mance for UND X1 dataset, WSRI dataset, and NVESD dataset (with separate curves for MWIR and LWIR).
Fig. 12. For the one-vs-all PLS model belonging to the subject shown at the left, the heat maps for the weight vectorsw1andw2are com-puted without and with thermal cross-examples. The mean square difference between the without and with weight vectors is displayed at the right column.
induced by thermal cross-examples does improve thermal-to-visible face recognition performance for all three datasets, implying that more discriminative classifiers are obtained. B. Comparison of Results across Datasets
The performance of the PLS-based thermal-to-visible face rec-ognition approach was evaluated on three datasets (UND X1, WSRI, and NVESD). The performance was lowest on the UND X1 dataset, which can be mainly attributed to the low image resolution and noisier characteristics of the Merlin uncooled LWIR camera. Recall that the UND X1 dataset was collected in the early 2000s. The performance of the proposed technique was more similar between the newer WSRI and NVESD data-sets, which were acquired with higher resolution thermal imagers. The identification performance in terms of Rank-1 identification rate was almost the same on the WSRI dataset (acquired with an MWIR sensor) and the MWIR subset of the NVESD data: 0.918 and 0.920, respectively. However, verifica-tion performance was lower on the WSRI dataset than on the MWIR NVESD data. As verification is more challenging than identification, the lower performance on the WSRI dataset may be partly due to its larger gallery size.
C. MWIR versus LWIR for Cross-Modal Recognition While both the MWIR and LWIR regions are part of the ther-mal infrared spectrum, the performance of therther-mal-to-visible face recognition does vary between the MWIR and LWIR spectra. As illustrated by the results on the NVESD dataset, using MWIR probe images resulted in a higher performance than using LWIR probe images with the same visible gallery setup, especially at longer ranges. The superior performance with MWIR can be attributed to the higher contrast and finer spatial resolution of MWIR sensors, as compared with their competing LWIR counterparts [30]. Although human facial skin tissue has a higher emissivity of 0.97 in the LWIR spec-trum than the emissivity of 0.91 in the MWIR specspec-trum [2], the advantage of higher emissivity in LWIR is offset by the lower contrast and spatial resolution of LWIR sensors. On the other hand, reflected solar radiation has been shown to exert more influence in the MWIR spectrum than in the LWIR spectrum [30]. Therefore, MWIR face images collected outdoors may exhibit higher variability because of illumination conditions during the day than LWIR. Outdoor data collections would need to be performed for further analysis.
D. Effect of Experimental Conditions
Using the three datasets, we examined three experimental conditions: time-lapse, physical exercise, and mental tasks. From the results on the UND X1 and WSRI datasets, the time-lapse condition produced the lowest performance. Time-lapse imagery is likely to contain multiple variations such as head pose, facial expression, lighting, and aging, and is there-fore the most challenging for thermal-to-visible face recogni-tion (and face recognirecogni-tion in general). The mental task condition resulted in the second lowest identification rate, as compared to the baseline case using the WSRI dataset. The decreased performance could be attributable to both changes in expression as the subjects articulated the mental tasks as well as to physiological changes because of mental stress. Studies have shown that mental stress induces increased blood flow in the periorbital and supraorbital regions of the
face, altering the regional thermal signature [32,33]. Further-more, changes in thermal signatures among different regions of the face are likely to be nonlinear, partly because of the distribution of facial perspiration pores. For example, the maxillary facial region contains a higher concentration of perspiration pores [34], and therefore can be expected to undergo more significant changes in its thermal signature with stress or arousal.
Of all the conditions evaluated in this work, physical exer-cise resulted in the smallest degradation in performance, showing similar accuracy to the baseline scenario in both the WSRI and NVESD datasets. Note that for both the WSRI and the NVESD databases, only light exercise was performed by the subjects (e.g., walking and slow jog), which did not induce noticeable perspiration among the majority of the subjects. Consequently, although the thermal facial signature did change because of the exercise, edges around key facial features were mostly preserved. To address the impact of ex-ercise on cross-modal face recognition further, instead of uti-lizing only light exercise, data collections should involve a range of exercise conditions from light to strenuous. Signifi-cant perspiration induced by strenuous exercise is expected to dramatically alter the thermal facial signature, because water is a strong absorber of thermal radiation and dominates IR measurements. Mitchellet al.showed that a layer of water only 10 microns in depth will be optically thick in the IR spec-trum [35]. Furthermore, the non-uniform distribution of pores in the face is expected to lead to significant nonlinear distor-tions of the thermal facial signature with strenuous exercise. Distance between subject and sensor is one of the most critical factors for cross-modal face recognition performance, which is also true for face recognition performance in general. The resolution of the face (commonly defined in terms of eye-to-eye pixel distance) acquired in an image is dependent on the distance of the subject to the sensor, as well as on the focal plane array resolution (FPA) and field of view (FOV) of the sensor. As the face resolution is reduced, facial details become increasingly coarse, rendering accurate face recogni-tion more difficult. Using the NVESD dataset, we observed that thermal-to-visible face recognition performance deterio-rates noticeable from 1 m to 4 m, especially for LWIR-to-vis-ible at 4 m with corresponding eye-to-eye distance of 29 pixels. For visible face recognition, Boomet al.observed that face recognition performance degraded significantly for face images of less than 32×32 pixels [36]. Fortunately, zoom lenses can extend the standoff distance of a sensor by acquir-ing images of sufficient face resolution for intelligence and military applications.
E. Challenges
Thermal-to-visible face recognition is a challenging problem, because of the wide modality gap between the thermal face signature and the visible face signature. Furthermore, utilizing thermal probes and visible galleries means that thermal-to-visible face recognition inherits the challenges in both thermal and visible spectra. Physiologic changes and opaqueness of eyeglasses are challenges specific to the thermal domain, while illumination is a challenge specific to the visible domain. Some challenges are common to both domains, such as pose, expression, and range. While the proposed thermal-to-visible face recognition technique has been demonstrated to be
robust to physiologic changes and expression, future work must address the challenges of pose, range, and presence of eyeglasses. For future work, the authors intend to pursue a local region-based approach to improve thermal-to-visible face recognition. Such an approach will enable different weighting between spatial regions and allow the variability of regional signatures to be accounted for during classifica-tion (e.g., the nose tends to be more variable in the thermal spectrum than the ocular region). A local region-based approach will also be more robust to facial expressions and eyeglasses, as well as pose.
7. CONCLUSION
We proposed an effective thermal-to-visible face recognition approach that reduces the wide modality gap through prepro-cessing, extracts edge-based features common to both modal-ities, and incorporates thermal information into the PLS-based model building procedure using thermal cross-examples. Evaluation of the proposed algorithm on three extensive data-sets yields several findings. First, thermal-to-visible face rec-ognition has a higher performance in the MWIR spectrum than in the LWIR, likely because of inherently better spatial reso-lution with the shorter wavelength MWIR radiation. Second, light exercises are not likely to alter the thermal facial signa-ture enough to dramatically affect cross-modal face recogni-tion performance. However, intense and prolonged exercise that induces significant perspiration will likely degrade recog-nition performance. Specific data collections are needed for a more rigorous assessment of the effect of exercise on thermal-to-visible face recognition. Last, achieving consistent face recognition performance across extended distances is chal-lenging, requiring the development of new resolution-robust features and classification techniques. Solving these chal-lenges will enable thermal-to-visible face recognition to be a robust capability for nighttime intelligence gathering.
ACKNOWLEDGMENTS
The authors would like to thank the sponsors of this project for their guidance, Dr. Julie Skipper for sharing the WSRI data-set, and Dr. Kenneth Byrd for the NVESD dataset collection effort. W. R. Schwartz would like to thank the Brazilian National Research Council–CNPq (Grant #477457/2013-4) and the Minas Gerais Research Foundation–FAPEMIG (Grant APQ-01806-13).
REFERENCES
1. S. G. Kong, J. Heo, B. R. Abidi, J. Paik, and M. A. Abidi,“Recent advances in visual and infrared face recognition–a review,” Comput. Vis. Image Und.97, 103–135 (2005).
2. L. B. Wolff, D. A. Socolinsky, and C. K. Eveland,“Face recogni-tion in the thermal infrared,”inComputer Vision Beyond the Visible Spectrum(Springer, 2005), pp. 167–191.
3. D. Yi, R. Liu, R. F. Chu, Z. Lei, and S. Z. Li,“Face matching between near infrared and visible light images,”inAdvances in Biometrics: Lecture Notes in Computer Science(Springer, 2007), Vol.4642, pp. 523–530.
4. B. Klare and A. K. Jain, “Heterogeneous face recognition: matching NIR to visible light images,”inProc. International Conference on Pattern Recognition (IEEE, 2010), pp. 1513– 1516.
5. T. Bourlai, N. Kalka, A. Ross, B. Cukic, and L. Hornak,“ Cross-spectral face verification in the short wave infrared (SWIR) band,”inProc. International Conference on Pattern Recogni-tion(IEEE, 2010), pp. 1343–1347.
6. F. Nicolo and N. A. Schmid,“Long range cross-spectral face rec-ognition: matching SWIR against visible light images,”IEEE Trans. Inf. Forensics Security7, 1717–1726, 2012.
7. D. A. Socolinsky and A. Selinger,“A comparative analysis of face recognition performance with visible and thermal infrared imagery,”inProc. International Conference on Pattern Recog-nition(IEEE, 2002).
8. P. Buddharaju, I. T. Pavlidis, P. Tsiamyrtzis, and M. Bazakos,
“Physiology-based face recognition in the thermal infrared spec-trum,”IEEE Trans. Pattern Anal. Mach. Intell.29, 613–626, 2007. 9. S. G. Kong, J. Heo, F. Boughorbel, Y. Zheng, B. R. Abidi, A. Koschan, M. Yi, and M. A. Abidi, “Adaptive fusion of visual and thermal IR images for illumination-invariant face recogni-tion,”Int. J. Comput. Vision71, 215–233, 2007.
10. J. Choi, S. Hu, S. S. Young, and L. S. Davis,“Thermal to visible face recognition,”Proc. SPIE8371, 83711L, 2012.
11. T. Bourlai, A. Ross, C. Chen, and L. Hornak,“A study on using mid-wave infrared images for face recognition,” Proc. SPIE
8371, 83711K, 2012.
12. B. F. Klare and A. K. Jain,“Heterogeneous face recognition us-ing kernel prototype similarity,” IEEE Trans. Pattern Anal. Mach. Intell.35, 1410–1422, 2013.
13. X. Tan and B. Triggs,“Enhanced local texture feature sets for face recognition under difficult lighting conditions,” IEEE Trans. Image Process.19, 374–383, 2010.
14. N. Dalal and B. Triggs,“Histogram of oriented gradients for human detection,” in Proc. IEEE Conference on Computer Vision and Pattern Recognition(IEEE, 2005), pp. 886–893. 15. D. G. Lowe,“Object recognition from local scale-invariant
fea-tures,”inProc. International Conference on Computer Vision
(IEEE, 1999), pp. 1150–1157.
16. O. Deniz, G. Bueno, J. Salido, and F. De La Torre,“Face recog-nition using histogram of oriented gradients,”Pattern Recogn. Lett.32, 1598–1603, 2011.
17. H. Wold, “Estimation of principal components and related models by iterative least squares,”in Multivariate Analysis
(Academic, 1966).
18. W. R. Schwartz, A. Kembhavi, D. Harwood, and L. S. Davis,
“Human detection using partial least squares analysis,”inProc. IEEE International Conference on Computer Vision (IEEE, 2009), pp. 24–31.
19. A. Kembhavi, D. Harwood, and L. S. Davis,“Vehicle detection using partial least squares,”IEEE Trans. Pattern Anal. Mach. Intell.33, 1250–1265, 2011.
20. A. Sharma and D. Jacobs,“Bypassing synthesis: PLS for face rec-ognition with pose, low-resolution and sketch,”inProc. IEEE Conference on Computer Vision and Pattern Recognition
(IEEE, 2011), pp. 593–600.
21. W. R. Schwartz, H. Guo, J. Choi, and L. S. Davis,“Face identi-fication using large feature sets,”IEEE Trans. Image Process.
21, 2245–2255, 2012.
22. I. Helland,“Partial least squares regression,”inEncyclopedia of Statistical Sciences(Wiley, 2006), pp. 5957–5962.
23. H. Abdi, “Partial least squares regression and projection on latent structure regression (PLS Regression),”Wiley Interdisci-plinary Reviews: Computational Statistics2, 433–459 (2010). 24. R. Manne,“Analysis of two partial-least-squares algorithms for
multivariate calibration,”Chemometr. Intell. Lab. 2, 187–197, 1987.
25. M. Barker and W. Rayens,“Partial least squares for discrimina-tion,”J. Chemometrics17, 166–173, 2003.
26. P. J. Flynn, K. W. Bowyer, and P. J. Phillips,“Assessment of time dependency in face recognition: An initial study,”Audio and Video-Based Biometric Person Authentication3, 44–51 (2003). 27. X. Chen, P. J. Flynn, and K. W. Bowyer,“Visible-light and Infra-red Face Recognition,”inProc. ACM Workshop on Multimodal User Authentication(ACM, 2003), pp. 48–55.
28. X. Chen, P. J. Flynn, and K. W. Bowyer,“IR and visible light face recognition,”Comput. Vis. Image Und.99, 332–358, 2005. 29. K. A. Byrd,“Preview of the newly acquired NVESD-ARL
multi-modal face database,”Proc. SPIE8734, 8734-34, 2013. 30. L. J. Kozlowski and W. F. Kosonocky,“Infrared detector arrays,”
in Handbook of Optics Volume II: Design, Fabrication and Testing, Sources and Detectors, Radiometry and Photometry, 3rd Ed. (Optical Society of America, 2009).
31. S. A. Rizvi, J. P. Phillips, and H. Moon,“The FERET verification testing protocol for face recognition algorithms,”inNIST IR 6281, National Institute of Standards and Technology(NIST, 1998).
32. J. Levine, I. Pavlidis, and M. Cooper,“The face of fear,”Lancet
357, 1757 (2001).
33. C. Puri, L. Olson, I. Pavlidis, and J. Starren,“Stresscam: non-contact measurement of users’emotional states through ther-mal imaging,”inProc. 2005 ACM Conference on Human Factors in Computing Systems (CHI)(ACM, 2005), pp. 1725–1728.
34. D. Shastri, A. Merla, P. Tsiamyrtzis, and I. Pavlidis,“Imaging facial signs of neurophysiological responses,” IEEE Trans. Biomed. Eng.56, 477–484, 2009.
35. H. J. Mitchell and C. Salvaggio,“The MWIR and LWIR Spectral Signatures of Water and Associated Materials,” Proc. SPIE
5093, 195–205, 2003.
36. B. J. Boom, G. M. Beumer, L. J. Spreeuwers, and N. J. Veldhuis,
“The effect of image resolution on the performance of face recognition system,”inProc. 7th Int. Conference on Control, Automation, Robotics, and Vision(IEEE, 2006).