ci.Ps -22 P4
POLICY RESEARCH WORKING
PAPER
228 6
Transparency, Liberalization
Lack of transparency increasesthe probability of a banking
and Banking Crises
crisis following financialliberalization. In a country
Gil Mehrez where government policy is
not transparent, banks may tend to increase credit above the optimal level.
The World Bank
World Bank Institute
U
Public Disclosure Authorized
Public Disclosure Authorized
Public Disclosure Authorized
I
POLICY RESEARCH WORKING PAPER 2286Summary findings
Mehrez and Kaufmann investigate how transparency The empirical evidence, based on data for 56 countries
affects the probability of a financial crisis. in 1977-97, supports this theoretical model. The authors
They construct a model in which banks cannot find that lack of transparenicy increases the probability of
distinguish between aggregate shocks and government a crisis following financial liberalization. This implies
policy, on the one hand, and firms' quality, on the other. that countries should focus on increasing transparency of
Banks may therefore overestimate firms' returns and economic activity and government policy, as well as
increase credit above the level that would be optimal increasing transparency in the financial sector,
given the firms' returns. particularly during a period of transition such as financial
Once banks discover their large exposure, they are liberalization.
likely to roll over loans rather than declare their losses. This delays the crisis but increases its magnitude.
This paper - a product of Governance, Regulation, and Finance, World Bank Institute - is part of a larger effort in the
institute to research governance and transparency and apply the findings in learning and operational programs. (For details, visit www.worldbank.org/wbi/gac.) Copies of the paper are available free from :he World Bank, 1818 H Street, NW, Washington, DC 20433. Please contact Diane Bouvet, room J3-273, telephone 2C2-473-5818, fax 202-334-8350, email address dbouvetrworldbank.org. Policy Research Working Papers are also posted on the Web at www.worldbank.org/ research/workingpapers. The authors may be contacted at [email protected] or [email protected]. February 2000. (33 pages)
The Policy Research Working Paper Series disseminates the findings of work in progress to encourage the exchange of ideas abouit development issues. An objective of the series is to get the findings out quickly, even if the presentations are less than fully polished. The papers carry the names of the authors and should be cited accordingly. The findings, interpretations, anzd conclusions expressed in this
Transparency, Liberalization and Banking
Crises-Gil Mehrez
Georgetown University
Daniel Kaufmann The World Bank
JEL Classification Codes: D83, G14
Keywords: Financial liberalization, transparency, banking crisis
+ We gratefully thank Akiko Terada for excellent research assistantship. We also thank Sergio Schnukler, Tara Vishwanath, Mr. Taylor and Mr. Wmell for comments and suggestions. The findings, interpretations, and conclusions expressed in this paper are entirely those of the authors and do not necessarily represent the view of the World Bank, its Executive Directors, or the countries they represent. Contact address: The World Bank, NW, Washington, DC 20433. E-mail address contact: gmehrez @worldbank.org
1. Introduction
The importance of transparency of economic activity and policy has sprung to the for front of economic research following the recent financial and banking crises in Mexico, South East Asia and Russia. Evidence from other countries that have experienced long period of poor transparency and low growth rate suggest that poor transparency may have adverse affect on long term growth as well.'
Most economic models emphasized the effect of transparency at the micro level on firms' behavior, and at the macro level on agents response to unobserved monetary or fiscal policy. At the micro level for example, Myers and Majluf (1984) argue that managers will borrow rather than issue equity when they have private information about the firm's profit. At the macro level, recent attentions have been paid to the relationship between international common lenders behavior and poor transparency. For example, Calvo (1999), Calvo and Mendoza (1999), and Kodres and Pritsker (1998) show that costly information about
international investments can produce herding and contagion effects. Zeira (1999) shows that poor transparency may lead to "informational overshooting" in the stock market. Honohan (1999) presents an argument for bank contagion based on informational externalities in a simple oligopoly model of bank lending. In his model liberalization increases the probability of a crisis since it induce banks to shift to riskier mix of loans. The reason is that as new banks enter unexpectedly, old banks are left with excess capacity that they lend at a higher risk, i.e., the value of the deposit-put increases.
This paper analyses how lack of transparency combined with new and deregulated financial markets may lead to unsustainable investment, and large exposures and vulnerability
of financial institutions. The reason for this outcome is the process by which new financial markets acquire information on borrowers. Initially, when financial markets are deregulated,
banks have very limited information on specific borrowers. In addition, even if banks have the necessary informnation they might not have the skills to use it efficiently. Thus, banks lend small amounts to many borrowers (i.e., credit rationing occurs as in Stiglitz and Weiss (1981)). As a result, investment is low and inefficient, projects with high productivity get the same amount of credit as projects with low productivity. As time passes, information on specific projects (borrowers) is revealed and banks update their credit accordingly. They increase credit to projects with high productivity and decrease credit to projects with low productivity. If the economy is transparent (i.e., there is no uncertainty regarding the true outcome of the projects) the learning process is fast and efficient in the sense that the new information is transparent and certain, the banking system is solid. If, on the other hand, transparency is poor in the sense that the new information is non-transparent and uncertain, the learning process may lead to inefficient and unsustainable allocation of credit. Even though banks adjust their belief rationally, updating their belief based on their priors and the new information, a series of temporary shocks or non-transparent expansionary policy would increase banks' exposure and vulnerability.
The analysis has several policy and empirical implications. The main policy
implications are as following. First, a more transparent macro economic data and government policy, such as an increase in the transparency of fiscal, monetary and trade, would decrease the probability of a financial crisis, especially following financial liberalization. Second, policy makers should be very alert about credit expansions (and banks' behavior) during periods of high economic activity, especially if they posses bad information not available to
the public. Third, financial crises can occur regardless of financial liberalization, but financial liberalization combined with poor transparency increases the probability of a crisis. This does
not imply that countries should not liberalize their financial system or that financial liberalization always results in a crisis. It implies only that countries that liberalize their financial sector should make every effort to increase transparency. Fourth, if financial institutions become vulnerable, it is very likely that they will rollover bad loans and hence their condition is likely to deteriorate farther rather than improve. The reason is that by rolling bad loans over banks do not have to reduce the book value of their capital and consequently
other loans. Thus, delaying adjustments (e.g., bail out, closing down banks) may be costly in the sense that it is likely to increase the magnitude of the crises.
In order to test whether indeed financial liberalization combined with poor transparency increases the probability of a banking crisis - we construct a data set of 56 countries from 1977 to 1997. The empirical results suggest that financial liberalization increases the probability of a crisis during the five years following the liberalization. We further find that the probability of a crisis following liberalization is higher in countries with poor transparency than in countries that are transparent.
This paper is constructed as following. In the next section we present a dynamic model of credit and investment and discuses the role of transparency. Section 3 discusses how
financial liberalization with poor transparency may lead to financial crisis and discusses some policy implications. Section 4 presents empirical evidence in support of the model. Section 5
2. A Simple Model of Investment with Poor Transparency
Suppose an economy with many heterogeneous projects (firms). Each project yields different returns for the same level of investment. The return of each project increases with the level of investment but at a decreasing rate i.e., marginal productivity is positive and decreasing. There is a free entry to each project. If there is more than one investor in a given project, then investors receive the average return of the project. Specifically, assume that there
is a continuum of projects, distributed uniformly along the unit interval. Let R;, be the return
of project j. R;, depends on three elements - a project specific quality (productivity) 9;, the
level of investment in the project, Ij, and an aggregate shock, V, that affects all projects in
the economy. V represents a productivity shock, government's policy (fiscal, monetary, trade), and so on.
wt;(O,Ij ,V) .1
-R>0 aR0 a-> < AR >0
89 ai 829 aV
The discussion above describes investment opportunities in the economy, i.e., the demand for credit. In the next section, we discuss the supply of funds to investors.
2.1 Financial Institutions
The supply of funds to projects is provided by financial institutions that operate in a perfect competition environment taking the interest rate for deposits and the interest rate for borrowers (investors) as given. Financial institutions have reserve requirements. Each
first describe the equilibrium in an economy with complete information and then discuss the dynamics in an economy with incomplete information, i.e., poor transparency.
In an economy with complete information, the profits of a financial institution from lending an amount I to firm j are
I(r - r), -(2)
where r is the interest rate which financial institutions charge borrowers, and rs is the interest rate they pay depositors (both are given to the banks). Let the equity (reserve) deposits ratio be 8. Thus, the required equity (reserve) is 81, and the returns for financial intermediaries from a loan of I are
I(r -r') (r -r') 3
In words, the returns from lending I are equal to the interest rate spread divided by the required equity (reserves) ratio.
Tlhe level of investment in each project is determined by the project's specific productivity. Each project is financed until its returns are equal to r
R,(9;,1 1,Y) (4)
Thus, the level of investment in each project depends on the project specific productivity, 9;,
the state of the aggregate economy, V, and the interest rate, r. Assuming that the function R* is invertible and separable, equation (4) can be solved to yield the level of investment in each project as a function of the project specific productivity, the aggregate shock, and the interest
rate. 2
2
Ii = g(Oj;, V, r) . (5)
Finally, aggregate investment can be derived by aggregating over all projects in the economy,
I = J(Ij (o;,V,r)4(j) (6)
0
Before we proceed a comment is in place. The model above makes the simplifying assumption that the interest rates are given rather than detenmined endogenously in the model. This assumption allows us to focus our attention on the role of transparency in a simple framework. Specifically, to discuss the effect of poor transparency on the dynamic of credit and the vulnerability of the financial sector. The model, however, can be extended to a general equilibrium framework by specifying the supply of funds by depositors as a function of the deposit's interest rate and the probability of a failure. In this case, the deposit interest rate, the interest rate for loans and the amount of credit are determined by the market clearing conditions: Deposits is equal to credit and banks' profits are equal to zero. Alternatively one can view the interest rate as the world interest rate which are given to a small open economy with government guarantees.
2.2 Lack of Transparency
Consider an economy where financial institutions have limited information about specific projects. Assume that the financial system has been liberalized or deregulated and financial institutions cannot distinguish between projects. The only information that is
available is that projects' quality (returns),
o;,
are drawn from a normal distribution withunknown mean ,u and variance of 1.
Even though the mean of the distribution, ji, is unknown, financial institution have prior belief
(knowledge) that u is drawn from a normal distribution with mean a and variance 0.2.
,u -N(a,ca')
The initial priors may be unbiased in the sense that g=ac or may be biased if g#•a. Every period new information becomes available (in a way describe below) and the priors are
updated using bayse rule.
The aggregate shock or policy, V each period is drawn from a normal distribution with
zero mean and variance a' .
Vt
-N(O, o'). (8)Further more, the realization of V by itself is never observed.
At the end of each period, the return of each project is observed. The returns, however, are a combination of the project's quality and the aggregate shock (or policy), V. Since V by itself is unobserved, it is impossible to learn the quality of each project with certainty. The new information, however, is valuable. Below we describe how the new information is used to update the priors.
2.3 Initial Period
In the initial period, given their information set, financial institutions can not distinguish between projects. Thus, they treat every projects as if it is a random draw from a normal
distribution with mean a and variance of ao-(ov2, a,2 1). Thus, they lend to all projects the
financial institutions are risk neutral and require a return of rF. The amount of credit,
therefore, is determined such that expected return from lending is equal to rF, where
r
(1 + r) prob(Rj (I) > r) + J(l + Rj (I)) prob(Rj (I) < r)dj - (1 + rs)
rF = -I (9)
The first term is the return when the loan is repaid, that is, the probability that projects' returns are greater than r, times the interest rate. The second termn is the returns from projects with returns below r, that is the probability of given returns times the return integrated over all projects with returns below r. The third term is the interest rate paid to depositors. Equation
(9) can be solved to yield the level of investment as a function of r, r ,rS and the prior belief
about the return's distribution, a and 0C2
Ii = T(r, rFrs ,a ,2 ). (10)
The allocation of credit is inefficient. All projects receive the same amount of credit regardless of the productivity. Projects with low productivity receive too much credit while projects with high productivity receive too little credit.
2.4 Proceeding periods
At the end of each period, the returns from each project are realized. Banks observe Rj (O;, Ij ,V) but not 9,; or V separately. In other words, banks can not distinguish between the case where projects have high productivity and the economy had a bad shock (cc is high and V is negative) and the case where projects have low productivity and the economy had a positive shock (ax is low and V is positive).
The dynamics of investment (credit) depends on the updating of the information which in turns depend on the priors and the realizations of V. For simplicity, assume that banks observe 0' + V (e.g., the function R is linear in 9. and V). At the initial period, the prior belief is that u - N(a, o2 ). At the end of the period, the observed returns have a mean equal
to 7 + V where 9 = 6j . Therefore, the new information about pt is
UN -N(9,cr ) (11)
Furthermore, banks observe the firm's location relative to other firms. Thus, one can use bayesian inference to update the priors using the new information to forms new belief about project j productivity (return),
* -N(0J +a N ) (12) where a 9 2 2 N a W2 2 a V and 2 1 2 a. ay
If the priors are very uncertain, i.e., a2 is large, then the posterior belief depends mainly on the new information. On the other hand, if the priors are certain, i.e., a, = 0, then the new information allows us to distinguish between the firms but the belief about the mean
At the beginning of the next period credit is allocated according to the new priors and the situation repeats itself. At the end of the period 9= =, - V is observed and the priors are
updated. Specifically, the priors are that
P-N(aN,aN )
and the new information is that
'UN -N(O, ' ) .
Thus, the priors are updated using the bayesian rule above and the situation then repeats itself (given the new priors, lending decisions are made. At the end of the period, a = u - V is
observed and the priors are updated accordingly).
Finally, one can calculate the dynamics of investment from the evolution of beliefs. Credit to project j is such that the expected return of the financial institution from investing in project j is equal to r
(I +r) prob(Rj (I) 2r) + Jf(I + Rj (I)) porb(Rj (I) < r)dj- (I + r s
r = . (13)
Equation (13) yields the level of investment in each project as a function of r, rF, rS 9 ,
and the information set,
I =g(r,r vrs, O8r j 0 ,.av
)
(14)Aggregate investment then could be calculated simply by aggregating (14) over all projects.
In this section we discuss two issues. First, we describe how a country can become exposed and vulnerable when financial institutions follow a rational policy as described above. Second, we describe the conditions under which banks would choose to rollover loans to unprofitable projects, and hence delay the adjustment and increase the probability and magnitude of a crisis.
Consider an economy with very uncertain priors that has experienced a success of positive aggregate shocks or expansionary government policy (notice that these shocks do not necessarily have to increase over time). As a result, financial institutions have updated their prior upward above the real productivity of each project. Note that it does not require the priors to be incorrect. It only requires some level of uncertainty. In economies with certain
priors, a z 0, the updating process is very slow and hence the financial system is very
unlikely to get exposed. On the other hand, in economies with uncertain priors, large ca , the
adjustment is fast, and hence the financial system is more likely to become vulnerable. Consider now the banks' response when they realize that firms' productivity is below their expectation (suppose due to a negative realization of V). The response depends on the extent of the losses, on future expectations, and on the financial regulations (e.g., the required equity ratio or the ability to hide bad loans). Banks can either declare the losses and adjust the lending according to the new information, or role the loans over and hide the losses. On the one hand, if a bank declare its losses, it can adjust its lending according to the new
information. On the other hand, if the banks roles its loans over, it does not have to decrease its equity, but it can not adjust its loans efficiently according to the new information.
c = |((l + (Rj(Ij / priors) I V) - (l + rs))Ijd(j) (15)
The first term represents the returns over all projects. The returns are a function of the
realization, V, and the lending amount to each project. The second term is the interest paid to depositors.
For simplicity suppose that banks can either declare all the losses, c, or role over all its loans. Bank will choose to role over all the loans if
r
((I + r) prob(Rj(I.j-l) > r / new inf.) + J(1 + Rj(I; -1) < r) porb(Rj(Ij,) / new inf.)dj - (1 + rs) I
r, < - I_
a -c
(16) In words, if a bank declares its losses and adjusts its loans, its new equity is 51 - c and the
expected return is r F (bI - c) . On the other hand, if the banks role the loan over its returns are
given in the nominator. If the gains from rolling the loans over amd "having" higher equity are greater than the losses from not adjusting the credit, the bank will role the loans over. Note, however, that given the updating process, banks are likely overestimating the firms' quality and hence are more exposed than they estimate. Hence, delaying the adjustment may increase the banks' losses and vulnerability.
4. Empirical and Policy Implications Policy Implications
The theoretical analysis has several policy and empirical implications. The main policy implications are as following. First, an increase in transparency decreases the probability of a
banking crisis. Better transparency decreases the probability of banks confusing transitory shock or expansionary government policy with firms' productivity and hence decreases the probability of a crisis. Second, one should be very alert to the conditions of the banking sector
following liberalization and an expansionary period, especially if it (e.g., the government) possesses information not available to the public. Third, if financial institutions become vulnerable, it is very likely that the situation will deteriorate rather than improve. In other words, even if bank equity is large enough such that there is no moral hazard problem,
financial institutions may still decide to role loans to bad projects. Moreover, banks may underestimate their vulnerability. Thus, delaying the financial adjustment (e.g., declaring losses and adjusting the loans) may be very costly in the sense that it will increase the probability and magnitude of a crisis.
Empirical Implications
The analysis has several econometrics implications that we test in the following section. The model implies that poor transparency by itself does not increase the probability of a
crisis. However, poor transparency, combined with uncertain priors (such as in new
deregulated financial markets) increases the probability of a crisis. That is to say that the fact that some countries with poor transparency have not experienced a crisis while other with
better transparency have does not imply that poor transparency has no effect on the
probability of a crisis. Our econometric investigation therefore has two parts. First, we test whether the probability of a crisis increases after financial liberalization takes place. Second, we test whether the probability of a crisis depends on the combination of financial
4.1. Data and Estimation
There are several empirical studies that estimate the causes of financial crises using macro and financial variables. Kaminsky and Reinhart (1998) investigate a data set of 20 countries between 1970 and mid 1995 and show that the increase in growth domestic credit two years ago, which they argue is a proxy for financial liberalization, can help explain banking crises. Caprio (1999) argues that "premature liberalization could be cited in virtually all cases" of financial crises. Demirguc Kunt and Deteragiache (1 998b) estimate the
probability of a banking crisis using a data set of 53 countries between 1980 and 1995. They identify several macro, financial, and institutional variables that explain the probability of a crisis. They argue that the banking crises are more likely to occur in liberalized financial
system. While these findings are consistent with our model, the model's predictions are more settled. The model's two econometric predictions are as following. First, banking crises are more likely to occur in the period following financial liberalization, and not in any liberalized
financial system as argued by Demirguc Kunt and Deteragiache (controlling for the fact that by definition banking crisis cannot occur in countries without financial system). The reason is that in established financial system the priors are very certain and hence the adjustment is very slow while in recently liberalized financial system the priors are very uncertain and hence the adjustment is very fast. The second prediction is that the probability of a financial crisis is higher in the period following liberalization in countries with poor transparency. The reason is that poor transparency increases the probability of confusing firms' quality on the one hand with aggregate shock and non-transparent policy on the other hand.
In order to test these predictions we constructed a data set of 56 countries between 1977 and 1997. In addition to financial liberalization and transparency variables, which we describe below, the data set includes macroeconomic and financial variables that are identified by
Demirguc Kunt and Deteragiache (1998b) as increasing the probability of a financial crisis. The macroeconomic variables are: GDP growth rate, inflation rate, change in terms of trade, real interest rate, and exchange rate depreciation rate. The financial variables are: M2 to gross international reserve ratio, claims on private sector as percent of GDP, bank liquid reserves to bank assets ratio and real credit growth two years ago. The source of the data is the
International Financial Statistics and the World Bank GDF & WDI.
Data on financial liberalization episodes are based mainly on Williamson and Mahar (1998), Lindgren, Garcia, and Saal (1996), and Drees and Pazarbasioglu (1998). Williamson and Mahar survey 51 financial liberalization episodes in 28 countries between 1977 and 1994, Lindgren, Garcia, and Saal survey 6 financial liberalization episodes in 3 countries, and Drees and Pazarbasioglu survey 4 financial liberalization episodes in 2 countries between 1986 and 1992. Data on banking crises are constructed based on the data and description in Lindgren, Garcia, and Saal (1996) and Demirguc-Kunt and Detragiache (1998)3. Since the crises may affect the macroeconomic variables, we delete the five years following the crises. If the crisis lasts longer than five years, we drop the observations while the crisis lasts.4
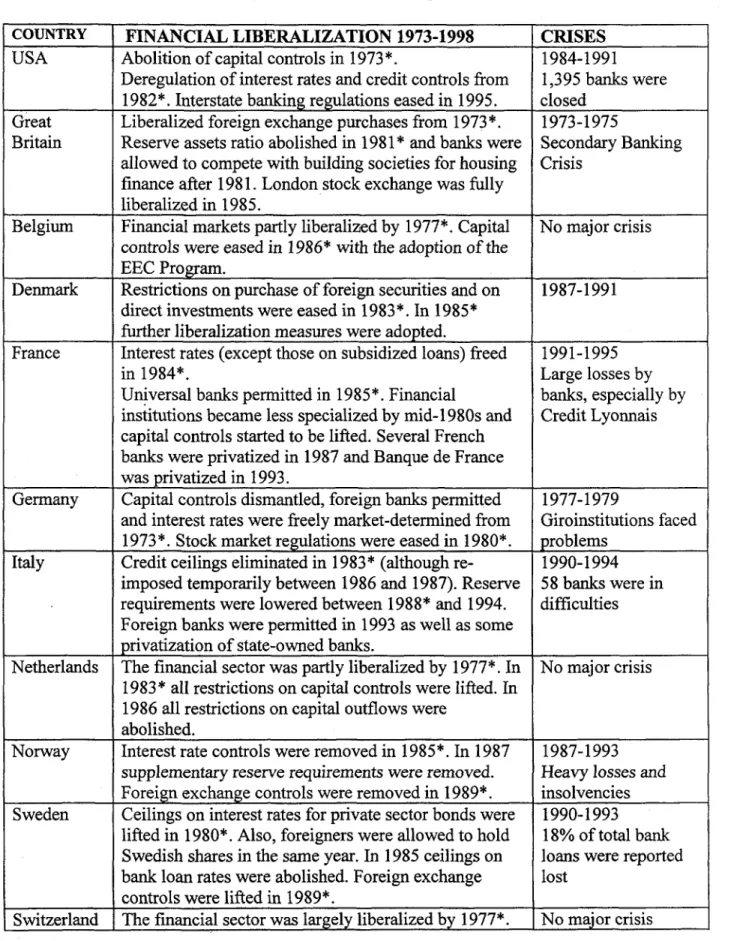
Table 1 presents the countries in our sample, the periods and types of financial liberalization, and the periods of banking crises. The financial liberalization varies in their scope and magnitude. Some liberalization episodes were a move from very control financial
3We drop three countries, Guyana, Papua New Guinea, and Zaire in our regression estimations because of lack
of macro/financial data. Therefore, there are 89 financial liberalization and 57 banking crises from 56 countries in the final sample.
sector to a partial liberalized financial sector, while some were a slhift from partial
liberalization to full liberalized financial sector. Some financial liberalization were taken at a very slow rate while others were taken at very rapid rate. Due to the data limitations we do not distinguish between the degree of liberalization, and consider all liberalization episodes the same.5
Table 2 presents some descriptive statistics about liberalization and banking crises. There are 92 episodes of liberalization in our sample and 60 episodes of banking crises. 36 out of the 60 (60 percent) crises were preceded by liberalization in the previous 5 years. 15 crises occurred before liberalization and 9 occurred more than 5 years after stabilization. Out of the 92 episodes of financial liberalization, 40 (44 percent) were followed by banking crisis in the next 5 years. Figure 1 presents the distribution of the duration between crises and
liberalization for those crises that were preceded by liberalization. Out of 36 crises that occurred in the 5 years following liberalization, 13 occurred 2 years after liberalization, 9 crises occurred 3 years after liberalization, and 5 crises occurred 4 years after stabilization.
4.2. Estimation results
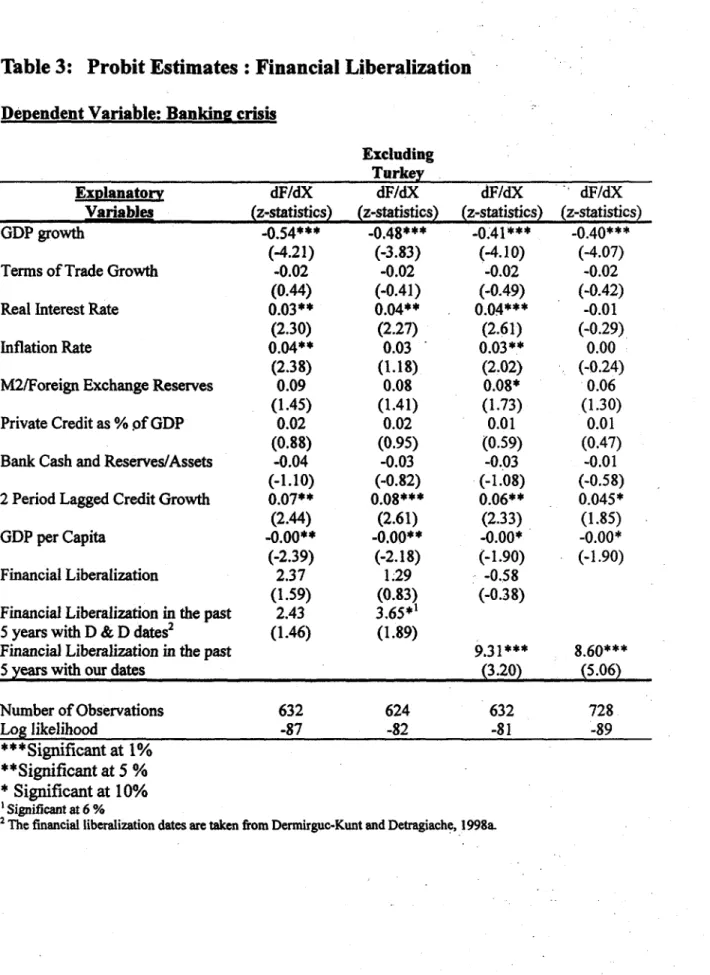
Our first goal is to test whether banking crises are more likely to occur in the period following liberalization. In order to relate our finding to the existing empirical findings and as a robustness check, we first present the results from a probit estimation based on the same countries and definition of financial liberalization and crises as Demirguc-Kunt and
Detragiache (1998b). The only additional variable is a dummy variable that takes the value of
5 The results, however, are robust to distinguishing between a move from controlled economy to partial liberalization and a move from partial liberalization to fall liberalization
1 if financial liberalization had occurred in the previous 5 years and 0 otherwise.6 To ease interpretations, we report the effects of one-unit changes in the dependent variables on the probability of a crisis (expressed in percentage points) evaluated at the mean value of the data. We also report the associated z-statistics that test the null hypothesis of no effect.
The first column in table 3 presents results of a probit model where the dependent variable takes the value of 1 during years with a financial crises and 0 otherwise (excluding 5 years after the crises starts or while the crises last). The macroeconomic variables have the expected signs and are significant except for the growth rate of terms of trade and the claims of the private sector as a share of GDP. In this specification, the probability of a crisis increases both in the 5 years following liberalization and in liberalized financial systems.
These results, however, are very sensitive to the sample and the definition of financial liberalization. In the second column we report the results excluding Turkey7. The results now
are very different. The probability of a crisis is higher only during the 5 years following liberalization and there is no evidence that the probability of a crisis is higher in liberalized financial system.
The evidence is even stronger once we use date of financial liberalization based on Williamson and Mahar (1998) and Drees and Pazarbasioglu (1998) surveys (see table 1). Column 3 reports the results (including Turkey) using the adjusted dates of financial
liberalization. The coefficients of the financial liberalization dummy variable is insignificant (and negative) while the coefficients of the dummy variable for the 5 years period following a financial liberalization variable is significant and positive. Thus, there is supporting evidence
6 The results are simialir when we use other definition such as 3 years period instead of 5 years.
7 One reason to exclude Turkey is that Turkey had additional banking crises during 1980-95, but these crises
that countries that liberalized in the last 5 years have higher probability of a crisis. There is no evidence that liberalized financial system increases the probability of a crisis.
Finally, in the fourth column we present the results using our complete data set. 8 The results are consistent with the previous findings. Using this specification, the probability of a banking crisis in countries that have had financial liberalization in the past 5 years is higher by almost 9%.
To conclude, the results provide support to the model's prediction that the probability of a crisis is higher following a financial liberalization. There is little evidence that banking crisis is more likely to occur in liberalized financial system after controlling for the period following the liberalization.
4.3. Transparency
In this section we turn to test whether the increase in the probability of a crisis depends on transparency as the model predicts. That is, do countries that liberalize their financial sector are more likely to have a banking crisis if transparency is poor? One difficulty in carrying out this test is that it is hard to find a good data about transparency. Thus, we use three different measures to construct proxies for transparency. First, we use an index of corruption as a proxy for transparency. The source of the corruption index is Political Risk Services, Syracuse, New York (ICRG indices). The index ranges from 0 to 6, where highly corrupted countries take a value 6 while non-corrupted countries take a value of 0. Using this index we create a transparency dummy variable that takes the value of 1 if the corruption
index is greater than or equal to 3, (which is about the median), and a value of 0 if the index takes a value less than 3.9
Second we use a combination of the size of the public sector and corruption to create a variable of transparency. Kopits and Craig (1998) argue that the transparency in government behavior is reflected mainly in the structure and functions of the public sector, such as financing operations. Thus, we create a measure of public sector size as the ratio of credits directed to the government and the public sectors relative to total domestic.'0We define country with large (small) public sector if the share is greater (smaller) than the median. We
combined this measure with our measure of corruption and define three levels of
transparency. Poor transparency if a country is corrupt and has large public sector; Medium transparency if a country is corrupt but has a small public sector or is not corrupt but has a
large public sector; Good transparency is a country, which is not corrupt and has a small public sector.
One caveat of using corruption as a proxy for transparency is that corruption by itself may affect the probability of a crisis. Financial liberalization may offer new opportunities for corruption that may lead to banking crisis. Thus, transparency may not affect banking crisis but corruption does. In order to test and address this issue, we use another proxy for
transparency that is not based on corruption. Our third measure of transparency is from the World Competitiveness Yearbook. The variable is based on a survey of executives in 46 countries who were asked to state whether they agree or disagree to the following statement "the government does not communicate its policy intentions clearly". The variable takes values from 1, agree, to 8, disagree. Unfortunately, this data is available only for 1998. Thus,
9 The results are robust to the exact definition.
we assume (quite heroically) that the level of transparency across countries has not changed significantly during our sample.
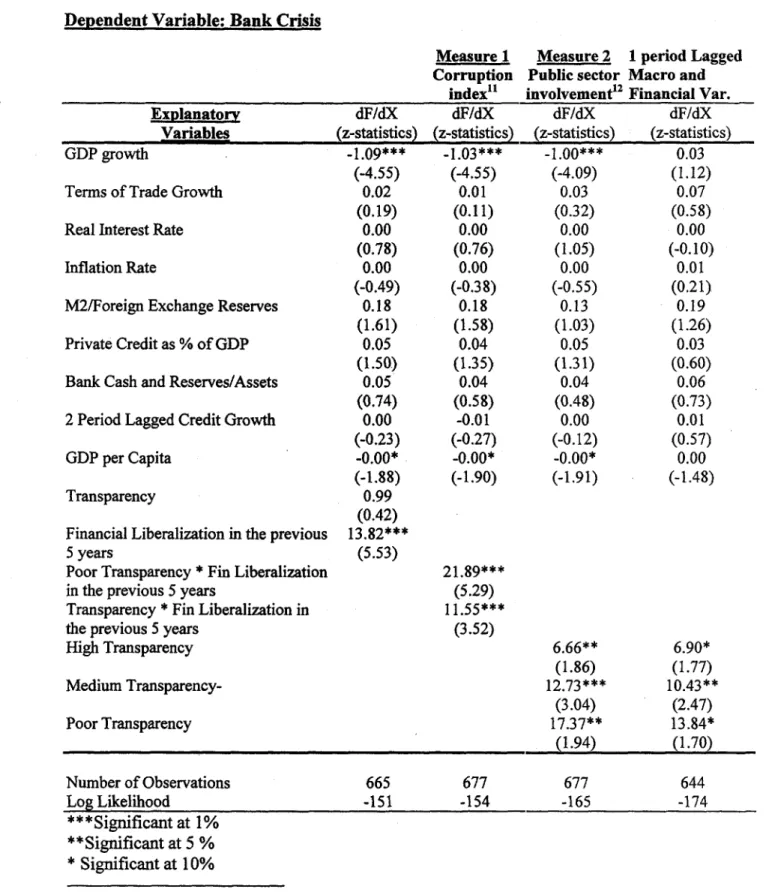
Table 4 presents the effect of transparency on the probability of a financial crisis. In the first column we test whether poor transparency by itself increases the probability of a crisis, i.e., whether countries with poor transparency are more likely to have banking crises. Thus, we add transparency, using the corruption proxy described above as an explanatory variable, to the probit model in the previous section. The coefficient on transparency variable is insignificant and hence there is no evidence that poor transparency (i.e. corruption) increases the probability of a crisis.
Next we turn to test whether poor transparency increases the probability of a crisis in the period following financial liberalization as the model predicts. We interact the
transparency dummy variable with the dummy variable of financial liberalization in the previous 5 years. That is, we create two dummy variables: One dummy takes value of one if there was a financial liberalization in the previous 5 years and transparency is poor, and zero otherwise. The other dummy takes value of one if there was a financial liberalization in the previous 5 years and transparency is good, and zero otherwise. Che results are presented in the
second column in table 4. Financial liberalization increases the probability of a crisis regardless of the level of transparency. However, much more so in countries with poor
transparency. The probability of a crisis in countries with poor transparency that undertake financial liberalization is higher by 10 percent compare to countries with good transparency (21.89 compare to 11.55). The coefficients of the two dummies are significantly different at 14% confidence level.
The results using our second definition of transparency are presented in the third
column. The results are consistent with the findings above. The increase in the probability of a crisis following financial liberalization decreases with the level of transparency (17.37, 12.73 and 6.66 for poor, medium and high transparency respectively).
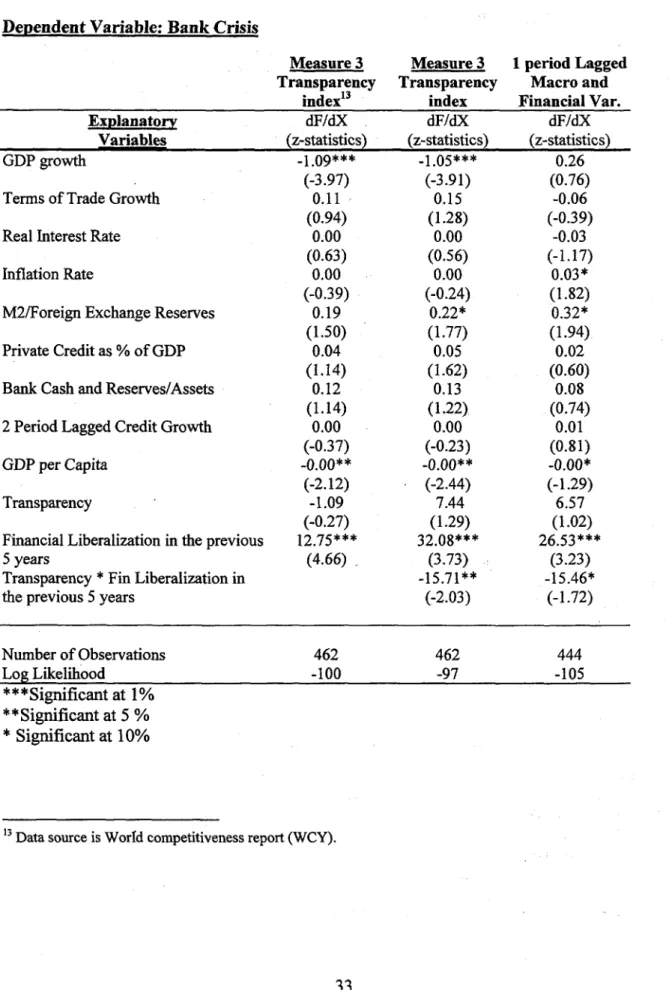
Using the third definition of transparency does not change the results significantly. In table 5 we present the results using the direct measure of transparency in our probit
estimation. In the first column we test whether transparency increases the probability of a crises. We find no evidence that lack of transparency increases the probability of a crisis. The coefficient on transparency is insignificant. In the second column we test whether lack of transparency increases the probability of a banking crisis following financial liberalization by adding an interaction of financial liberalization in the past 5 years dummy with the level of transparency. Consistent with our findings in table 4 we find that the interaction term is significant and positive, i.e., that countries that are non transparent are more likely to have a banking crisis following financial liberalization than countries that are transparent. Finally, as robustness test we present the results using lag values of the macro and financial variables. One could argue that using lags is better specification since banking crises affects the macro and financial variables at the same period. Since our focus here is the effects of liberalization
and transparency and not the effects of macro and financial variables we present the results only as a robustness test to the effects of liberalization and transparency on the probability of a crisis and not investigate this further. The results are presented in the last columns in table 4
and 5. The effects of financial liberalization and transparency are again robust to the lagged specification. The effects of macro and financial variables, however, are not robust to the lagged specification.
5. Conclusions
The main conclusion of the analyses is that the probability of a banking crisis is higher during the period of transition when the prior information set is uncertain. One such case of transition is when countries undertake financial liberalization. We show that the probability of a banking crisis is higher in the short period following the financial liberalization.
Furthermore, we show that the increase in the probability of a crisis is much higher in countries with poor transparency.
It is important, however, to note that this does not mean ttiat countries should not
liberalize their financial sector. Rather, the lesson is that countries should be more transparent, especially during a period of transition. In this sense, it is better to liberalize the financial system slowly in countries with poor transparency so banks have more time to get information and update their belief.
References
Aghion, Philippe, Philippe Bacchetta, and Abhijit Banerjee, 1999, "Capital Markets and the Instability of Open Economies," Mimeo, January.
Calvo, G., 1999, "Contagion in Emerging Markets: When Wall Street Is a Carrier," Mimeo University of Maryland.
Calvo, G. and E. Mendoza, 1999, "Rational Herd Behavior and the Globalization of
Securities Markets," National Bureau of Economic Research. Working Paper Series No. 7153, June.
Campos, Ed, Root, Hilton L, 1994, "Information Aggregation and Economic Development: The Case of East Asia" University of Western Ontario, Papers in Political Economy, 50, December.
Caprio, Gerald, Jr. and Daniela Klingebiel, 1996, "Bank Insolvencies, Cross-country Experience," The World Bank, Policy Research Working Paper 1620.
Demirguc-Kunt, Asli and Enrica Detragiache, 1998a, "The Determinants of banking Crises in Developing and Developed Countries," IMF Staff Papers, Vol. 45, No.1, March.
Demirguc-Kunt, Asli and Enrica Detragiache, 1998b. "Financial Liberalization and financial Fragility," IMF working paper, WP/98/83, June.
Drees, Burkhard and Ceyla Pazarbasioglu, 1998, "The Nordic Banking Crises- Pitfalls in Financial Liberalization?" IMF Occasional Paper 161, April.
Honohan, Patrick, 1999, "A Model of Bank Contagion Through Lending," International Review of Economic and Finance, v8,n2.
Kaminsky, Graciela and Carmen Reinhart, 1998, "The Twin Crises: The Causes of Banking and Balance-of-Payments Problems," American Economic Review, 89, June.
Kaufmnann, Daniel, Gil Mehrez, and Sergio Schmukler, 1999, "Predicting Currency
Fluctuations and Crises: Do Resident Firms Have an Informational Advantage?" Mimeo ,The World Bank, July.
Kopits, George and Jon Craig, 1998, "Transparency in Government Operations," IMF Occasional Paper 158, January.
Kodres, L. and M. Pritsker, 1998, "A Rational Expectations Model of Financial Contagion," United States Board of Governors of the Federal Reserve System, Finance and
Myers, Stewart C and Nicholas S. Majluf, 1984, "Corporate and financing and investment decisions when firms have information that investors do not have" Journal of Financial
Economics (Netherlands), 13, June.
Lindgren, Carl-Johan, Gillian Garcia, and Mattew I. Saal, 1996, "Bank Soundness and macroeconomic Policy." International Monetary Fund.
Pill, Huw and Mahmood Pradhan, 1995, "Financial Liberalization in Africa and Asia,"IMF Working Paper No. 95/123, November.
Stiglitz, Joseph and Andrew Weiss, 1981, "Credit Rationing in Markets with Imperfect Information," American Economic Review; v71 n3 June.
Williamson, John and Molly Mahar, 1998, "A Survey of Financial Liberalization," Essays in International Finance, No.211, November.
Zeira, Joseph, 1999, "Informational overshooting, booms, and crashes," Journal of Monetary
Table 1: Financial Liberalization and Banking Crises
COUNTRY FINANCIAL LIBERALIZATION 1973-1998 CRISES
USA Abolition of capital controls in 1973*. 1984-1991 Deregulation of interest rates and credit controls from 1,395 banks were
1982*. Interstate banking regulations eased in 1995. closed
Great Liberalized foreign exchange purchases from 1973*. 1973-1975
Britain Reserve assets ratio abolished in 1981* and banks were Secondary Banking allowed to compete with building societies for housing Crisis
finance after 1981. London stock exchange was fully
liberalized in 1985.
Belgium Financial markets partly liberalized by 1977*. Capital No major crisis controls were eased in 1986* with the adoption of the
EEC Program.
Denmark Restrictions on purchase of foreign securities and on 1987-1991 direct investments were eased in 1983*. In 1985*
further liberalization measures were adopted.
France Interest rates (except those on subsidized loans) freed 1991-1995
in 1984*. Large losses by
Universal banks permitted in 1985*. Financial banks, especially by institutions became less specialized by mid-1980s and Credit Lyonnais capital controls started to be lifted. Several French
banks were privatized in 1987 and Banque de France
was privatized in 1993.
Germany Capital controls dismantled, foreign banks pernitted 1977-1979
and interest rates were freely market-determined from Giroinstitutions faced 1973*. Stock market regulations were eased in 1980*. problems
Italy Credit ceilings eliminated in 1983* (although re- 1990-1994 imposed temporarily between 1986 and 1987). Reserve 58 banks were in requirements were lowered between 1988* and 1994. difficulties Foreign banks were permitted in 1993 as well as some
privatization
of state-owned banks.Netherlands The financial sector was partly liberalized by 1977*. In No major crisis 1983* all restrictions on capital controls were lifted. In
1986 all restrictions on capital outflows were
abolished.
Norway Interest rate controls were removed in 1985*. In 1987 1987-1993 supplementary reserve requirements were removed. Heavy losses and Foreign exchange controls were removed in 1989*. insolvencies Sweden Ceilings on interest rates for private sector bonds were 1990-1993
lifted in 1980*. Also, foreigners were allowed to hold 18% of total bank Swedish shares in the same year. In 1985 ceilings on loans were reported bank loan rates were abolished. Foreign exchange lost
controls were lifted in 1989*.
Canada Financial sector was largely liberalized during thie 1983-1985
period examined. In 1980* foreign banks were 15 members of the permitted, although with some regulations. Reserve Canadian Deposit requirements were eliminated in the early 1990s. Insurance
Corporation failed Japan Controls on capital inflows and interest rate regualations 1991-1997
were eased from 1979*. Controls on capital outflows eased in the 1986*. The requirements of bank
specialization were reduced by 1993. Further liberalization to be implemented by 2001.
Finland Regulations on bank lending rate were abolished in 1991-1993 1986*. In 1986 exchange control regulations were Liquidity crisis in lifted on long-term foreign borrowing. Cross border 1991
capital movements were liberalized in 1991*.
Greece The process of liberalization of capital movements 1991-1995 started in 1987* with the adoption of the EEC Program.
Abolition of exchange rate controls in 1994*.
Ireland Restrictions on acquirement of foreign securities were 1985 eased in 1979*. Restrictions on long-terms capit;al
outflows were eased in 1988*. Regulations on exchange control were lifted in 1993.
Austria Interest rate liberalized in 1980*
Portugal Controls on purchases of foreign securities were 1986-1989 relaxed in 1989*. In 1992* regulations on exchange
control were lifted.
Turkey Interest rate ceilings on loans and deposits eliminated 1982-1985 in 1980*. Direct credit was phased out in 1988. Capital five banks were
flows were liberalized in 1990*. rescued 1991 1994
Bank closures Australia Deposit rate controls lifted in 1980*. Capital account 1989-1990
liberalized in 1984. Most loan-rate ceilings abolished in government
1985. Capital markets deregulated in 1986*. intervention to cover bank losses
New Foreign exchange controls removed in 1984*. Initerest 1987-1990 Zealand rates controls eliminated in 1985* as well as
requirements for financial institutions to purchase government securities. Stock exchange was liberalized inl 986.
South Africa Interest rate controls and credit ceilings were removed 1977 in 1980*. Restrictions on bank competition were 1985 eliminated and new banks were allowed in 1984*.
Argentina Credit controls were initially removed in 1977* but re- 1980-1982 imposed in 1981. The initial liberalization of 1977 was 168 banks closed reversed in 1982. Deposit rates were freed in 1987*. down
Credit controls were substantially reduced in 1993*. 1989-1990 bank failure
accounted for 40% of financial system assets
Brazil Interest rate ceilings removed in 1976 and re-imposed 1994-1997
in 1979. Deposit rates were fully liberalized in 1989*. 29 banks subjected to Entry barriers reduced after 1991. Controls on capital intervention
inflows were strengthened while controls on outflows were loosened in the
1990s.
Chile Commercial bank interest rates were liberalized in 1981-1983 1974. New foreign banks admitted in 1977*.Capital bank failures controls were gradually eased since 1979. Controls
were re-imposed in 1982 and eased again in 1985*.
Colombia Deposit rates were market-determined in 1980*. The 1982-1987 remaining controls on interest rates were lifted by central bank
1994*. The large capital inflows in the early 1990s led intervened to rescue to the re-imposition of reserve requirements on foreign commercial banks loans in 1993 after having been relaxed in 1991.
Ecuador Interest rate liberalized in 1986*. 1995
Guatemala
Guyana Interest rate liberalized in 1991*. 1993-1995
Honduras Interest rate liberalized in 1990*.
Jamaica Interest rate liberalized in 1991 *. 1994-1995. Mexico Deposit and loan rates liberalized in 1989*. 1982
Government gave discretion over foreign direct 1995
investment in 1972. Portfolio flows were decontrolled Accumulated losses even further in 1989. National banks were privatize in estimated at 12-15% 1992* and the entry of new banks was permitted. of GDP
Paraguay Capital controls were removed in 1988*. Foreign 1995 exchange controls were liberalized in 1993*. government
intervention Peru Capital controls and interest rate controls were No major crisis
removed in 1991*. Subsidized lending was eliminated in 1992*
El Salvador Interest rate liberalized in 1991*. 1989 Uruguay Interest rate liberalized in 1980*. 1981-1985 Venezuela Reserve requirements were reduced in the early 1990s. 1994
Interest rate controls and foreign exchange controls Insolvent banks
were liberalized in 1991*. accounted for 30% of
financial system deposits
Israel Restrictions on investment were eased in 1987* and 1983-1984
restrictions on capital flows started to be eased. nationalization of the Subsidized interest rates on priority lending was phased major banks
1990. _ __
Jordan Interest rate liberalized in 1988*. 1989-1990
Egypt Interest rates and foreign exchange controls were lifted 1981-1983 in 1991 *.Ceilings on credit to private sector were lifted 1990-1991 too. Foreign banks were permitted to conduct business
in foreign currency in 1992*. Syria
Sri Lanka The exchange rate was unified in 1978. Capital 1989-1993
controls on inflows of capital were eased in 1978*. nationalization of the Foreign banks were permitted since 1979.Restrictions major banks
on capital outflows remain.
India Partially liberalized in 1992*. 1991-1995
Indonesia Most deposit and loan rates were freed in 1983."' The 1992-1998 monopoly of state-owned banks over the deposits of
state-owned enterprises were removed in 1989*, New foreign banks were allowed to establish joint ventures in 1988.
Korea Controls on outward and inward foreign investmnent 1985-1986 were gradually eased since 1983*.
Malaysia Interest rates and capital accounts were liberalized by 1985-1988 1978.*Controls on interest rates were then re-imposed
in 1985 and completely eliminated in 1992*.
Nepal Interest rates were liberalized by 1989*. 1988-1994 Papua New Interest rate liberalized in 1980* 1989-1995 Guinea
Philippines Interest rates controls mostly phased out over 1981*- 1981-1987
85. Direct credit partly abolished in 1983. Restrictions banks accounting for on all current and capital transactions eliminated over 1.6% of the banking 1992-1995. Restrictions on foreign-bank branch:ing system failed in 1981 lifted in 1994*.
Singapore Financial sectors largely liberalized by 1977*. 1982 Exchange and capital controls were
freed
in 1978*.Thailand Restrictions on inwards long-term investments were 1983-1987
eased in 1985*. Direct credit was gradually eliminated 15% of bank assets after 1980. Foreign banks were permitted in 1990. were non-performing Ceilings on loan rates were removed in 1992*.
Kenya Ceilings on interest rates were removed in 1991)'. 1985-1989 liquidity and solvency problems
Mali 1987-1989
Nigeria Interest rate liberalized in 1990*. 1991-1995 Tanzania Controls on interest rates were eased in 1986*. 1988-1994 Exchange controls were abolished in 1992*. state-owned
were insolvent
Togo Interest rate liberalized in 1993*. 1993-1995
Uganda Interest rate liberalized in 1991 *. 1994
Zaire Interest rate liberalized in 1980*. 1991-1995
Zambia Limits on remittances of profits and dividends were 1995 eased in 1990*. Exchange controls were abolished and
interest rates were liberalized in December 1993*.
* presents the year of financial liberalization in our data set.
Sources on financial liberalization:
- Pill, H., Pradhan, M. "Financial Indicators and Financial Change in Africa and Asia". IMF Working Paper No. 95/123. Washington D.C.: November 1995. (for Kenya, Tanzania and
Zambia).
- Demirguc, Asli and Enrica Detraagiache, "Financial Liberalization and Financial Fragility." IMF working paper; WP/98/83, June 1998 (for Austria, Ecuador, Guyana, Honduras,
Jamaica, El Salvador, Uruguay, Jordan, Papua New Guinea, Nigeria, Togo, Uganda, and Zaire)
- Drees, B., Pazarbasioglu, C. "The Nordic Banking crises. Pitfalls in Financial
Liberalization?". IMF Occasional Paper No. 161. Washington D.C.: April 1998 (for Sweden,
Norway and Finldnd).
- Bakker, A. 1996. "The Liberalization of Capital Movements in Europe". The Netherlands: Kluwer Academic Publishers (for Belgium, The Netherlands, Greece, Ireland and Portugal). - Lindgren, C., Garcia, G., Saal, M. 1996. "Bank Soundness and Macroeconomic Policy". IMF. Washington D.C. (for Paraguay)
- Williamson, J., Mahar, M. 1998. "A Survey on Financial Liberalization". Essays in
International Finance No. 211. International Finance Section (for Argentina, Australia, Brazil,
Canada, Chile, Colombia, Egypt, France, Germany, Great Britain, India, Indonesia, Israel, Italy, Japan, Korea, Malaysia, New Zealand, Nigeria, Peru, The Philippines, Singapore, South Africa, Sri Lanka, Thailand, Turkey, USA, and Venezuela).
Sources on Banking Crisis:
- Caprio, G., Klingebiel, D. 1996. "Bank Insolvencies. Cross country Experience" Policy Research Working Paper No. 1620. World Bank. (for Australia, New Zealand, Chile,
Colombia, Mexico, Peru, Venezuela, Egypt, Sri Lanka, Singapore, Kenya, Zambia).
- Demirguc, Asli and Enrica Detraagiache, "Financial Liberalization and Financial Fragility." IMF working paper; WP/98/83, June 1998 (for Austria, Thailand, Togo, and Uganda) - Drees, B., Pazarbasioglu, C. 1998. "the Nordic Banking Crisis: Pitfalls in Financial Liberalization?". IMF Occasional Paper No. 161. (for Norway, Sweden, Finland).
- Lindgren, C., Garcia, G., Saal, M. 1996. "Bank Soundness and Macroeconomic Policy". IMF. Washington D.C. (for Argentina, Brazil, Canada, Denmark, Ecuador, Finland, France,
Germany, Greece, Guyana, India, Indonesia, Ireland, Israel, Italy, Jamaica, Jordan, Japan, Korea, Malaysia, Mali, Mexico, Nepal, Netherlands, Nigeria, Norway, Papua New Guinea, Paraguay, Peru, The Philippines, El Salvador, South Africa, Sweden, Switzerland, Tanzania,
Table 2: Banking Crises and Financial Liberalization
Total Number of Banking Crisis 60
Prior to the financial liberalization 15
Five years after liberalization 36
More than five years after liberalization 9
Total Number of Liberalization 92
Number of liberalization which did not have a crisis in the next 5 years 52 Number of liberalization which had a crisis in the next 5 years 40
Figure 1: Duration Between Liberalization and a Crisis
(in countries which had banking crisis following liberalization)
14 12 -.1 10
E
0 0~ ~ ~ ~~~~3Table 3: Probit Estimates: Financial Liberalization
Dependent Variable: Bankingf crisis
Excluding Turkey
Exolanatory dF/dX dF/dX dF/dX dF/dX
Variables (z-statistics) (z-statistics) (z-statistics) (z-statistics)
GDP growth -0.54*** -0.48*** -0..41*** -0.40***
(4.21) (-3.83) (4.10) (4.07)
Terms of Trade Growth -0.02 -0.02 -0.02 -0.02
(0.44) (-0.41) (-0.49) (-0.42)
Real Interest Rate 0.03** 0.04** 0.04*** -0.01
(2.30) (2.27) (2.61) (-0.29)
Inflation Rate 0.04** 0.03 0.03** 0.00
(2.38) (1.18) (2.02) (-0.24)
M2/Foreign Exchange Reserves 0.09 0.08 0.08* 0.06
(1.45) (1.41) (1.73) (1.30)
Private Credit as % ofGDP 0.02 0.02 0.01 0.01
(0.88) (0.95) (0.59) (0.47)
Bank Cash and Reserves/Assets -0.04 -0.03 -0.03 -0.01 (-1.10) (-0.82) (-1.08) (-0.58) 2 Period Lagged Credit Growth 0.07** 0.08*** 0.06** 0.045*
(2.44) (2.61) (2.33) (1.85)
GDP per Capita -0.00** -0.00** -0.00* -0.00*
(-2.39) (-2.18) (-1.90) (-1.90)
Financial Liberalization 2.37 1.29 -0.58
(1.59) (0.83) (-0.38) Financial Liberalization in the past 2.43 3.65*
3 years with D & D dates2 (1.46) (1.89)
Financial Liberalization in the past 9.31*** 8.60***
5 years with our dates (3.20) (5.06)
Number of Observations 632 624 632 728 Log likelihood -87 -82 -81 -89 ***Significant at 1% **Significant at 5 % * Significant at 10% 'Significant at 6 % 2
Table 4: Probit Estimates : Financial Liberalization and Transparency (1)
Dependent Variable: Bank Crisis
Measure 1 Measure 2 1 period Lagged Corruption Public sector Macro and
index1" involvementl2 Financial Var.
Explanatory dF/dX dF/dX dF/dX dF/dX
Variables (z-statistics) (z-statistics) (z-statistics) (z-statistics)
GDP growth -1.09*** -1.03*** -1.00*** 0.03
(-4.55) (-4.55) (-4.09) (1.12)
Tenns of Trade Growth 0.02 0.01 0.03 0.07
(0.19) (0.11) (0.32) (0.58)
Real Interest Rate 0.00 0.00 0.00 0.00
(0.78) (0.76) (1.05) (-0.10)
Inflation Rate 0.00 0.00 0.00 0.01
(-0.49) (-0.38) (-0.55) (0.21)
M2/Foreign Exchange Reserves 0.18 0.18 0.13 0.19
(1.61) (1.58) (1.03) (1.26)
Private Credit as % of GDP 0.05 0.04 0.05 0.03
(1.50) (1.35) (1.31) (0.60)
Bank Cash and Reserves/Assets 0.05 0.04 0.04 0.06
(0.74) (0.58) (0.48) (0.73)
2 Period Lagged Credit Growth 0.00 -0.01 0.00 0.01
(-0.23) (-0.27) (-0.12) (0.57)
GDP per Capita -0.00* -0.00* -0.00* 0.00
(-1.88) (-1.90) (-1.91) (-1.48)
Transparency 0.99
(0.42) Financial Liberalization in the previous 13.82***
5 years (5.53)
Poor Transparency * Fin Liberalization 21.89***
in the previous 5 years (5.29)
Transparency * Fin Liberalization in 11.55***
the previous 5 years (3.52)
High Transparency 6.66** 6.90* (1.86) (1.77) Medium Transparency- 12.73*** 10.43** (3.04) (2.47) Poor Transparency 17.37** 13.84* (1.94) (1.70) Number of Observations 665 677 677 644 Log Likelihood -151 -154 -165 -174 ***Significant at 1% **Significant at 5 % * Significant at 10%
"Data source Political risk services of ICRG.
Table 5: Probit Estimates: Financial Liberalization and Transparency (2)
Dependent Variable: Bank Crisis
Measure 3 Measure 3 1 period Lagged
Transparency Transparency Macro and
index13 index Financial Var.
Explanatory dF/dX dF/dX dF/dX
Variables (z-statistics) (z-statistics) (z-statistics)
GDP growth -1.09*** -1.05*** 0.26
(-3.97) (-3.91) (0.76)
Terms of Trade Growth 0.11 0.15 -0.06
(0.94) (1.28) (-0.39)
Real Interest Rate 0.00 0.00 -0.03
(0.63) (0.56) (-1.17)
Inflation Rate 0.00 0.00 0.03*
(-0.39) (-0.24) (1.82)
M2/Foreign Exchange Reserves 0.19 0.22* 0.32*
(1.50) (1.77) (1.94)
Private Credit as % of GDP 0.04 0.05 0.02
(1.14) (1.62) (0.60)
Bank Cash and Reserves/Assets 0.12 0.13 0.08
(1.14) (1.22) (0.74)
2 Period Lagged Credit Growth 0.00 0.00 0.01
(-0.37) (-0.23) (0.81)
GDP per Capita -0.00** -0.o0** -0.00*
(-2.12) (-2.44) (-1.29)
Transparency -1.09 7.44 6.57
(-0.27) (1.29) (1.02)
Financial Liberalization in the previous 12.75*** 32.08*** 26.53***
5 years (4.66) (3.73) (3.23)
Transparency * Fin Liberalization in -15.71** -15.46*
the previous 5 years (-2.03) (-1.72)
Number of Observations 462 462 444
Log Likelihood -100 -97 -105
***SSignificant at 1% **Significant at 5 % * Significant at 10%
Policy Research Working Paper Series
Contact
Title Author Date for paper
WPS2265 The Political Economy of Distress Paola Bongini January 2000 R. Vo In East Asian Financial Institutions Stijn Claessens 33722
Giovanni Ferri
WPS2266 The Impact of Adult Deaths on Martha Ainsworth January 2000 S. Fallon Children's Health in Northwestern Innocent Semali 38009 Tanzania
WPS2267 Do High Interest Rates Defend Aart Kraay January 2000 R. Bonfield
Currencies during Speculative Attacks? 31248
WPS2268 The Structure of Social Disparities Deon Filmer January 2000 S. Fallon
In Education: Gender and Wealth 38009
WPS2269 Context Is Everything: Measuring Nauro F. Campos January 2000 J. Victor
Institutional Change in Transition 36549
Economies
WPS2270 The Optimal Income Tax When Waly Wane January 2000 H. Sladovich
Poverty Is a Public "Bad" 37698
WPS2271 Corporate Risk around the World Stijn Claessens January 2000 R. Vo
Simeon Djankov 33722
Tatiana Nenova
WPS2272 Ownership versus Environment: Ann P. Bartel January 2000 S. Fallon Disentangling the Sources of Public Ann E. Harrison 38009 Sector Inefficiency
WPS2273 The Value of Preventing Malaria Maureen L. Cropper January 2000 T. Tourougui
In Tembien, Ethiopia Mitiku Haile 87431
Julian A. Lampietti Christine Poulos Dale Whittington
WPS2274 How Access to Urban Potable Water Anqing Shi January 2000 P. Sintim-Aboagye
and Sewerage Connections Affects 37644
Child Mortality
WPS2275 Who Gained from Vietnam's Boom Paul Glewwe January 2000 P. Sader In the 1990s? An Analysis of Poverty Michele Gragnolati 33902 An Analysis of Poverty and Hassan Zaman
Inequality Trends
WPS2276 Evaluating the Case for Export Arvind Panagariya January 2000 L. Tabada
Policy Research Working Paper Series
Contact
Title Author Date for paper
WPS2277 Determinants of Bulgarian Brady Nina Budina January 2000 N. Budina Bond Prices: An Empirical Tzvetan Mantchev 82045 Assessment
WPS2278 Liquidity Constraints and Investment Nina Budina JanLuary 2000 N. Budina in Transition Economies: The Case Harry Garretsen 82045 of Bulgaria
WPS2279 Broad Roads in a Thin Country: Andres G6rnez-Lobo JanLuary 2000 G. Chenet-Smith
Infrastructure Concessions in Chile Sergio Hinojosa 36370 WPS2280 Willingness to Pay for Air Quality Hua Wang JanLiary 2000 R. Yazigi
Improvements in Sofia, Bulgaria Dale Whittington 37176 WPS2281 External Sustainability: A Stock Cesar Calder6n January 2000 H. Vargas
Equilibrium Perspective Norman Loayza 38546
WPS2282 Managing Fiscal Risk in Bulgaria Hana Polackova Brixi JanLary 2000 L. Zlaoui
Sergei Shatalov 33100
Leila Zlaoui
WPS2283 New Tools and New Tests in Thorsten Beck February 2000 P. Sintim-Aboagye Comparative Political Economy: George Clarke 38526
The Database of Political Institutions Alberto Groff Philip Keefer Patrick Walsh
WPS2284 The Use of Asset Management Daniela Klingebiel February 2000 R. Vo
Companies in the Resolution of 33722
Banking Crises: Cross-Country Experience
WPS2285 Industrial Environmental Performance Susmita Dasgupta February 2000 Y. D'Souza in China: The Impacts of Inspections Benoit Laplante 31449
Nlandu Mamingi Hua Wang