United States Department of Agriculture Forest Service Rocky Mountain Research Station
General Technical Report RMRS-GTR-106WWW Revised January 2005
BehavePlus
fire modeling system
Version 3.0
User’s Guide
Patricia L. AndrewsCollin D. Bevins Robert C. Seli
Andrews, Patricia L.; Bevins, Collin D.; Seli, Robert C. 2005. BehavePlus fire modeling system, version 3.0: User's Guide. Gen. Tech. Rep. RMRS-GTR-106WWW. Ogden, UT: Department of Agriculture, Forest Service, Rocky Mountain Research Station. 142p.
This publication has been revised for changes made to version 3 of the BehavePlus software, it was originally published as the BehavePlus fire modeling system, version 2.0 User’s Guide in June, 2003
The BehavePlus fire modeling system is a program for personal computers that is a collection of mathematical models that describe fire and the fire environment. It is a flexible system that produces tables, graphs, and sim-ple diagrams. It can be used for a multitude of fire management applications including projecting the behavior of an ongoing fire, planning prescribed fire, and training. BehavePlus is the successor to the BEHAVE fire behavior prediction and fuel modeling system. Primary modeling capabilities include surface fire spread and intensity, crown fire spread and intensity, safety zone size, size of point source fire, fire containment, spotting distance, crown scorch height, tree mortality, wind adjustment factors, and probability of ignition. The User's Guide describes operation of the program. Other papers describe the models and application of the system.
Keywords
Fire behavior, fire spread, fire intensity, computer program
The Authors
Patricia L. Andrews is a Research Physical Scientist at the Fire Sciences Laboratory in Missoula, MT. She received a B.A. degree in mathematics and chemistry from Montana State University, Billings in 1970 and an M.A. degree in mathematics and computer science in 1973 from the University of Montana, Missoula. She has been at the Fire Sciences Laboratory since 1973, serving as Project Leader of the Fire Behavior Research Work Unit from 1991 to 1996.
Collin D. Bevins is Director of Systems for Environmental Management, a Missoula, MT, nonprofit research and educational organization founded in 1977. Collin earned a B.A. degree from Carleton College, Northfield, MN in 1974, and an M.S. degree in forestry, University of Washington, Seattle, 1975.
Robert C. Seli is a Forester at the Fire Sciences Laboratory in Missoula, MT. He was previously a District Fire Management Officer on the Lolo National Forest, a Silviculturist on the Nezperce National Forest, and received a B.S. degree in forestry from North Carolina State University in 1974.
Acknowledgments
Funding for development of the BehavePlus program and supporting material was provided by the Joint Fire Sci-ence Program; USDA Forest Service, Rocky Mountain Research Station, Fire Behavior Research Work Unit; USDA Forest Service, Fire and Aviation Management, Washington D.C.; and Systems for Environmental Man-agement.
Program development and supporting material was done primarily through contracts #53-0343-7-0020 and #53-0343-0-0011 with Systems for Environmental Management (SEM).
The following SEM people contributed to the project: Collin Bevins (program design and development), Don Carlton (version 1 User's Guide and online help system), Deb Tirmenstein (program testing, document review and editing), Joe Scott (online help and supporting material for the fire models added in versions 2 & 3), Mark Finney (supporting material for the fire models added in version 3)and Miguel Cruz (Portuguese translation for the 'language' option).
Cover Art
"WILDFIRE" (C) 1992, an original acrylic painting by Monte Dolack. Trumpeter swans take refuge in the air as a threatening wildfire rages through the forest habitat. This image is from a 29" x 24" poster commissioned by the National Wildfire Foundation and used here by permission of the artist.
All images used in BehavePlus and its associated manuals and training materials are from original works by Monte Dolack and appear by permission of the artist.
Preface
This User's Guide explains how to use the BehavePlus fire modeling system software. Other papers will describe the models incorporated into the system and application of the predictions.
This is an RMRS online publication. It can be downloaded from the Rocky Mountain Research Station publica-tions web page, http://www.fs.fed.us/rm/main/pubs/electronic.html
You can download this User's Guide and the BehavePlus program and provide comments through the Behave-Plus web site, http://fire.org
This User's Guide is also an integral part of the BehavePlus system, serving as online help.
This publication has been revised from it’s original June, 2003 release. It will continue to be updated as features and modeling capabilities are added to the program.
The BehavePlus system is supported by USDA Forest Service
National Fire and Aviation Management Information Systems Team 3833 S. Development Avenue
Boise, ID 83705 (800) 253-5559
What’s New
Version 3 is an upgrade to version 2 that was released in July, 2004. Several major new features have been added in version 3.
• Crown fire modeling
• Table shading for acceptable fire conditions (replaces RxWINDOW in BEHAVE) • Calculating wind adjustment factors
• A expanded set of standard fuel models
A complete list of version 3 changes can be found in Appendix A
The use of trade or firm names in this publication is for reader information and does not imply endorsement by the U.S. Department of Agriculture of any product or service.
USDA Forest Service General Technical Report RMRS-GTR-106WWW. 2005 i Table of Contents 1. Introduction . . . .1 2. Operation . . . .7 2.1. Organization. . . .7 2.2. Design. . . .8 2.3. Features . . . .10 2.4. Installation. . . .11 2.5. Definitions . . . .13
2.6. Menus and Toolbar . . . .13
3. Worksheets . . . .15
3.1. Worksheet layout . . . .15
3.2. Example Worksheets. . . .15
3.3. Worksheet Sections. . . .16
3.4. Loading a previously saved Worksheet. . . .21
3.5. The 0Startup Worksheet. . . .22
3.6. Changing a Worksheet. . . .22
3.7. Saving a Worksheet or a Run . . . .22
4. Modules . . . .23
4.1. Input options . . . .23
4.2. Output Options . . . .24
5. Entering input . . . .27
5.1. Shaded text boxes . . . .27
5.2. Direct entry . . . .27
5.3. Input Guide. . . .27
5.4. Linked input variables. . . .29
6. Table output . . . .31
6.1. Single value calculation . . . .31
6.2. Table output. . . .32
6.3. Two way tables. . . .32
6.4. Table appearance . . . .34
6.5. Multiple pages. . . .34
7. Table Shading . . . .37
7.1. Activating the Table Shading Option . . . .37
7.2. Entering Acceptable Fire Conditions. . . .38
7.3. Viewing Results. . . .39
8. Graph output . . . .43
8.1. Single variable graph. . . .43
8.2. Two variable graph. . . .44
8.3. Axis scales . . . .46
8.4. Graph appearance . . . .51
8.5. Number of curve points. . . .57
9. Diagram output . . . .59
9.1. Wind/slope/spread direction . . . .59
9.2. Fire characteristics chart . . . .63
9.3. Shape of a point source fire. . . .66
9.4. Containment shape . . . .69
10. View, print, & capture results . . . .71
10.2. Pages . . . 71 10.3. Windows . . . 71 10.4. Print . . . 72 10.5. Saving Output . . . 73 11. Error checking . . . 75 12. Fuel models . . . 77
12.1. 13 Standard fuel models . . . 77
12.2. Palmetto-Gallberry fuel option . . . 77
12.3. Expanded set of 40 fuel models . . . 78
12.4. Dynamic fuel models . . . 78
12.5. Custom fuel models . . . 79
13. Moisture scenarios . . . 85
13.1. Using previously saved moisture scenarios . . . 85
13.2. Defining and saving moisture scenarios . . . 87
14. Map applications. . . 89
14.1. Slope from map measurements. . . 89
14.2. Map distances. . . 91
15. Units. . . 93
15.1. English or metric . . . 93
15.2. Custom units set . . . 93
15.3. Number of decimal places. . . 93
15.4. Units conversion tool . . . 94
16. Language. . . 95
16.1. English or Portuguese . . . 95
16.2. Custom language set . . . 95
17. Fine Dead Fuel Moisture Tool . . . 97
17.1. Saving and Documenting . . . 97
18. RH Tool . . . 99
19. Sun-Moon Calendar Tool . . . 101
20. File management . . . 103
20.1. Workspaces. . . 103
20.2. Load a Worksheet. . . 104
20.3. Load a Run. . . 104
20.4. Save as… . . . 104
20.5. Deleting Files & Folders. . . 105
21. Help . . . 107
21.1. Browser pane help. . . 107
21.2. Guide button . . . 107
21.3. User's Guide . . . 108
References . . . 109
Appendix A: Version Comparison . . . 111
USDA Forest Service General Technical Report RMRS-GTR-106WWW. 2005 1
1. Introduction
The BehavePlus fire modeling system is a PC-based program that is a col-lection of models that describe fire and the fire environment. It is a flexible
system that produces tables and graphs and can be used for a multitude of fire management applications. BehavePlus is the successor to the BEHAVE fire behavior prediction and fuel modeling system (Andrews 1986, Andrews and Chase 1989, Burgan and Rothermel 1984, Andrews and Bradshaw 1990). It is called the Behave-Plus fire modeling system to reflect its expanded scope (Andrews and Bevins 1999).
This document describes operation of the BehavePlus program. The fire models and their application are described elsewhere.
Many of the fire models in BehavePlus are the same as those in the FARSITE fire area simulator (Finney 1998),
NEXUS fire hazard tool, and the FlamMap fire behavior mapping and analysis system. Each system meets a dif-ferent need. The same surface fire spread model (Rothermel 1972) was used in each case. These three pro-grams and supporting documentation are available through www.fire.org. Shown below are example outputs from each system.
BehavePlus v3.0 User’s Guide DRAFT Introduction
USDA Forest Service General Technical Report RMRS-GTR-106WWW. 2005 3
Sample fire perimeter output from FASITE:
Version 1.0 of BehavePlus was based primarily on the same fire models that composed the old BEHAVE system. Development focus was initially on a new look and feel for the program. This paper describes version 3.0, which provides additional models and features. A summary of versions 3.0 changes is given in Appendix A.
The primary modeling capabilities of BehavePlus, version 3.0, include • Surface fire spread and intensity
• Safety zone size
• Size of a point source fire • Fire containment
• Spotting distance • Crown scorch height • Tree mortality
• Probability of ignition from fire brands or from lightning • Transition from surface to crown fire
• Crown fire spread
Other modeling capabilities include • Tables for fine dead fuel moisture • Tables for relative humidity or dew point • Standard and custom fuel models • Dynamic palmetto-gallberry fuel
• Three methods for weighting two fuel models: two-dimensional expected spread, harmonic mean, area weighted
• Sunrise, sunset, dawn, and dusk at any location or date Key features include
• Diagrams for point source fire shape, shape of a contained fire, fire characteristics chart, wind / slope / fire directions
• Shading of table output for acceptable fire conditions • Photographs and a key for the standard 13 fuel models • Distances in map units
• User control of input options and output variables • Description of each input and output variable
• User control of units and number decimal places displayed • Multiple values can be entered for almost any input variable
BehavePlus v3.0 User’s Guide DRAFT Introduction
USDA Forest Service General Technical Report RMRS-GTR-106WWW. 2005 5
The help system is an important part of the BehavePlus system. This User's Guide is available with the program for help on operation of the program. In addition, a help browser is available in the dialog boxes providing immediate information on specific operations and definition of input and output variables as shown below.
USDA Forest Service General Technical Report RMRS-GTR-106WWW. 2005 7
2. Operation
This User's Guide addresses only operation of the program. The fire mod-els, associated variables, and application are described elsewhere.
2.1. Organization
Organization of material on Operation of the BehavePlus program is different from the organization of the pro-gram itself. It is designed to help you find the answer to a question. Most users are comfortable with looking at menus and dialog boxes and associated information in the program without use of a User's Guide.
This is not a step-by-step operation manual, but a reference guide. The tutorials provide step-by-step instruc-tions.
In describing operation of the program, we use the following font and/or conventions in describing menus, com-mands, buttons, tabs, and check boxes:
Configure > Module selection > SURFACE > Options… > Fuel & Moisture > fuel models
radio button.For example the sequence of menus, commands, check boxes, buttons, and tabs shown above refers to the fol-lowing actions in BehavePlus:
Each of the above elements would be described in this User’s Guide as 1.
Configure
menu2.
Module selection
command 3.SURFACE
check box4.
Options...
button 5.Fuel & Moisture
tab 6.fuel models
radio buttonOther elements used in BehavePlus include
7. Spin box - select the value using the buttons or enter a value from the keyboard, 8. Text box - click inside the box to enter values from the keyboard,
9. Drop-down list - Choose the value from the list displayed with the button.
In the interest of saving space and improving readability, we include screen captures of only the portion of con-cern. The Tutorials include more complete screen captures.
2.2. Design
2.2.1. Page Oriented
BehavePlus is meant to be more than just a fire modeling tool. It is meant to be a lesson book with a built-in training manual, and a planning tool whose results may be incorporated into management reports. It is meant to be a fire behavior assessment aid whose tables and graphs can be shared with others in briefings and in written documentation.
Because of these expectations, the BehavePlus user interface is designed around the concept of the standard 8.5 x 11 printed page.
Given input information BehavePlus can generate documentation, diagrams, tables, and graphs. Fortunately, BehavePlus has a variety of methods for saving and displaying your work. Six months later when you need to review the work, the What, How, and Why of each Run is considerably less obscure than it would have been otherwise.
The page on which you enter input information appears first (page 1) and is called the Worksheet. A complex Worksheet may span several pages. Once the Calculate button is pressed, BehavePlus generates additional
BehavePlus v3.0 User’s Guide DRAFT Operation
USDA Forest Service General Technical Report RMRS-GTR-106WWW. 2005 9
2.2.2. Highly Configurable
BehavePlus is meant to be the repository of many current and future models related to fire behavior and effects. These models may have alternate input sets and can produce many output variables. Individual models may be linked together so that outputs from one module automatically become inputs for another module. Input and output variables may have user-specified units of measure. Outputs may be in the form of diagrams, tables, and/ or graphs. The language displayed on Worksheets and output pages may be changed.
BehavePlus may be used for fire behavior training, for fire planning, or for real-time fire behavior assessment. It may be used to assess just fire behavior, or just fire effects, or the link between them. It may be used to build custom fuel models, to determine astronomical events, or as a units conversion utility.
2.2.3. Self Documenting
The brooding step-brother of configurability is complexity. Because BehavePlus is so highly configurable and may be used by people in various roles for various purposes, it strives to be self-documenting in an attempt to thwart entropy. The input Worksheet automatically documents all Modules in use, all input variables and units of measure, all output variables and units of measure, and pertinent notes on the current configuration. The Worksheet also allows you to enter a Run description (and possibly additional training or fire incident informa-tion) and contains a notes field for free-field entry of expository text.
2.2.4. User Manual and Help
BehavePlus tries to provide pertinent information to you when you need it the most. The Guide Button next to each entry field opens a dialog box containing a help browser pane with suggested or valid inputs. The help browser pane describes input and output variables and program operation. The browser provides tables, pho-tographs, and figures to help you select inputs.
In addition, this User’s Guide is available as part of BehavePlus with the
Help > Program help
command.2.2.5. Not Boring
Finally, every attempt has been made to keep BehavePlus from becoming yet another boring program with a gray personality. Just in case all the complexity, configurability, widgets, dialogs, models, diagrams, tables, graphs, browsers, and quirky behavior aren't enough to hold your attention, here and there we've inserted some paint-ings we rather enjoy to ease our weary eyes.
If you, however, prefer the gray approach, you can eliminate the pictures for the entire session by clearing the
Show picture pane
check box on theConfigure > Appearance > Application
tab.You can also choose to show the art work or not in the dialog boxes with the Picture check box
2.3. Features 2.3.1. Fire Models
BehavePlus contains models to estimate
• surface fire spread rate, intensity, flame length, scorch height, and direction of maximum spread • surface fire spread rate, intensity, flame length, and scorch height in any compass direction • crown fire spread rate, critical thresholds, and fire type
• transition from surface to crown fire • fire shape, area, and perimeter
• spotting distance from a burning pile, from torching trees, or from a wind-driven surface fire • success or failure of suppression resources to build line around a fire
• recommended fire safety zone radius, separation distance, and zone size • fire-induced tree mortality
• probability of fire ignition from firebrands • probability of fire ignition from lightning strikes • relative humidity or dew point temperature • midflame wind speed and wind adjustment factor • fine dead fuel moisture content
• sun-rise, sun-set, dawn, and dusk at any location or date • palmetto-gallberry dynamic fuels
• create and save custom moisture scenarios
BehavePlus v3.0 User’s Guide DRAFT Operation
USDA Forest Service General Technical Report RMRS-GTR-106WWW. 2005 11
2.3.2. Operation
BehavePlus has the following operational features:
• BehavePlus is cross-platform and works identically on all versions of Windows and Linux. • Multiple Worksheets may be open at one time.
• Worksheets may be overlaid, tiled, cascaded, and resized.
• Modules (collections of related fire models) may be individually toggled on/off.
• Modules may have alternate input options available through the
Configure > Module selection >
Options… > Input Options
tab.• Module output variables can be toggled on/off via the
Configure > Module selection > Options… >
Output Variables
tab.• Modules may be linked so the outputs from one module are automatically input into another module. • All distance outputs may be scaled to map units.
• All input and output units of measure may be modified by the user. • Custom Worksheet configurations may be saved and re-used. • Custom sets of units of measure may be saved and re-used.
• The Guide Button next to each Worksheet entry field displays a help browser pane with context-specific text and either a list of valid choices (for discrete variables) or fields for generating a range of input values. • Zero, one, or two input variables may have multiple entry values, producing either a simple result list, a
single one-way table, or a multi-page two-way table, respectively.
• If one input variable has multiple entry values, a separate graph can be generated for each output variable. If two input variables have multiple entry values each output variable graph contains a family of curves. • The SURFACE, SIZE, and CONTAIN Modules can produce diagrams of their results.
•
Help > Program help
makes this manual and all associated documentation available in PDF format for reading, web browsing, and printing.• The user interface language may be dynamically changed via
Configure > Language
. Portuguese (Por-tugal) was made available in version 2 as an example but was not updated to version 3. (Contact [email protected] if you'd like to volunteer to add support for another language).• Completed Runs may be saved and re-used. 2.4. Installation
2.4.1. Download
BehavePlus is available for download from www.fire.org. Simply follow the BehavePlus links to the download page and select the Windows installation package.
You should check the downloaded file size against the original to ensure you received the entire package. To be absolutely certain the package arrived intact, use the md5sum program from a command line prompt:
md5sum bp_3_0_0.exe
If the resulting 32-digit hexadecimal number is not identical to the one published on the BehavePlus download page, your download copy is corrupt.
2.4.2. System Requirements
BehavePlus has modest system requirements met by the most inexpensive computers available on the market: • Windows 95, 98, ME, NT, 2000, or XP
• Minimum 800 x 600 video resolution with 256 (8-bit) colors (recommend 1024 x 768 video resolution with 64K (16-bit) colors)
• 16 megabytes of available RAM • 20 megabytes of disk storage
2.4.3. Windows Installation
BehavePlus for Windows is packaged using the Wise Installation System. Simply type the name of the package (e.g., bp_3_0_0.exe) at a command prompt (or click on its name in Windows Explorer) and the installation wiz-ard will guide you through the process. This mostly consists of pressing the OK button.
2.4.4. File Structure
BehavePlus has a proscribed file system structure; all files must be located in specific subdirectories. The parent directory of this file structure and all its subdirectories and files are collectively known as a Workspace. When BehavePlus is first installed it has a single Workspace called "DefaultDataFolder" as shown below.
This is the default current Workspace every time BehavePlus is started.
We recommend that you use Workspaces to aid file management as you apply BehavePlus to several projects. See the section 20.1, Workspaces, for more information.
A list of three letter file extensions used by BehavePlus is shown in the following table. These extensions are automatically attached to the files you create in BehavePlus.
File extension File Type Folder
BehavePlus v3.0 User’s Guide DRAFT Operation
USDA Forest Service General Technical Report RMRS-GTR-106WWW. 2005 13
2.5. Definitions
A Worksheet is the first page or two containing the input Entry Fields. The content of a Worksheet depends upon the specific BehavePlus configuration including module selections, input options, output variables, units of measure, and diagram/table/graph options. Thus there are a large number of possible Worksheets. Some Exam-ple Worksheets are supplied with the BehavePlus distribution and are included in every Workspace. You may reconfigure BehavePlus as needed for any purpose, then save its Worksheet for later reuse. Functionally, a Worksheet is a BehavePlus configuration that does not have any input values associated with it.
A Run is a Worksheet that has a complete set of valid inputs, but no outputs are saved in a Run. You must cal-culate a saved Run to obtain outputs. Any given Worksheet may have an infinite number of Runs, each deter-mined by its input values. Runs may be saved for later use and review. The BehavePlus installation includes Example Runs.
A Model is a set of equations that estimate one or more output variables from one or more input variables. While BehavePlus contains many models, you will more commonly see references to Modules, which are collec-tions of models.
A Fuel Model is a set of numbers describing a fuel bed used by the surface fire spread model.
A Module is a collection of one or more Models that can be activated/deactivated by the user during Work-sheet configuration. Selecting the IGNITE Module, for example, includes both the firebrand ignition model and the lightning strike ignition model.
A Continuous Variable is an input or output variable that has a continuous range of values. Continuous variables have a minimum and maximum valid value. Examples include fuel moisture content, and wind speed.
A Discrete Variable has a finite set of valid values. Examples include Fuel Model, Spotting Source Location, and Tree Species.
A Guide Button is the button with the arrow icon next to each Worksheet entry field. Pressing the Guide But-ton activates an “Input Guide” dialog box containing a help browser pane and input assistance. For continuous variables, the dialog facilitates entry of a large number of inputs by specifying the minimum input value, maxi-mum input value, and increment value. For discrete variables the “Input Guide” dialog box contains a list of all valid inputs from which the user may select zero or more values.
A Workspace is a complete subdirectory tree containing all required BehavePlus files plus any additional Work-sheet, Run, Fuel Model, Moisture Scenario, Units Set, or capture files saved by the user. A Workspace corre-sponds to a single BehavePlus project, and each BehavePlus project should have its own Workspace.
Workspaces are created by the File > Workspaces > New workspace and the Files > Workspaces > Clone current workspace commands.
2.6. Menus and Toolbar
The more common operations, such as Module Selection or Calculate, may also be invoked from Toolbar but-tons. Toolbar buttons and their equivalent Menu commands are shown below:
Toolbar
Buttons Definitions Equivalent menu operation Open a new Worksheet
File > New
Open a saved Run
File > Open Run
Print this RunFile > Print
Module selection
Configure > Module selection
Calculate this RunFile > Calculate
Display first page
Pages >
then select page # Display last pagePages >
then select page # Display previous pagePages >
then select page # Display next pagePages >
then select page # Access User’s GuideHelp > Program help
USDA Forest Service General Technical Report RMRS-GTR-106WWW. 2005 15
3. Worksheets
A Worksheet is a form on which you enter input. Worksheets vary in appearance and content in response to the current module configuration: a
SURFACE module configuration requires different inputs than a SPOT module configuration.
Module selection, input options, and output variable selections determine BehavePlus configuration, which in turn defines the Worksheet appearance and content.
BehavePlus starts with the BasicStart.bpw example Worksheet. This gives the option of doing a quick basic fire behavior Run without having to load or configure a Worksheet.
3.1. Worksheet layout
A BehavePlus Worksheet is more than just an input form; it is the primary source of documentation about the Run. Worksheets include the following sections:
Header - The Worksheet header shows the BehavePlus version number, useful for reporting bugs and deter-mining if you have the most recent update. The header also includes the date and time of the last calculation and the page number, which lets you collate the correct pages after printing and spreading them out for further study.
Border - The line surrounding the Worksheet body may be modified with the
Configure > Appearance >
Worksheet
tab.Tabs - Zero, one, or more page tabs with labels along the right-hand margin of the Worksheet may be activated with the
Configure > Appearance > Page Tabs
tab.Documentation - This section lists all the currently selected modules and contains an entry field for the Run description. Additional documentation entry fields for training or fire projection applications are optionally acti-vated on the
Configure > Appearance > Worksheet
tab.Input - This section contains the required input data entry fields identified by a short phrase and their units of measure. Each entry text box also has a Guide button that may be pressed for input assistance. Entry text boxes are grouped under headings such as "Fuel/Vegetation, Surface/Understory", "Fuel/Vegetation, Overstory", "Fuel Moisture", "Weather", "Terrain", and “Fire”.
Acceptable Fire Conditions - Used to enter ranges of acceptable fire behavior when using the table shading option. Table shading is enabled by selecting the
Configure > Table shading for acceptable fire
condi-tions
check box.Run Option Notes - This section documents some of the configuration settings that are selected for the Work-sheet.
Output Variables - This section lists all the selected output variables and their units of measure. This section may be toggled on/off in the
Configure > Appearance > Worksheet
tab.Notes - This section permits the user to enter free-field expository text. The user has control of the size of this section or whether it is displayed using the
Configure > Appearance > Worksheet
tab.3.2. Example Worksheets
A number of predefined example Worksheets are included with the BehavePlus installation in the
Example-Worksheets
folder. Descriptions of the example Worksheets are described in Appendix D. You may use these Worksheets as provided, or use them as starting points for your own configuration. Use theFile > New
com-mand to open an example Worksheet and proceed to change your module selection, input options, and/or out-put variables as needed. Once BehavePlus is configured the way you want, you may name and save it as a new Worksheet. During subsequent BehavePlus sessions you may load your custom Worksheet and BehavePlus is configured as expected.Shown below is the SurfaceBasicFrom.bpw example Worksheet:
3.3. Worksheet Sections
3.3.1. Page Header
The header of each page includes the version number of the BehavePlus program and the page number. Once a Run is calculated the date and time of the calculation is added. The date and time and page number can be used to correctly collate printed documents.
3.3.2. Documentation
BehavePlus v3.0 User’s Guide DRAFT Worksheets
USDA Forest Service General Technical Report RMRS-GTR-106WWW. 2005 17
Additional documentation lines can be added by selecting the
Fire projection
docu-mentation
and/orTraining documentation
check boxes from theConfigure >
Appearance > Worksheet
tab.Selecting the
Fire projection documentation
check box adds the following input fields to the Worksheet:Selecting the
Training documentation
check box adds the following input fields to the Worksheet:Both options can be selected at the same time. 3.3.3. Input section
The required input variables and their units are displayed next to their text boxes. Fuel moisture variables that are not required have the text box shaded. In the example below, only 1-h fuel moisture is required for fuel model 1, because the other fuel categories are not included in the fuel model.
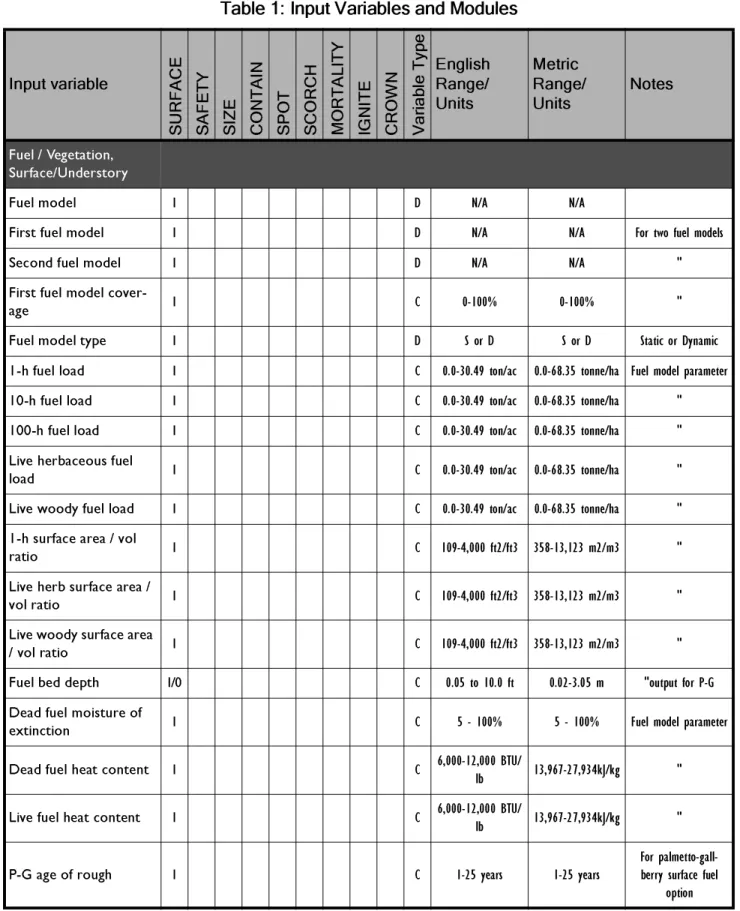
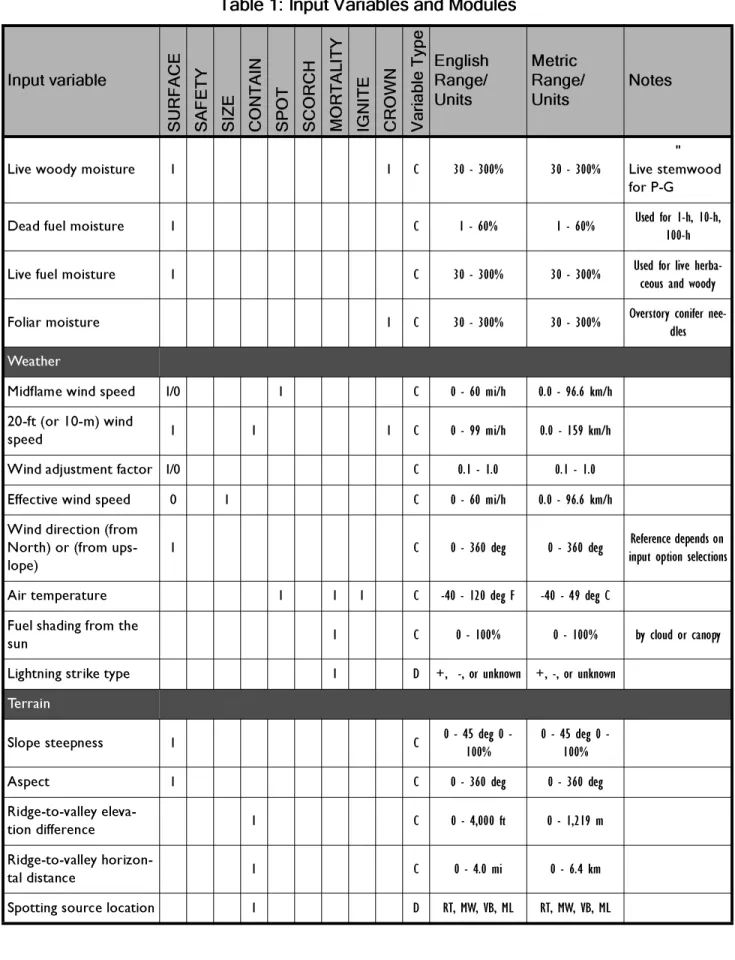
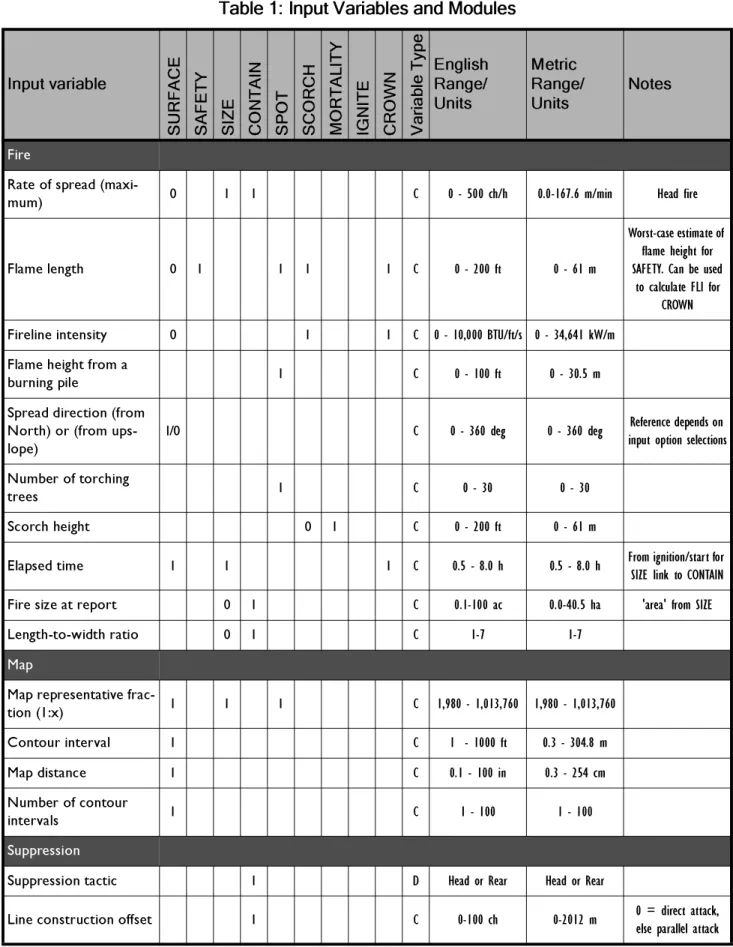
The Guide button for each input variable provides access to definitions and input assistance. Input variables are organized by logical association (rather than by calculation module). A table of all possible input variables by category is given in Appendix B.
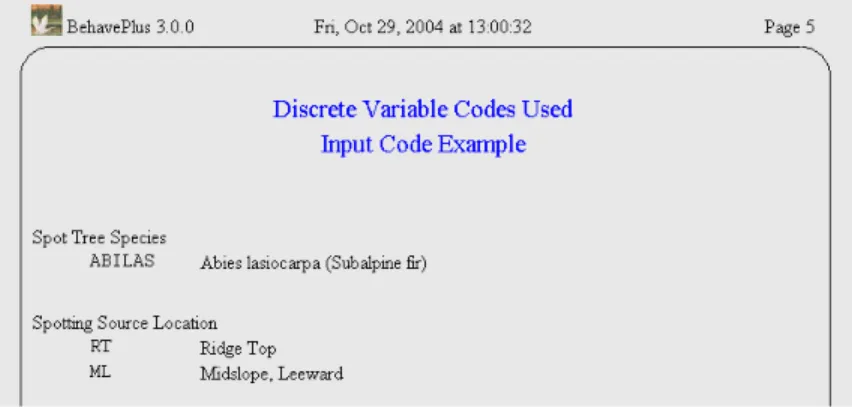
3.3.4. Input codes
The definition of discrete variable input codes can be displayed by selecting two options on the Configure > Appearance > Worksheet tab. Selecting the Show description for all discrete variable codes check box displays the
codes on the Worksheet beneath the variable. The Show descriptions only for entered discrete variable codes check box displays the codes used in
the Run on a separate output page when selected.
For example, on the SPOT module with the Show descriptions for all discrete variable codes check
BehavePlus v3.0 User’s Guide DRAFT Worksheets
USDA Forest Service General Technical Report RMRS-GTR-106WWW. 2005 19
With the Show descriptions only for entered discrete variable codes check box selected a page is
generated at the end of outputs listing the codes and descriptions used in the Run.
3.3.5. Acceptable Fire Conditions
This section is displayed on the Worksheet when the Table shading for acceptable fire conditions
check box in the “Module Selection” dialog box is selected.
Acceptable Fire Conditions are fully explained in Chapter 7, Table Shading. 3.3.6. Run Option Notes
For clarification, Run options are given after the input variables. The user does not have the option of suppress-ing this information. The module ussuppress-ing the option is also listed in brackets.
3.3.7. Output variables
Selected output variables and their units can be displayed at the end of the input Worksheet using the Configure > Appearance > Worksheet
tab. The module calculating the output variable is also listed in brackets. For example:
3.3.8. Notes
The Notes section of the Worksheet allows the user to enter a large amount of text associated with a Run. The user has the option of changing the number of lines provided for notes or even eliminating the notes section on the Configure > Appearance > Worksheet tab with the Show notes section check box and the Notes Lines spin box.
3.3.9. Borders
The border color and thickness on the Worksheet and output pages can be changed on the Configure > Appearance > Application tab using the Border Color drop-down list and the Border Width spin box. The
bor-der can be eliminated by entering a Border Width of 0.
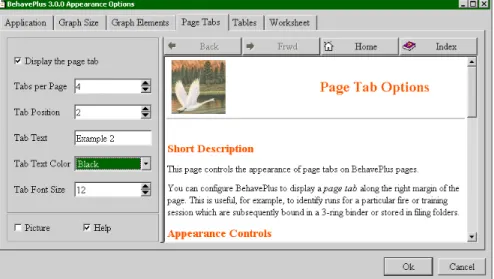
3.3.10. Page Tabs
Page tabs can be displayed along the right margin of the page. This is useful, for example, to identify Runs for a particular fire or training session that are subsequently bound in a three-ring binder or stored in filing folders. Page tabs can be added and defined with the Configure > Appearance > Page Tabs tab.
Tabs per page - The size of the tab depends upon the value selected in this spin box. Only one tab is actually played per page. If tabs per page is 4, the displayed tab occupies one-fourth the page height. If it is 10, the dis-played tab occupies one-tenth the page height. As this number increases, the disdis-played tab size decreases. Tab position - Determines the position of the displayed tab. Tab position 1 is always at the upper edge of the right margin.
Tab text - The text to appear on the tab. The text is centered within the tab and will therefore be truncated at both ends if it is too long.
BehavePlus v3.0 User’s Guide DRAFT Worksheets
USDA Forest Service General Technical Report RMRS-GTR-106WWW. 2005 21
The above settings create the tab on the Worksheet below:
3.4. Loading a previously saved Worksheet A previously saved Worksheet can be loaded using
• the File > New command,
• or the toolbar button.
To see the Worksheets in the folder click on the button to the left of the folder. To select a Worksheet either
• double click on it,
• or select and click the OK button.
A set of Worksheets is supplied with the program in the "ExampleWorksheets" folder. A short description is given for each. See Appendix D for further description of the "ExampleWorksheets".
3.5. The 0Startup Worksheet
The 0Startup.bpw Worksheet is a special case. It is used as the starting place for selecting calculation modules. It shows no input or output variables, but it sets defaults for all Run settings as described in Appendix C. The 0Startup.bpw Worksheet was used to initialize all of the example Worksheets.
A Worksheet can be designed to meet specific needs by starting with the 0Startup.bpw Example Worksheet, selecting the desired modules, and changing options as needed. The startup Worksheet is named 0Startup.bpw to assure that it is the first selection of the Example Worksheets folder.
3.6. Changing a Worksheet
A Worksheet can be changed at any time by changing the selected modules and associated options. The changes are in effect only for the current session unless the revised Worksheet is saved. If a Worksheet that came with the program in the ExampleWorksheets folder is changed, the revised version must be saved in another Work-sheet folder.
3.7. Saving a Worksheet or a Run
A Worksheet can be saved for later use with the File > saveAs > Worksheet command. The values entered
onto the Worksheet are not saved.
Save the Run, which is just a Worksheet with the defined input values, with the File > saveAs > Run
com-mand.
USDA Forest Service General Technical Report RMRS-GTR-106WWW. 2005 23
4. Modules
Modules define a set of fire models for a Worksheet. Selection can be made with the Configure > Module command.
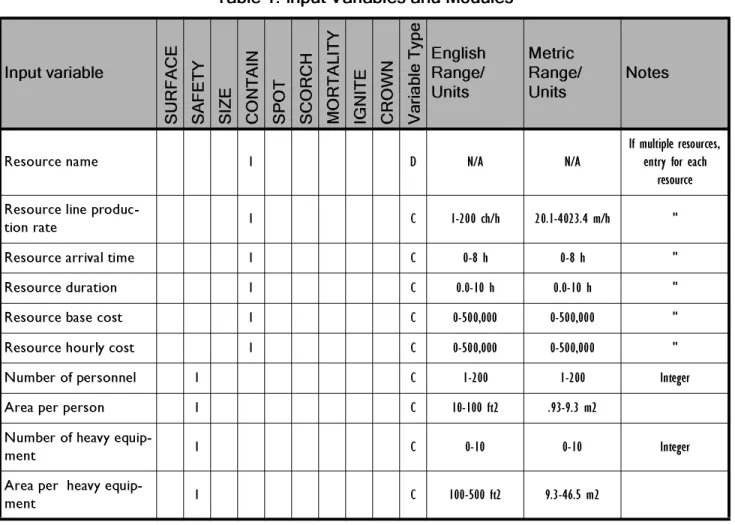
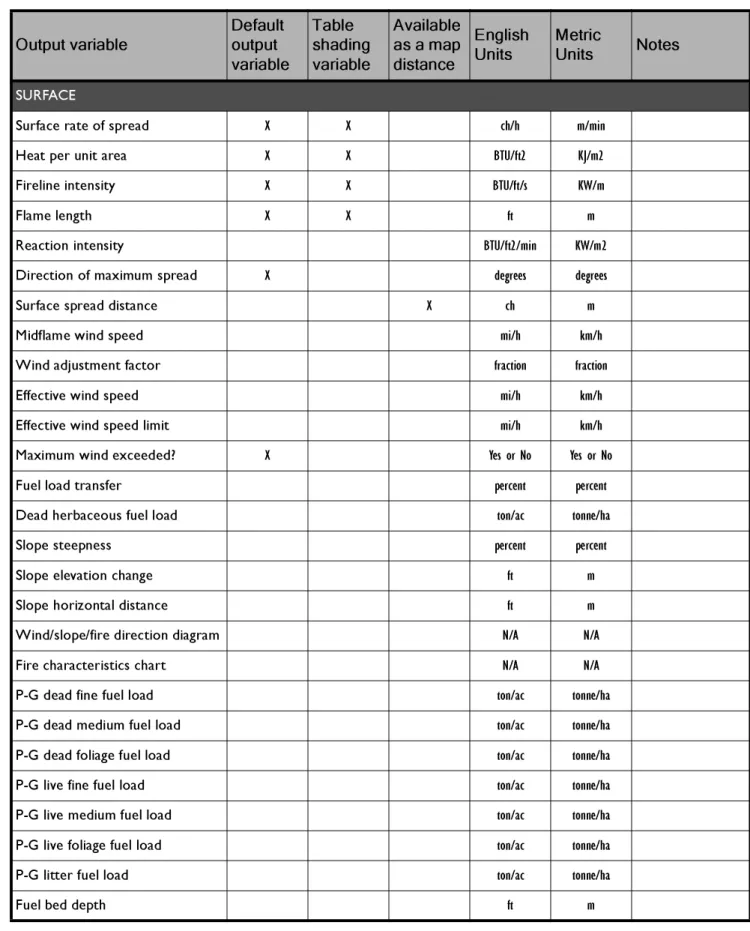
The output variables that can be calculated by each module are given in Table 2 of Appendix B.
Indentation indicates that the modules can be linked, which means that output from one module is used as input to the other. For example, if both SURFACE and SAFETY are selected, the modules are linked. Output from SURFACE is used as input to SAFETY. If only SAFETY is selected, all required input is entered by the user. A table of input variables and associated modules is given in Table 1 of Appendix B.
Selection of modules, options, and output variables determines the required input variables on the Worksheet. The Options… button is used to configure a module’s input options or change the output variables calculated.
4.1. Input options
Some modules offer options on alternate ways of specifying input. Others do not. For example, clicking the MORTALITY Options… button displays the "Mortality Module Options" dialog box with the Bark thick-ness is input option:
The bark thickness option affects the input variables included on the Worksheet. If
Bark thickness is
spec-ified on the worksheet
is selected, the resulting Worksheet is as follows:If
Bark thickness is estimated from species and d.b.h.
is selected, the Worksheet is as follows:BehavePlus v3.0 User’s Guide DRAFT Modules
USDA Forest Service General Technical Report RMRS-GTR-106WWW. 2005 25
Pause the mouse over the name of an output variable to see its description in the browser pane. For example, a pause over
Spotting Distance from a Wind
Driven Surface Fire
in the SPOTOutput
Vari-ables
tab results in this browser pane.USDA Forest Service General Technical Report RMRS-GTR-106WWW. 2005 27
5. Entering input
There are several ways to input to the BehavePlus program. Values can be typed directly into the input field, choices can be made from a list of valid input values, a range of values can be specified, and for some variables, selecting from a list of common choices.
5.1. Shaded text boxes
In some cases, input variables depend on values entered elsewhere on the Worksheet. When an input variable is not required, its text box is shaded. If a value is entered for a shaded text box, it is not used.
5.2. Direct entry
Values can be typed directly into the variable text boxes and the
Enter
orTab
keys moves the cursor to the next field. The cursor can also be moved to any text box with a mouse click. More than one value can be entered for an input variable. Multiple values are separated by a space or comma delimiter. You do not need to always specify equal steps. You can enter several independent values separated by delimiters.For table output a separate row and/or column will be created for each value from the input variable text box. For graphs of continuous input variables the curve is drawn between the smallest and largest value entered. Graphs of discrete variables will display a separate bar for each input value. See chapter 6, Table output, for more on how multiple values affect outputs.
5.3. Input Guide
The “Input Guide” dialog box is opened by clicking the Guide button to the left of each input variable text box.
5.3.1. Continuous variables
Valid input ranges can be viewed in the “Input Guide” dialog box.
Single values are entered in just the
From
text box and a second value can be entered in theThru
text box.For continuous variables the “Input Guide” dialog box allows definition of a range of values by a constant increment. For example, midflame wind speed from 0 to 20 mi/h in steps of 5 enters 0, 5, 10, 15, 20 on the Worksheet as shown below.
You can also enter a decreasing range with a negative step. This is useful when you have two input variables, such as wind and fuel moisture, that have opposite effect on fire behavior
5.3.2. Discrete variables
When the Guide button is clicked for a discrete variable, the allowed selections are given in the center pane of the “Input Guide” dialog box.
Clicking the values selects them; you can select several values. This example shows the fuel model "Input Guide" dialog box. The Ok button enters the selected fuel models on the Worksheet.
5.3.3. Choices button
Although any value in the valid range can be entered for a continuous variable, in some cases common values can be entered with the Choices button.
BehavePlus v3.0 User’s Guide DRAFT Entering input
USDA Forest Service General Technical Report RMRS-GTR-106WWW. 2005 29
After selecting values in the “Slope Steepness” dialog box, clicking
Ok
enters them on the Worksheet.5.4. Linked input variables
When using the CONTAIN module, with the
multiple resources
input option selected some, input vari-ables are directly associated with each other (an exception to the general BehavePlus rule). For example, a line production rate, arrival time, and duration are assigned to each resource. Linked input variables also allow you to enter multiple values for more than two input variables. In the following example, although multiple values are assigned to several input variables, those variables are linked together, so only a single calculation is done.USDA Forest Service General Technical Report RMRS-GTR-106WWW.2005 31
6. Table output
When more than one value is assigned to one or two input variables, table output is produced. Tables are produced by selecting the Display table results check box in the "Calculate Results" dialog box that displays after
selecting a File > Calculate command.
6.1. Single value calculation
When each variable is assigned only one value, a simple list of output is given. No table or graph is possible. For example:
6.2. Table output
When more than one value is assigned to a variable, table output is produced. Each output variable is a specified column. For example, these multiple Rate of Spread inputs produce the page 2 table below:
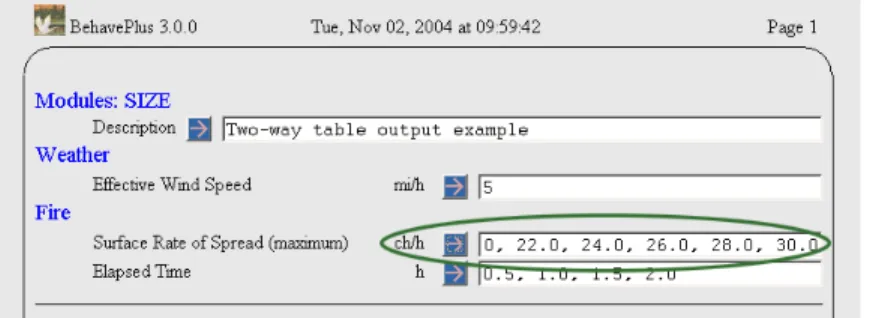
6.3. Two way tables
When more than one value is assigned to two variables, a two way table is produced. A table is produced for each selected output variable. Either variable can be specified as the row variable in the "Calculate Results" dia-log box.
For example, with the above inputs this dialog box appears when you Calculate the Run.
After selecting the Rate of Spread (maximum) option button and clicking the Ok button, the following tables are produced:
BehavePlus v3.0 User’s Guide DRAFT Table output
USDA Forest Service General Technical Report RMRS-GTR-106WWW. 2005 33
Changing the Table Row Variable to the
Elapsed Time
option button swaps the table columns and rows produces the following tables:6.4. Table appearance
Table row shading can be enabled with the Configure > Appearance > Tables tab.
Selecting the Shade alternate table rows check box causes all output tables to
have alternating rows shaded with a background color. This may improve the readabil-ity of wide tables. If the check box is cleared, tables are displayed without any row background color.
The table row background color is selected from the Shade drop-down list.
This table appearance option is used to improve table readability, don’t confuse it with the Table shading for acceptable fire conditions output option. See
chapter 7, Table shading, for more information.
6.5. Multiple pages
There is essentially no limit on the number of values that can be assigned to an input variable. But the resulting table might not fit on a single page. For example, if rate of spread is calculated for values from 2 to 30 in steps of 2, and elapsed time is specified as the row variable, the table overlaps onto 3 pages.
The > or < symbols lined to the right and/or left of the table heading indicates that there are additional results for those variables in the indicated direction.
BehavePlus v3.0 User’s Guide DRAFT Table output
USDA Forest Service General Technical Report RMRS-GTR-106WWW. 2005 35
The box diagram at the upper left of the pages shows the relative position of the currently viewed page in the multi-page table.
In this example, however, it would make more sense to specify rate of spread as the row variable since it pro-duces a table that fits on a single page as shown below:
USDA Forest Service General Technical Report RMRS-GTR-106WWW. 2003 37
7. Table Shading
Table shading for acceptable fire conditions is designed to display the condi-tions that contribute to acceptable fire behavior, such as in developing a
prescribed fire prescription. It replaces the RXWINDOW program of the old BEHAVE system. RXWINDOW attempted to reverse the calculations to determine conditions that corresponded to specified fire conditions. As additional fire models have become available, this approach is unfeasible. The approach taken in BehavePlus is different from that in RXWINDOW.
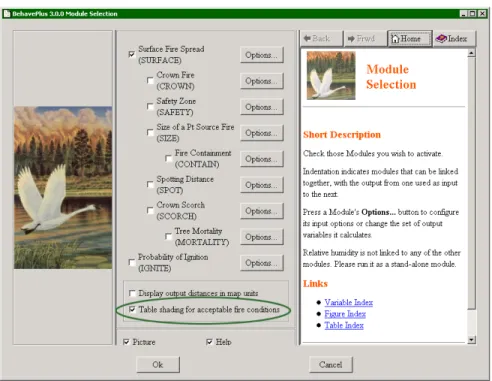
7.1. Activating the Table Shading Option
To implement the table shading option select the Table shading for acceptable fire conditions check
Once the Table shading for acceptable fire conditions check box is selected a new section, Accept-able Fire Conditions, appears on the Worksheet.
Notice that some of the output variables are listed in the Acceptable Fire Conditions section. Not all the
output variables are available to be constrained. The output variables that can be used to identify acceptable fire conditions are listed in Table 2 of Appendix B.
7.2. Entering Acceptable Fire Conditions
In the Acceptable Fire Conditions section each output variable listed has a check box and two text boxes
for entering the range of acceptable fire conditions. By default the check boxes are cleared. The ranges specified in the text boxes are only considered if the output variable check box is selected.
This allows you to view all the output variables you want while only using a subset to define your acceptable fire conditions. Of course if an output variable is of no interest then clear it from the Outputs tab for the
appro-BehavePlus v2.0 User’s Guide DRAFT Table Shading
USDA Forest Service General Technical Report RMRS-GTR-106WWW. 2003 39 After selecting the output variables to define acceptable fire conditions enter the acceptable ranges in the cor-responding text boxes.
If you decide to clear a check box in the Acceptable Fire Conditions section there is no need to zero out the range text boxes, any ranges are ignored if the check box is cleared.
7.3. Viewing Results
The output values are crossed out (shaded) except for those specified as acceptable on the Worksheet. The table outputs for all output variables are shaded, but only for the ranges selected on the Worksheet in the
Acceptable Fire Conditions section. For example,
on the Fireline Intensity table, the shaded values are the ones that are outside of the 3-5 ch/h surface rate of spread range.
If Fireline Intensity is also selected to define acceptable fire conditions all output tables will change.
BehavePlus v2.0 User’s Guide DRAFT Table Shading
USDA Forest Service General Technical Report RMRS-GTR-106WWW. 2003 41
Now acceptable output must meet both ranges of acceptable conditions which further constrains the fuel mois-ture and wind conditions that give desired results. Selecting two or more variables in the Acceptable Fire Conditions section can give very complex results that should be interpreted carefully.
USDA Forest Service General Technical Report RMRS-GTR-106WWW. 2005 43
8. Graph output
When more than one value is entered for one or two input variables, graphs can be produced. Graphs are viewed by selecting the
Display
Graph Results
check box in the "Calculate Results" dialog box thatdis-plays after Calculate is requested. The form of the graph depends on whether the variables are continuous or discrete. The program automatically takes care of the differences for the user.
8.1. Single variable graph
When a range of values is entered for a single continuous variable, a graph is produced by calculating a fixed number of points (which can be changed in the
Configure > Appearance > Graph Elements
tab) over the entered range. Intermediate values entered on the Worksheet are ignored. For example, rate of spread entry of 5, 7, 9, 11, 13, 15 produces the same graph as rate of spread entry of 5, 15:When a range of values is assigned to a discrete variable, a single calculation is performed for each value and a bar graph is produced. For example, the following is a comparison of surface fire spread rates for the standard 13 fire behavior fuel models:
8.2. Two variable graph
When a range of values is assigned to two variables, a graph is produced. If both variables are continuous, the variable used for the X-axis can be selected from the "Calculate Results" dialog box. For example:
BehavePlus v3.0 User’s Guide DRAFT Graph output
USDA Forest Service General Technical Report RMRS-GTR-106WWW. 2005 45 In the "Calculate Results" dialog box clear the
Display table results
check box and accept the defaults in theDisplay graph results
section:Changing the
X-Axis Variable
to theMidflame Wind Speed (upslope)
in the "Calculate Results" dialog box produces a very different graph:If a range is assigned to two variables, one continuous and one discrete, the continuous variable is always on the X-axis. For example:
With two variables, one continuous and one discrete, you no longer have the option of changing the X-Axis Variable in the "Calculate Results" dialog
box.
A graph is not possible when ranges are selected for two discrete variables. 8.3. Axis scales
BehavePlus v3.0 User’s Guide DRAFT Graph output
USDA Forest Service General Technical Report RMRS-GTR-106WWW. 2005 47
X Axis Origin and Y Axis Origin (minimum values) can be set for each as either zero or as the variable's
minimum value as specified on the input Worksheet. The graph origin is set to (0,0) as the default. For example, consider the following Run:
Options to define the origin of the graph are set through the Configure > Appearance > Graph Size tab.
Setting both the X Axis Origin and Y Axis Origin to zero produces the
In the Configure > Appearance > Graph Size tab select Min Value from the X-Axis Origin drop-down list to alter the graph appearance.
8.3.2. Y-axis
The Y-axis scale normally differs between graphs produced by a Run since each graph is for a different output variable. For example, fireline intensity and flame length have different ranges of output and require a different Y-axis scale. By default the Y-axis is scaled to the maximum calculated output value for the variable to make best use of the graph area.
When you want to compare graphs between Runs, different Y-axis scales can obfuscate the comparison. A rate of spread graph for fuel model 10, for example, usually has a narrower output range than for fuel model 5 under the same conditions. To better compare calculated rate of spread graphs for the two fuel models, you can set both graphs to have the same Y-axis scale.
BehavePlus v3.0 User’s Guide DRAFT Graph output
USDA Forest Service General Technical Report RMRS-GTR-106WWW. 2005 49
The following Run is for fuel model 10, which has relatively low rates of spread.
With the
X Axis Origin
andY Axis Origin
set to zero, the rate of spread graph below is produced:To compare the results for fuel model 10 with the faster spreading fuel model 5, the scale for the fuel model 10 Run is changed to match that produced by model 5. The calculated maximums are given for each of the selected output variables as a reference.
In the "Calculate Results" dialog box select the
Specify graph Y axis limits
check box if you wish to modify the Y-axis ranges of the output graphs before they are displayed.This displays the "Graph Limits" dialog box, where you can change the Y-axis maximum for the variable
Rate of
Spread (maximum)
to 40:The comparison with the corresponding graph for fuel model 5 is now more straightforward now that the axis are the same.
BehavePlus v3.0 User’s Guide DRAFT Graph output
USDA Forest Service General Technical Report RMRS-GTR-106WWW. 2005 51
8.4. Graph appearance
The appearance of the graph can be changed through the
Configure > Appearance > Graph Size
andConfigure > Appearance > Graph Elements
tabs.8.4.1. Graph Size
The vertical graph height on the page is set with the
Graph Size(%)
spin box on theConfigure > Appearance > Graph Size
tab.Graphs are drawn starting at the upper left corner of the page and may occupy 25% to 100% of the page height. The default is 50%, as shown in the following graph.
BehavePlus v3.0 User’s Guide DRAFT Graph output
USDA Forest Service General Technical Report RMRS-GTR-106WWW. 2005 53
8.4.2. Graph Title
The graph title content is controlled using the Graph Title drop-down list on the Configure > Appearance > Graph Size tab.
Selecting Short from the Graph Title drop-down list displays just the contents of
the Worksheet Description text box as the title. Selecting Long displays the Description text box and the graph variables.
Using the above Run a graph with a short title (the default) looks like the following.
Selecting Long from the Graph Title drop-down list on the Configure > Appearance > Graph Size tab adds more information to the title.
BehavePlus v3.0 User’s Guide DRAFT Graph output
USDA Forest Service General Technical Report RMRS-GTR-106WWW. 2005 55
8.4.3. Graph colors
Graph colors can be changed with the
Configure > Appearance > Graph Elements
tab.Colors are selected from the predefined drop-down lists. Background is the background color of the graph.
Rainbow Colors sets the number of colors used to display graph lines or bars when
Rainbow Colors
is selected as the curve color. With three rainbow colors, the colors are red, green, and blue. If 4 colors are requested, four equally spaced hues from the color spectrum are used to display each graph line or bar in turn. Bar Color is used to fill graph bars. SelectingRainbow Colors
fills each bar with its own color. The number of rainbow colors is set by theRainbow Colors
spin box discussed above.Curve Color is used to draw graph lines. Selecting
Rainbow Colors
draws each line with its own color. The number of rainbow colors is set by theRainbow Colors
spin box discussed above.Axis Color is used to draw graph axis lines, tic marks, and axis labels. Gridline Color is for the graph grid lines. The default is yellow.
Changing
Rainbow Colors
to 10 results in the following graph coloring:8.4.4. Line widths
Line widths can be changed using the
Curve Width
,Axis Width
, andGrid-line Width
spin boxes on theConfigure > Appearance > Graph
Ele-ments
tab.Curve Width sets the width of graph lines. 0 is the thinnest and 9 thickest. Axis Width sets the width of axis lines drawn on the graph. 1 is thinnest and 9 thickest.
Gridline Width sets the width of grid lines drawn on the graph. 1 is thinnest and 9 thickest. To prevent the display of any grid lines set
Gridline Width
to 0.BehavePlus v3.0 User’s Guide DRAFT Graph output
USDA Forest Service General Technical Report RMRS-GTR-106WWW. 2005 57
The following graph uses the default line settings.
8.5. Number of curve points
The resolution of the curves can be changed with the
Curve Points
spin box on theConfigure > Appearance > Graph Elements
tab.The
Curve Points
spin box determines the number of points calculated for each curve in the graph. A straight-line segment is drawn between each pair of points. The default of 20 is visually adequate for most graphs. Requesting more points usually results in a marginal improvement in the visual appearance and requires more computation time. In cases where many curves are plotted and the calculation time is slow, reducing the number of curve points will speed things up.Changing
Curve Points
from the default of 20 to 5 results in the following graph:Compare with the graph in the previous Line widths section. The fewer line points give the curves a more jagged appearance.
USDA Forest Service General Technical Report RMRS-GTR-106WWW. 2005 59
9. Diagram output
In addition to the usual table and graph output, BehavePlus produces dia-grams for the following output variables.
• Wind/slope/fire spread direction diagrams from the SURFACE module • Fire characteristics chart from the SURFACE module
• Shape of a point source fire from the SIZE module
• Shape of a fire after suppression action from the CONTAIN module
Diagram output is selected from the lists on the
Configure > Module selection > (module name) >
Options… > Outputs
tab for the corresponding module.9.1. Wind/slope/spread direction
Direction diagrams can help the user avoid confusion on directions for wind, slope, and spread directions. Direction input options are selected on the
Configure > Module selection > SURFACE > Options… >
Directions
tab.Direction diagrams are produced with the
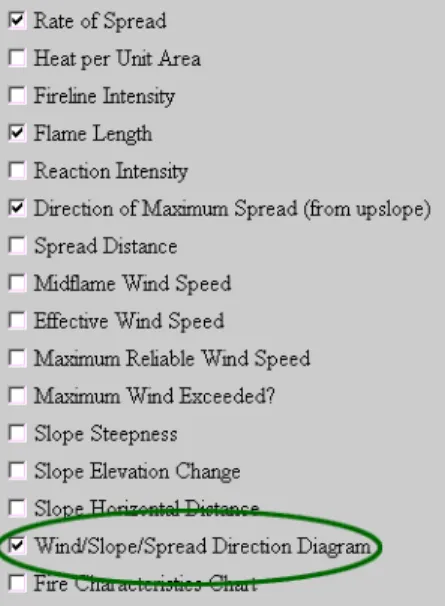
Configure > Module selection > SURFACE > Options… >
Outputs
tab and selecting theWind/Slope/Spread Direction Diagram
check box.The diagrams differ according to the direction Input Options selected from the
Configure > Module
selec-tion > SURFACE > Opselec-tions… > Direcselec-tions
tab. The following shows the Input Option selection, the resulting Worksheet, the outputs table and diagrams.BehavePlus v3.0 User’s Guide DRAFT Diagram output
USDA Forest Service General Technical Report RMRS-GTR-106WWW. 2005 61 The following illustrates the effect of selecting the Wind & spread directions are radio button on the vari-ables that are requested on the Worksheet.
BehavePlus v3.0 User’s Guide DRAFT Diagram output
USDA Forest Service General Technical Report RMRS-GTR-106WWW. 2005 63
9.2. Fire characteristics chart
A fire characteristics chart diagram plots the relationship of rate of spread, heat per unit area, flame length, and fireline intensity. This option is a simplified plot and does not offer the user any display options. Axis scales are set automatically and points are labeled with simple numbers. In the future, BehavePlus will provide a Fire Char-acteristics Tool so that the user can customize it for a specific need.
Fire characteristics charts are produced with the Configure > Module selection > SURFACE > Options… > Outputs tab and selecting the Fire Characteristics Chart check box.
It is not necessary to select the four output variables that are plotted on the chart.
BehavePlus v3.0 User’s Guide DRAFT Diagram output
USDA Forest Service General Technical Report RMRS-GTR-106WWW. 2005 65
The points labeled 1, 2, and 3 correspond to the three lines of the output table. Point 1 is for fuel model 2, point 2 for fuel model 5, and point 3 for fuel model 10.
The numbers on the chart correspond to the table cells in left-to-right and top-to-bottom order. In this exam-ple, Points 1 and 2 are for the first row of the result table (3% moisture) at the two wind speeds (7 and 10 mi/ h). Points 3 and 4 are for the second row of the result table (6% moisture) at the two wind speeds. Points 5 and 6 are for the third row of the result table (9% moisture) at the two wind speeds.
9.3. Shape of a point source fire
The elliptical shape of a point source fire can be plotted on the
Configure > Module
selection > SIZE > Options … > Output Variables
tab by selecting theFire
Shape Diagram
check box.BehavePlus v3.0 User’s Guide DRAFT Diagram output
USDA Forest Service General Technical Report RMRS-GTR-106WWW. 2005 67
In addition to the shape diagrams, values for all of the selected output variables are given on each diagram. A word of caution when using the SIZE module by itself as shown by the above example. The above diagram could be wrongly interpreted to show that higher wind speeds result in a smaller fire. But remember the sur-face rate of spread (10 ch/h) was the same for o and 6 m.p.h. winds, which is not realistic if all other fire envi-ronment conditions were the same. In this example the wind speed only determines the shape of a fire for a given forward spread distance.
BehavePlus v3.0 User’s Guide DRAFT Diagram output
USDA Forest Service General Technical Report RMRS-GTR-106WWW. 2005 69
9.4. Containment shape
The Containment Diagram shows fire perimeter at time of report, at initial attack, and constructed fireline at the time the fire was successfully contained or when it escaped initial attack (all resources exhausted before containment).
The Containment Diagram is displayed by selecting the
Containment Diagram
check box from theConfigure > Module selection > CONTAIN > Options …
> Output Variables
tab. Also select theContain Status
check box to output whether the fire was Contained or Escaped on the Containment Diagram.USDA Forest Service General Technical Report RMRS-GTR-106WWW. 2005 71
10. View, print, & capture results
10.1. View size
The View > xx% command changes the size of your Worksheet
and Run when viewed on screen. It does not affect the size of printed output.
10.2. Pages
While each Run has its own window, the window has one or more Pages. The first page(s) contain the Work-sheet, and subsequent pages contain results tables, graphs, and diagrams.
You can navigate between pages using the following toolbar buttons: Go to the first page
Go to the last page Go to the previous page Go to the next page
The keyboard navigation arrows will also move you from one page to the next. The Pages > command allows
you to jump directly to a specific page.
10.3. Windows
When a Worksheet is first opened, the Run it represents is assigned a default name such as "unnamed01.bpr", "unnamed02.bpr", etc. This name is displayed on the title bar at the top of the BehavePlus applica-tion window.
When you save a Run with the File > saveAs > Run command you should rename the Run. The name of the
Run is then displayed in the title bar of the BehavePlus window. The complete path name for the Run is shown at the bottom of the BehavePlus application window.
BehavePlus allows you to have any number of Runs open at once. Each Run has its own display window containing a Work-sheet and possibly containing calculation results. Only one Run window is active at a time. The Windows menu item allows you to switch between Runs. It also allows you to cascade or tile the Runs within the BehavePlus window area with the
Windows > Cascade or Windows > TIle commands. By
default the Run windows are stacked on top of each other, so you only see the active Run. If your Run windows are already cascaded or tiled, you can make a Run active by clicking it.
The following is a "tiled" display of the two Runs, one English, one metric. The English Run (unnamed01.bpr) is the active Run.
Selection can be made from the list of pages with text descriptions and an icon indicating whether it is a table, graph, diagram, etc.
10.4. Print