M E T H O D
Open Access
CGAL: computing genome assembly likelihoods
Atif Rahman
1and Lior Pachter
1,2*Abstract
Assembly algorithms have been extensively benchmarked using simulated data so that results can be compared to ground truth. However, inde novoassembly, only crude metrics such as contig number and size are typically used to evaluate assembly quality. We present CGAL, a novel likelihood-based approach to assembly assessment in the absence of a ground truth. We show that likelihood is more accurate than other metrics currently used for
evaluating assemblies, and describe its application to the optimization and comparison of assembly algorithms. Our methods are implemented in software that is freely available at http://bio.math.berkeley.edu/cgal/.
Keywords:Genome assembly, evaluation, likelihood, sequencing.
Background
Genome assembly is the process of merging fragments of a DNA sequence produced by shotgun sequencing in order to reconstruct the original genome. The assembly problem is known to be NP hard for a number of for-mulations [1-3] and is also complicated by the many types of sequencing errors, experimental biases and the volume of data that must be processed. For these rea-sons, in addition to differences in underlying theory and algorithms, popular assembly methods employ many dif-ferent heuristics and assemblies produced by existing methods differ substantially from each other [4,5].
Paradoxically, the difficulties of sequence assembly have been compounded by sequencing advances in recent years collectively termed next-generation sequencing technolo-gies. Next-generation sequencing technologies such as 454 pyrosequencing by Applied Sciences [6], Solexa/Illumina sequencing, the SOLiD technology from Applied Biosys-tems and Helicos single-molecule sequencing [7] produce data of much greater volume at a much lower cost than traditional Sanger sequencing [8]. However, read lengths are considerably shorter and error rates are higher than those in Sanger sequencing. To allowde novosequencing from short reads from next-generation sequencing machines several assemblers have been developed such as Velvet [9], Euler-sr [10], ABySS [11], Edena [12], SSAKE [13], VCAKE [14], SHARCGS [15], ALLPATHS [16], SOAPdenovo [17], Celera WGA [18], the CLC bio
assembler and others [4,5]. A key problem that has arisen is to determine which assembler is‘the best’. In the past this has been done with the help of a number of measures such as N50 scaffold or contig lengths - which is the maxi-mum contig (scaffold) length such that at least half the total length is contained in contigs (scaffolds) of length greater than or equal to that length. Although simulation studies show that simple metrics correlate with assembly quality, the currently used metrics are crude and provide only condensed summaries of the result. They can there-fore be very misleading [5,19]. For example, the assembly consisting of simply gluing all reads end-to-end has a very large N50 length, but is obviously a poor assembly. Phil-lippyet al. presented software called amosvalidate [20] that identifies mis-assembly features and suspicious regions; however, it does not have high specificity and has not been widely adopted. Narzisi et al. used a feature-response curve [21] to rank assemblies based on features identified by amosvalidate. Studies such as [22-25] have discussed these issues and produce interesting insights into assembler performance but do not provide an intrin-sic direct measure of assembly quality. The recent Assem-blathon 1 competition used 10 different metrics [4] in an attempt to reveal more information than just N50 values, but most of the metrics can only be computed when the genome that is being assembled is known, and are there-fore not useful in practice on real data.
In this paper we present a computationally efficient approach for computing the likelihood of an assembly, which provides a way to assess assemblies without a ground truth. Intuitively, the likelihood assessment eval-uates the uniformity of coverage of the assembly, taking * Correspondence: [email protected]
1
Department of Electrical Engineering and Computer Sciences, 387 Soda Hall, UC Berkeley, Berkeley, CA 94720, USA
Full list of author information is available at the end of the article
into account errors in the reads, the insert size distribu-tion and the extent of unassembled data. Genome assembly by maximizing likelihood has been proposed previously by Myers [26] and Medvedev and Brudno [1] but their formulations are based on simplified models that do not use important parameters, especially the sequencing error. To demonstrate the power of our approach for assembly quality evaluation, we have implemented our methods in a program called CGAL. We have evaluated assemblies by testing several of them from different programs with varying input parameters in a setting where the desired target genome is known. For each assembly, we compute the likelihood using our tool and then compare our likelihood computation to standard measures such as N50 contig values, sequence similarity with the reference genome as well as values reported by amosvalidate. Although it is beyond the scope of this paper to compare all assemblers and explore all parameters, our results indicate that likeli-hood is meaningful and useful for evaluating assemblies.
Results
Our overall approach is simple: we describe a probabilistic generative model for sequencing that captures many aspects of sequencing experiments, and from which we can compute the likelihood of an assembly. This intuitive framework is, however, complicated by one major diffi-culty, which is the problem we address in this paper: to compute the likelihood of an assembly it is necessary, in principle, to consider the possibility that a read was pro-duced from every single location in the assembly. This results in an intractable computation, which we circum-vent by approximating the likelihood via a reduction to a small set of‘likely’sites from which each read originated (using a mapping of the reads to the assembly). This requires an examination of the quality of the approxima-tion, and leads to yet another difficulty, which is how to compute the likelihood for reads that do not map to the assembly at all. These issues are addressed in this paper and their solution is what enables our program for likeli-hood computation to be efficient and practical.
We begin by describing the statistical model that forms the basis for our likelihood computation. We believe that our model incorporates many aspects of typical sequen-cing experiments, but it can be easily generalized to accommodate additional parameters if desired.
A generative model for sequencing
Let R = {r1,r2,...,rN} be a set ofNpaired-end (PE) (or
mate pair) reads generated from a genome, G (our
model can, in principle, be adapted to single-end reads but we do not consider these here). We assume a frag-ment represented by two paired-end readsri= (ri1,ri2)
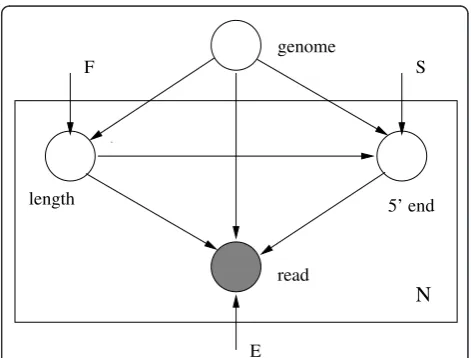
is generated according to the following model:
•A fragment lengthliis selected according to a dis-tributionF.
•A site for the 5’end of the fragmentsiis selected according to a distributionS.
•The ends of the fragment are read as ri1 and ri2
according to an error modelEwhich comprises mis-matches as well as indels.
The generative model is illustrated in Figure 1.
Computing likelihood
Computing the likelihood of an assembly means that the probability of the (observed) set of reads is computed with respect to a proposed assembly using the model described in the previous section. The probability of a sequence of lengthL generating a paired-end or mate pair read (termed‘read’from now on)riis
p(ri) = L
l=1 pF(l)
L−l+1
s=1
pS(s)
e∈E
pE(ri|as. . .as+l−1,e)
whereas...as+ l - 1is the assembly subsequence
start-ing at s of length l, E denotes all possible ways of obtainingrifromas... as+ l - 1.pF(l) is the probability
that the fragment length isl, pS(s) is the probability that the 5’end of the fragment is at sitesandpE(ri|as...as+
l - 1,e) is the probability of obtaining ri fromas...as+ l - 1with sequencing errors given bye.
Although in theory a read could have been generated from any site (assuming that every base could have been an error), in practice the probability decreases consider-ably with increasing number of disagreements between the source sequence and the read sequence. We
there-N
length 5’ end
read genome
F S
[image:2.595.304.540.503.682.2]E
fore approximate the probability p(ri) by mapping the read to the assembly and ignoring mappings with a large number of differences. IfMiis the number of such mappings of readri, the probability is given by
p(ri)≈ Mi
j=1
pF(li,j)pS(si,j)pE(ri|ai,j,ei,j)
where li, j, si, j, ai, j and ei, j are the fragment length, start site, assembly subsequence and errors correspond-ing to thejth mapping of the ith read, respectively. The above equation generalizes to assemblies with more than one contig. Given an assembly Aand a set of reads R = {r1,r2,...,rN}, the log likelihood is given by
l(A;R) = log N
i=1 p(ri|A)
≈ N
i=1 log
Mi
j=1
pF(li,j)pS(si,j)pE(ri|ai,j,ei,j).
In the above equation Mi ≥ 1 for all reads ri, and in Methods we explain how we obtain alignments for all reads and how to learn the needed distributions.
Validation with simulated data
To test our implementation, we developed a simulator that generates reads according to given error parameters and fragment lengths distributed according to a Gaus-sian distribution.
We generated 3 million 35 bp paired-end reads from a strain ofEscherichia coli([NCBI: NC_000913.2]) and an assembly ofGrosmannia clavigera ([DDBJ/EMBL/Gen-Bank: ACXQ00000000]) reported in [27]. Table 1 shows the percentage difference in likelihood values computed using true parameters provided to the simulator and using parameters inferred by CGAL.
Performance of assemblers onE. colireads
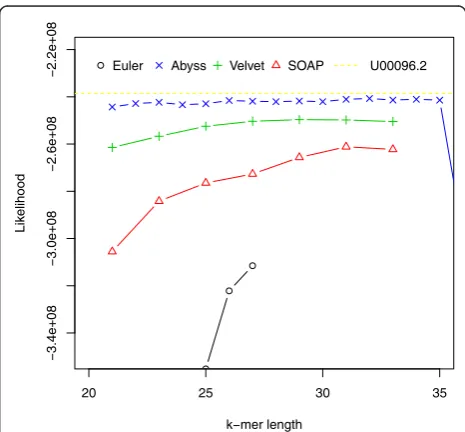
We assessed the performance of four assemblers: Velvet, Euler-sr, ABySS and SOAPdenovo on anEscherichia coli
dataset ([SRA:SRR 001665] and [SRA:SRR 001666]). We choseE. colibecause its assembly is a true‘gold standard’ without questions about reliability or accuracy. We assembled the reads using the assemblers mentioned for different hash lengths (k-mer was used for constructing
the de Bruijn graph [10]). Likelihood values for assem-blies along with the likelihood value for the reference ([NCBI: U00096.2]) are shown in Figure 2.
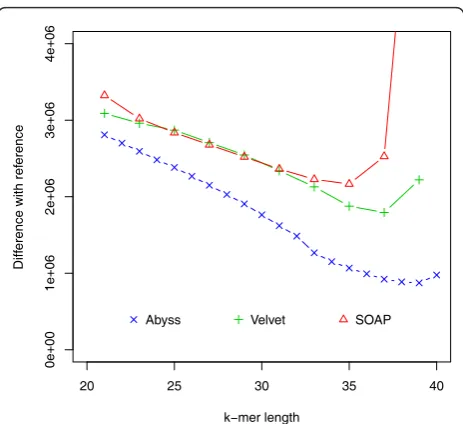
For this dataset ABySS outperforms the others when likelihood is used as the metric. We also aligned the assem-blies to the reference with NUCmer [28] and Figure 3 shows the differences from the reference against the hash lengths. The relations among likelihood, N50 length and similarity are illustrated in Figure 4 and Additional file 1, Figure S1. They suggest that likelihood values are better at capturing sequence similarity than other metrics com-monly used for evaluating assemblies, such as the N50 scaffold or contig lengths. We also ran the amosvalidate pipeline to obtain the numbers of mis-assembly of features and suspicious regions (Figure 5) and plotted the feature response curves (FRCs) [21] of the assemblies (Additional file 1, Figures S4, S5). The FRCs also rank an ABySS assembly as the best one.
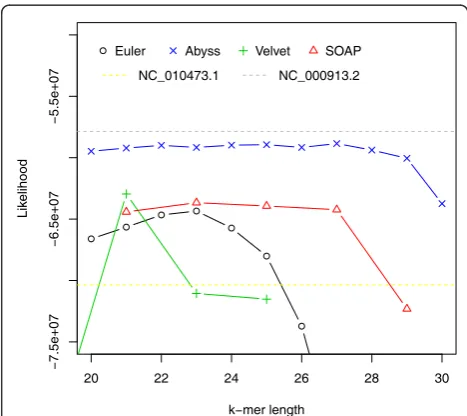
[image:3.595.305.538.455.671.2]A similar analysis was performed on a different Escheri-chia colidataset downloaded from CLC bio [29]. It con-sists of approximately 2.6 million 35 bp paired-end Illumina reads (approximately 40 times coverage) along with a reference genome ([NCBI: NC_010473.1]). We noticed that many of the assemblies have a better likeli-hood than the reference. However, we assembled reads that could not be mapped to the reference and after run-ning BLAST [30] we found another substrain of Escheri-chia colistrain K-12, MG1655 ([NCBI: NC_000913.2]), which has a better likelihood than all assemblies.
Table 1 Percentage difference between the simulator and CGAL
Genome Length (bp) Percentage difference
E. coli 4.6 M 0.074
G. clavigera 29.1 M 0.0755
bp, base pair.
20 25 30 35
Ŧ
3.4e+08
Ŧ
3.0e+08
Ŧ
2.6e+08
Ŧ
2.2e+08
kŦmer length
Lik
elihood
[image:3.595.55.292.682.722.2]Euler Abyss Velvet SOAP U00096.2
We conjecture that the reads were generated from NC_000913.2. Likelihood values are shown in Figure 6 and relationships among likelihood, similarity and N50 values are illustrated in Additional file 1, Figures S6-S10.
20 25 30 35
0
50000
100000
150000
200000
250000
kŦmer length
Diff
erence with ref
erence
Euler Abyss
[image:4.595.304.540.86.289.2]Velvet SOAP
Figure 3Hash length vs difference from reference forE. coli. The differences between assemblies and the reference are shown on they-axis where the difference refers to the numbers of bases in the reference not covered by the assembly or differ between the reference and the assembly.
Ŧ3.4e+08 Ŧ3.0e+08 Ŧ2.6e+08 Ŧ2.2e+08
0
50000
100000
150000
200000
Log likelihood
N50 scaff
old length
Euler Abyss Velvet SOAP
Figure 4Log likelihood vs N50 scaffold length forE. coli. Log likelihoods are shown on thex-axis and N50 scaffold lengths are shown on they-axis. Each circle corresponds to an assembly generated using an assembler for some hash length and the sizes of the circles correspond to similarity with reference. TheR2values are: (i) log likelihood vs similarity: 0.9372048, (ii) log likelihood vs N50 scaffold length: 0.44011, (iii) N50 scaffold length vs similarity: 0.3216882.
Ŧ3.4e+08 Ŧ3.0e+08 Ŧ2.6e+08 Ŧ2.2e+08
2000
3000
4000
5000
6000
7000
8000
Log likelihood
# mis
Ŧ
assemb
ly f
eatures
Log likelihood
# mis
Ŧ
assemb
ly f
eatures
0 50 100 150 200
# suspicious regions
Euler Abyss
Velvet SOAP
# features
[image:4.595.57.295.87.298.2]# regions
Figure 5Log likelihood vs numbers of mis-assembly features and suspicious regions forE. coli. Log likelihoods are shown on thex-axis and numbers of mis-assembly features and suspicious regions reported by amosvalidate are shown on they-axis. Each symbol corresponds to an assembly generated using an assembler for some hash length and the sizes of the symbols correspond to similarity with reference. TheR2values are: (i) log likelihood vs number of mis-assembly features: 0.8922, (ii) log likelihood vs number of suspicious regions: 0.9039, (iii) similarity vs number of mis-assembly features: 0.8211, (iv) similarity vs number of suspicious regions: 0.7723.
20 22 24 26 28 30
Ŧ
7.5e+07
Ŧ
6.5e+07
Ŧ
5.5e+07
kŦmer length
Lik
elihood
Euler Abyss Velvet SOAP
NC_010473.1 NC_000913.2
[image:4.595.57.294.439.642.2] [image:4.595.304.538.442.650.2]Performance of assemblers onG. clavigerareads
To assess assemblies of a larger genome, we used the dataset generated for sequencing an ascomycete fungus,
Grosmannia clavigeraby DiGuistini et al.[27]. We ran Velvet, ABySS and SOAP on PE Illumina reads with a mean fragment length of 200 bp [SRA:SRR 018008-11] and 700 bp [SRA:SRR 018012].
[image:5.595.306.538.86.298.2]The likelihood values of the 200 bp fragment reads for the assemblies are shown in Figure 7. It also shows likeli-hood values for assemblies [DDBJ/EMBL/GenBank: ACXQ00000000] and [DDBJ/EMBL/GenBank: ACYC000 00000] reported in [27], which were generated using San-ger and 454 reads as well as Illumina reads. The numbers of mis-assembly features and suspicious regions identified by amosvalidate and the feature response curves are shown in Additional file 1, Figures S14-S15.
Figure 8 shows that the assembly with most sequence coverage is produced by ABySS. However, in this case ABySS assemblies are much longer compared to other assemblies and references (Additional file 1, Tables S9-S11). This results in lower likelihoods compared to some assemblies by Velvet and SOAPdenovo. Figure 9 and Additional file 1, Figure S11 show relationships among likelihood, similarity and N50 values. In FRC analysis, gen-ome coverage is estimated using assembly length and so it does not take into account the unassembled sequences and ranks ABySS assemblies above others. It is interesting that assemblies with the best likelihood and sequence similarity are generated for higher values of hash length than are optimal for producing high N50 values.
GAGE results
We computed likelihoods for the assemblies generated in the GAGE project [5]. In Additional file 1, Tables S12-S14 show likelihoods of Library 1 and the number
20 25 30 35 40
Ŧ
2.4e+09
Ŧ
2.0e+09
Ŧ
1.6e+09
kŦmer length
Lik
elihood
Abyss Velvet SOAP
ACXQ ACYC
Figure 7 Hash length vs log likelihood forG. clavigera. Log likelihoods of assemblies ofG. clavigerareads are shown on they-axis. Assemblies are generated using different assemblers for varying k-mer length, which is shown on thex-axis. The dotted lines correspond to the log likelihoods of the assemblies generated using Sanger, 454 and Illumina data.
20 25 30 35 40
0e+00
1e+06
2e+06
3e+06
4e+06
kŦmer length
Diff
erence with ref
erence
[image:5.595.304.539.437.642.2]Abyss Velvet SOAP
Figure 8 Hash length vs difference from reference forG.
clavigera. Differences between assemblies and the reference are
shown on they-axis where difference refers to the numbers of bases in the reference not covered by the assembly or differ between the reference and the assembly.
Ŧ2.2e+09 Ŧ2.1e+09 Ŧ2.0e+09 Ŧ1.9e+09 Ŧ1.8e+09
0e+00
1e+05
2e+05
3e+05
4e+05
5e+05
6e+05
Log likelihood
N50 scaff
old length
[image:5.595.57.293.454.661.2]Abyss Velvet SOAP
of reads mapped to assemblies by Bowtie 2 [31]. We found that the likelihood values of Library 1 are domi-nated by coverage and contiguity does not affect these values greatly. However, contiguity has more effect on the likelihoods of Library 2, which has a longer insert size (Additional file 1, Tables S12-S14), as might be expected. The total likelihood along with coverage and N50 values are shown in Tables 2, 3, 4, 5. For human chromosome 14, we computed Library 2 likelihoods for assemblies with the best three likelihoods of Library 1. The likelihood values of Library 2 for bumble bee assemblies were not computed as only a small fraction of the reads could be mapped to the assemblies.
Assemblathon 1 results
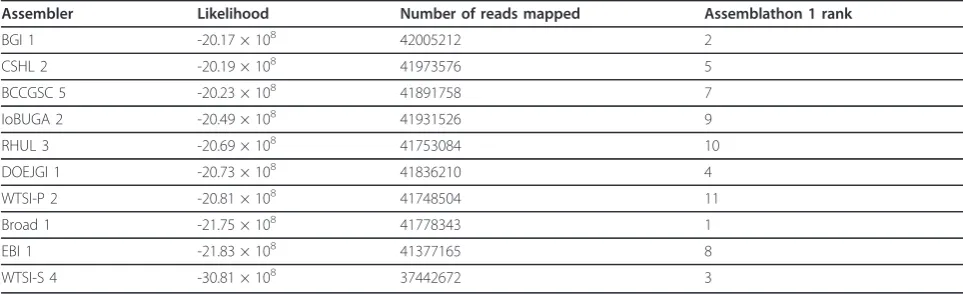
We also analyzed the assemblies submitted for Assem-blathon 1 [4]. The likelihoods for a library of an insert size of mean 200 bp for all assemblies are given in Addi-tional file 1, Table S15. Figure 10 shows the relationship between likelihood and coverage. We took the entries with the highest likelihood for the top ten participants and computed the likelihoods for the libraries of insert sizes of means 3,000 bp and 10,000 bp. Table 6 shows the total likelihoods of the top ten participants along with their Assemblathon 1 rankings.
Discussion E. coli
We found that for both E. colidatasets, the assemblies with the best likelihoods were constructed by ABySS. They also have most similarity with the references (assuming [NCBI: NC 000913.2] is the reference for the CLC bio dataset). TheR2 values (Figures 4, 5 and Addi-tional file 1, Figure S1) reveal that the likelihoods reflect sequence similarity better than contiguity statistics such as N50 values as well as the numbers of mis-assembly features and suspicious regions identified by amosvali-date. The analysis of the two different E. colidatasets also reveal that for assemblers like Velvet and SOAPde-novo higher likelihood values are achieved for different values of the k-mer length used to construct the de Bruijn graph during assembly.
G. clavigera
[image:6.595.59.537.415.535.2]For the G. clavigeradataset, one of the Velvet blies has the highest likelihood. Although ABySS assem-blies have more coverage, they have lower likelihood because of the much longer total length. Despite this we see from the R2 values that likelihood values reflect sequence similarity better than the N50 values (Figure 9 and Additional file 1, Figures S11, S14) and the numbers
Table 2 Likelihoods of GAGE assemblies ofS. aureus
Assembler Likelihood Number of reads mapped Coverage (%) Scaffold N50 (kb) Contig N50 (kb)
ABySS -23.34 × 10⁷ 1236230 99.74a 34 29.2
ALLPATHS-LG -24.53 × 10⁷ 1220328 99.38 1092 96.7
Bambus2 -23.76 × 10⁷ 1200527 98.68 1084 50.2
MSR-CA -25.85 × 10⁷ 1192001 98.70 2412 59.2
SGA -26.61 × 10⁷ 1018936 98.09 208 4.0
SOAPdenovo -23.55 × 10⁷ 1212384 99.62 332 288.2
Velvet -23.28 × 10⁷ 1203907 99.21 762 48.4
Reference -22.38 × 10⁷ 1268718 - -
-a
Value reported in original paper is 98.63.
Table 3 Likelihoods of GAGE assemblies ofR. sphaeroides
Assembler Likelihood Number of reads mapped Coverage (%) Scaffold N50 (kb) Contig N50 (kb)
ABySS -27.55 × 10⁷ 1199197 99.11a 9 5.9
ALLPATHS-LG -26.61 × 10⁷ 1237938 99.53 3192 42.5
Bambus2 -32.56 × 10⁷ 1111596 95.07 2439 93.2
CABOG -39.23 × 10⁷ 1022732 92.49 66 20.2
MSR-CA -31.61 × 10⁷ 1155078 96.48 2976 22.1
SGA -31.58 × 10⁷ 1031547 97.69 51 4.5
SOAPdenovo -27.67 × 10⁷ 1212959 99.12 660 131.7
Velvet -28.77 × 10⁷ 1176125 98.40 353 15.7
Reference -25.99 × 10⁷ 1255750 - -
-a
[image:6.595.57.539.588.722.2]of mis-assembly features and suspicious regions reported by amosvalidate. This suggests that likelihood values are useful in simultaneously evaluating coverage and total assembly length.
GAGE
For the GAGEStaphylococcus aureusdataset, we find that the assembly generated using Velvet has the best likelihood but likelihoods of a few other assemblies are close. ForRhodobacter sphaeroides, the ALLPATHS-LG assembly has the best likelihood, which is also the
assembly with the highest coverage and N50 scaffold length. The CABOG assembly of human chromosome 14 is the one with the best likelihood. The CABOG assembly also has the highest coverage and N50 contig length among the assemblies. In all three cases, we find that the reference sequences have the highest likelihoods and the highest number of reads mapped to them by Bowtie 2. For the bumblebee data, the assembly using CABOG has the best likelihood of the three (the likelihood of the SOAPdenovo assembly could not be computed as reads could not be mapped to it using Bowtie 2).
[image:7.595.56.540.101.180.2]Assemblathon 1
Figure 10 reveals that for the Assemblathon 1 dataset, the likelihoods for a small fragment library correlate well with coverages. Overall, we find that participants with the ten highest likelihoods were ranked within the top eleven by the Assemblathon 1 organizers but there are differences between the two rankings. The entry with the highest likelihood is from the Beijing Genomics Institute (BGI), which was ranked two in the original paper. The differences in rankings are primarily due to the emphasis on contiguity made by the Assemblathon 1 organizers while our likelihood model implicitly places more importance on coverage. This brings up the issue that better contiguity statistics can be achieved by not reporting hard-to-assemble regions and these values may be misleading if they are not used in conjunction with an indicator of coverage.
Applications
Currently, assembly evaluation projects rely mostly on simulated data or data from genomes that have been sequenced previously [4,5]. Having a tool that can assess Table 4 Likelihoods of GAGE assemblies of human chromosome 14
Assembler Likelihood Number of reads mapped Coverage (%) Scaffold N50 (kb) Contig N50 (kb)
ABySS -23.44 × 10⁸ 22096466 82.22 2.1 2
ALLPATHS-LG -22.77 × 10⁸ 23122569 97.24 81647 36.5
CABOG -21.26 × 10⁸ 23433424 98.32 393 45.3
SOAPdenovo a a 98.17 455 14.7
Reference -19.04 × 10⁸ 23978017 - -
-a
[image:7.595.59.541.226.294.2]Likelihood not computed as reads could not be mapped with Bowtie 2.
Table 5 Likelihoods of GAGE assemblies of a bumblebee,B. impatiens
Assembler Likelihood # reads mapped Scaffold N50 (kb) Contig N50 (kb)
ABySS -30.83 × 10⁹ 72629126 -
-CABOG -19.99 × 10⁹ 92844610 1125 23.5
MSR-CA -22.84 × 10⁹ 78755756 1246 32.4
SOAPdenovo a a 1374 57.1
a
Likelihood not computed as reads could not be mapped with Bowtie 2.
80 85 90 95
Ŧ
2.5e+09
Ŧ
2.0e+09
Ŧ
1.5e+09
Ŧ
1.0e+09
Coverage of genome
Log lik
[image:7.595.57.291.474.681.2]elihood
the quality of assembly without the need for a reference will allow researchers who work with real data from gen-omes that have not been sequenced before to assess the performance of different assemblers on their data, and to optimize the parameters in the programs they are using.
The analysis of two different datasets fromE. colireveals that the performance of some assemblers varies signifi-cantly depending on the k-mer chosen for constructing the de Bruijn graph. Moreover, the‘optimal’value depends on read length and sequence coverage. Likelihood values can therefore guide selection of parameter values.
The concept of maximum likelihood genome assembly was introduced by Medvedev and Brudno [1] but they do not consider sequencing errors or paired-end reads. A likelihood model taking into account these may be the next step towards genome assemblers for real data that try to maximize likelihood.
Conclusions
In this paper we presented a tool for computing the likelihood of an assembly. The result can be used as a metric for evaluating and comparing assemblies. In the past this has been done using many different criteria including N50 lengths, total sequence length and num-ber of contigs. The likelihood model incorporates these directly or indirectly in addition to other important fac-tors such as genome coverage and assembly accuracy and combines them into a single metric for evaluation.
We have also used our tool to assess the performance of assemblers using different datasets. Our results indicate that likelihood reflects sequence similarity, which is missed by other metrics commonly used and will be a valuable tool for evaluating assemblies generated by different assem-blers and for different values of the input parameters.
Materials and methods Mapping reads
The first step in computing the likelihood is mapping reads to the assembly. A number of tools are available
for this such as Bowtie [31,32], MAQ [33], BWA [34] and BFAST [35]. Our present implementation can use either BFAST or Bowtie 2 for mapping reads as they support mapping with indels and report multiple align-ments in a way that gives all the required information without accessing the assembly sequence. But any tool that reports multiple alignments of reads and allows for insertions and deletions can be used with some minor modifications.
However, existing tools do not usually map all reads, and for the likelihood computation it is necessary to assign probabilities to reads that are unmapped. We found that mapping tools were unable to map a large fraction of reads in our experiments. One option is to assign prob-abilities to these reads, assuming that they could have been generated from any site, using the number and types of errors not handled by the mapping tool. But it is then often the case that unmapped reads are deemed more probable than mapped ones, which we believe is anoma-lous. Furthermore, in our analyses we determined that the resulting probabilities were inaccurate (results not shown). Therefore, we chose to directly align the reads not mapped by BFAST or Bowtie 2 using an adaptation of the Smith-Waterman algorithm. We adapted the striped implemen-tation of the Smith-Waterman algorithm by Farrar [36]. This step is time consuming, so we align only a random subset of reads with the number specified by the user and approximate probabilities using these.
Learning distributions
[image:8.595.56.538.100.247.2]To compute the likelihood from mapped reads, we need to learn the distribution of fragment lengths, their distribu-tion across the genome and error characteristics. Since they differ with library preparation methods and sequen-cing instruments, we chose to learn these from sequensequen-cing data generated in the experiment. We do this by mapping reads to the assembly and using reads that map uniquely. However, this can be easily extended to take into account all reads by using the expectation-maximization (EM) Table 6 Likelihoods of Assemblathon 1 assemblies
Assembler Likelihood Number of reads mapped Assemblathon 1 rank
BGI 1 -20.17 × 10⁸ 42005212 2
CSHL 2 -20.19 × 10⁸ 41973576 5
BCCGSC 5 -20.23 × 10⁸ 41891758 7
IoBUGA 2 -20.49 × 10⁸ 41931526 9
RHUL 3 -20.69 × 10⁸ 41753084 10
DOEJGI 1 -20.73 × 10⁸ 41836210 4
WTSI-P 2 -20.81 × 10⁸ 41748504 11
Broad 1 -21.75 × 10⁸ 41778343 1
EBI 1 -21.83 × 10⁸ 41377165 8
algorithm at the expense of more iterations. We explain each distribution in more detail below.
Fragment length distribution
The distribution of fragment lengths depends on the method used for size selection and may not be approxi-mated well by common distributions [37]. So, we use the empirical distribution.
Distribution of fragments along genome
In our implementation, we assume that fragments are distributed uniformly across the genome. We leave incorporating sequencing bias as future work.
Error model
In the error model used at present, we have made the assumption that sequencing errors are independent of one another. We learn an error rate for each position in the read since error rates are known to be different across positions in reads [38]. We also learn separate error rates for each type of base and substitution type. Although errors are known to depend on sequence con-text [38], we have ignored them for the sake of simplicity.
To account for varying indel rates across positions in reads, we learn an insertion rate and a deletion rate for each position in the read. Since short indels are more likely than longer ones, we also count the number of insertions and deletions by length.
Implementation
As mentioned earlier, we use BFAST or Bowtie 2 to map reads to assemblies. The parameters are set so that they report all alignments of a read found.
The remaining code for computing likelihood is writ-ten in C++ and it consists of three parts:
convert: This converts the output generated by BFAST or Bowtie 2 to an internal format. It also sepa-rates reads with no end or one end mapped and reads with ends mapped to different scaffolds if needed. Separating this module also allow us to support other mapping tools by writing a conversion routine.
align: To align the reads not mapped by the mapping tool, we adapted the striped implementation of the Smith-Waterman algorithm by Farrar [36]. As this step is time consuming, we align a random subset of reads with the number determined by the user. This step is multithreaded to speed up the process.
CGAL: This learns the fragment length distribution and parameters for the error model using uniquely mapped reads and then uses these to compute the likeli-hood value.
Assembling genomes
To assemble reads, we varied the k-mer length used to construct the de Bruijn graph to obtain different
assemblies for each assembly tool. For other parameters, the default values or values suggested in manuals were used.
Data analysis
Likelihoods were computed by running CGAL with the default parameters and aligning between 300 and 1,000 randomly chosen reads not mapped by the mapping tool used. The running time for CGAL was approxi-mately 1/3 of the time taken to map reads using Bowtie 2.
To compute the difference between an assembly and the reference, we aligned the assembly to the reference using NUCmer [28]. The difference refers to the num-ber of bases in the reference that are either not covered by the assembly or differ in the reference and assembly. Contigs were generated by splitting scaffolds at sites with 25 or moreN’s (character representing any base).
Additional material
Additional File 1: Supplementary information for computing genome assembly likelihoods. Additional figures, tables and information to supplement the text.
Abbreviations
bp: base pair; FRC: feature response curve; PE: paired-end.
Authors’contributions
AR and LP conceived the project and developed the methodology. AR implemented the method in the CGAL software and obtained the results of the paper. AR and LP wrote the manuscript. All authors read and approved the final manuscript.
Competing interests
The authors have no competing interests.
Acknowledgements
We thank Michael Eisen, Aaron Kleinman, Harold Pimentel and Adam Roberts for helpful conversations in the development of the likelihood-based approach for assembly evaluation. LP was funded in part by NIH R21 HG006583. AR was funded in part by Fulbright Science & Technology Fellowship 15093630.
Author details
1Department of Electrical Engineering and Computer Sciences, 387 Soda
Hall, UC Berkeley, Berkeley, CA 94720, USA.2Departments of Mathematics and Molecular & Cell Biology, 970 Evans Hall, UC Berkeley, Berkeley, CA 94720, USA.
Received: 23 August 2012 Revised: 28 September 2012 Accepted: 29 January 2013 Published: 29 January 2013
References
1. Medvedev P, Brudno M:Maximum likelihood genome assembly.Journal
of Computational Biology2009,16:1101-1116.
2. Medvedev P, Georgiou K, Myers G, Brudno M:Computability of models for sequence assembly.InAlgorithms in Bioinformatics, Volume 4645 of Lecture
Notes in Computer Science.Edited by: Giancarlo R, Hannenhalli S. Berlin/
3. Nagarajan N, Pop M:Parametric complexity of sequence assembly: theory and applications to next generation sequencing.Journal of
computational biology2009,16:897-908.
4. Earl DA, Bradnam K, St John J, Darling A, Lin D, Faas J, Yu HOK, Vince B, Zerbino DR, Diekhans M, Nguyen N, Nuwantha P, Sung AWK, Ning Z, Haimel M, Simpson JT, Fronseca NA, Birol N, Docking TR, Ho IY, Rokhsar DS, Chikhi R, Lavenier D, Chapuis G, Naquin D, Maillet N, Schatz MC, Kelly DR, Phillippy AM, Koren S,et al:Assemblathon 1: a competitive assessment of de novoshort read assembly methods.Genome Research2011, 12:2224-2241.
5. Salzberg SL, Phillippy AM, Zimin A, Puiu D, Magoc T, Koren S, Treangen TJ, Schatz MC, Delcher AL, Roberts M, Marcais G, Pop M, Yorke JA:GAGE: a critical evaluation of genome assemblies and assembly algorithms.
Genome Research2012,3:557-567.
6. Margulies M, Egholm M, Altman WE, Attiya S, Bader JS, Bemben LA, Berka J, Braverman MS, Chen YJ, Chen Z, Dewell SB, Du L, Fierro JM, Gomes XV, Godwin BC, He W, Helgesen S, Ho CH, Irzyk GP, Jando SC, Alenquer ML, Jarvie TP, Jirage KB, Kim JB, Knight JR, Lanza JR, Leamon JH, Lefkowitz SM, Lei M, Li J,et al:Genome sequencing in microfabricated high-density picolitre reactors.Nature2005,437:376-380.
7. Harris TD, Buzby PR, Babcock H, Beer E, Bowers J, Braslavsky I, Causey M, Colonell J, DiMeo J, Efcavitch JW, Giladi E, Gill J, Healy J, Jarosz M, Lapen D, Moulton K, Quake SR, Steinmann K, Thayer E, Tyurina A, Ward R, Weiss H, Xie Z:Single-molecule DNA sequencing of a viral genome.Science2008, 320:106-109.
8. Sanger F, Nicklen S, Coulson AR:DNA sequencing with chain-terminating inhibitors.Proceedings of the National Academy of Sciences of the United
States of America1977,74:5463-5467.
9. Zerbino DR, Birney E:Velvet: algorithms forde novoshort read assembly using de Bruijn graphs.Genome Research2008,18:821-829.
10. Pevzner PA, Tang H, Waterman MS:An Eulerian path approach to DNA fragment assembly.Proceedings of the National Academy of Sciences of the
United States of America2001,98:9748-9753.
11. Simpson JT, Wong K, Jackman SD, Schein JE, Jones SJ, Birol I:ABySS: a parallel assembler for short read sequence data.Genome Research2009, 19:1117-1123.
12. Hernandez D, Francois P, Farinelli L, Osteras M, Schrenzel J:De novo bacterial genome sequencing: millions of very short reads assembled on a desktop computer.Genome research2008,18:802-809.
13. Warren RL, Sutton GG, Jones SJM, Holt RA:Assembling millions of short DNA sequences using SSAKE.Bioinformatics2007,23:500-501.
14. Jeck WR, Reinhardt JA, Baltrus DA, Hickenbotham MT, Magrini V, Mardis ER, Dangl JL, Jones CD:Extending assembly of short DNA sequences to handle error.Bioinformatics2007,23:2942-2944.
15. Dohm JC, Lottaz C, Borodina T, Himmelbauer H:SHARCGS, a fast and highly accurate short-read assembly algorithm forde novogenomic sequencing.Genome Research2007,17:1697-1706.
16. Butler J, MacCallum I, Kleber M, Shlyakhter IA, Belmonte MK, Lander ES, Nusbaum C, Jaffe DB:ALLPATHS:de novoassembly of whole-genome shotgun microreads.Genome Research2008,18:810-820.
17. Li R, Zhu H, Ruan J, Qian W, Fang X, Shi Z, Li Y, Li S, Shan G, Kristiansen K, Li S, Yang H, Wang J, Wang J:De novoassembly of human genomes with massively parallel short read sequencing.Genome Research2010, 20:265-272.
18. Myers EW, Sutton GG, Delcher AL, Dew IM, Fasulo DP, Flanigan MJ, Kravitz SA, Mobarry CM, Reinert KH, Remington KA, Anson EL, Bolanos RA, Chou HH, Jordan CM, Halpern AL, Lonardi S, Beasley EM, Brandon RC, Chen L, Dunn PJ, Lai Z, Liang Y, Nusskern DR, Zhan M, Zhang Q, Zheng X, Rubin GM, Adams MD, Venter JC:A whole-genome assembly of Drosophila.Science2000,287:2196-2204.
19. Vezzi F, Narzisi G, Mishra B:Feature-by-feature - evaluatingde novo sequence assembly.PLoS ONE2012,7:e31002.
20. Phillippy A, Schatz M, Pop M:Genome assembly forensics: finding the elusive mis-assembly.Genome Biology2008,9:R55.
21. Narzisi G, Mishra B:Comparingde novogenome assembly: the long and short of it.PLoS ONE2011,6:e19175.
22. Zhang W, Chen J, Yang Y, Tang Y, Shang J, Shen B:A practical comparison ofde novogenome assembly software tools for next-generation sequencing technologies.PLoS ONE2011,6:e17915.
23. Lin Y, Li J, Shen H, Zhang L, Papasian CJ, Deng HW:Comparative studies ofde novoassembly tools for next-generation sequencing technologies.
Bioinformatics2011.
24. Darling AE, Tritt A, Eisen JA, Facciotti MT:Mauve assembly metrics.
Bioinformatics2011,27:2756-2757.
25. Alkan C, Sajjadian S, Eichler EE:Limitations of next-generation genome sequence assembly.Nature Methods2011,8:61-65.
26. Myers EW:The fragment assembly string graph.Bioinformatics2005, 21:79-85.
27. DiGuistini S, Liao N, Platt D, Robertson G, Seidel M, Chan S, Docking TR, Birol I, Holt R, Hirst M, Mardis E, Marra M, Hamelin R, Bohlmann J, Breuil C, Jones S:De novogenome sequence assembly of a filamentous fungus using Sanger, 454 and Illumina sequence data.Genome Biology2009,10: R94.
28. Delcher AL, Phillippy A, Carlton J, Salzberg SL:Fast algorithms for large-scale genome alignment and comparison.Nucleic Acids Research2002, 30:2478-2483.
29. CLC bio: NGS example data..[http://www.clcbio.com/index.php?id=1290]. 30. Altschul SF, Gish W, Miller W, Myers EW, Lipman DJ:Basic local alignment
search tool.Journal of Molecular Biology1990,215:403-410.
31. Langmead B, Salzberg SL:Fast gapped-read alignment with Bowtie 2.
Nature Methods2012,9:357-359.
32. Langmead B, Trapnell C, Pop M, Salzberg S:Ultrafast and memory-efficient alignment of short DNA sequences to the human genome.Genome
Biology2009,10:R25+.
33. Li H, Ruan J, Durbin R:Mapping short DNA sequencing reads and calling variants using mapping quality scores.Genome Research2008, 18:1851-1858.
34. Li H, Durbin R:Fast and accurate short read alignment with Burrows-Wheeler transform.Bioinformatics2009,25:1754-1760.
35. Homer N, Merriman B, Nelson SF:BFAST: an alignment tool for large scale genome resequencing.PLoS ONE2009,4:e7767+.
36. Farrar M:Striped Smith-Waterman speeds database searches six times over other SIMD implementations.Bioinformatics2007,23:156-161. 37. Roberts A, Trapnell C, Donaghey J, Rinn J, Pachter L:Improving RNA-Seq
expression estimates by correcting for fragment bias.Genome Biology 2011,12:R22.
38. Dohm JC, Lottaz C, Borodina T, Himmelbauer H:Substantial biases in ultra-short read data sets from high-throughput DNA sequencing.
Nucleic Acids Research2008,36:e105.
doi:10.1186/gb-2013-14-1-r8
Cite this article as:Rahman and Pachter:CGAL: computing genome
assembly likelihoods.Genome Biology201314:R8.
Submit your next manuscript to BioMed Central and take full advantage of:
• Convenient online submission
• Thorough peer review
• No space constraints or color figure charges
• Immediate publication on acceptance
• Inclusion in PubMed, CAS, Scopus and Google Scholar
• Research which is freely available for redistribution