Georgia State University Georgia State University
ScholarWorks @ Georgia State University
ScholarWorks @ Georgia State University
Public Health Theses School of Public Health
Winter 11-8-2011
Awareness of Diabetes Risk and Adoption of Diabetes Risk
Awareness of Diabetes Risk and Adoption of Diabetes Risk
Reduction Behaviors in the Presence of Other Risk Factors in U.S
Reduction Behaviors in the Presence of Other Risk Factors in U.S
Adults: An Examination of NHANES Data 2007-2008
Adults: An Examination of NHANES Data 2007-2008
Payal S. Shah
Georgia State University
Follow this and additional works at: https://scholarworks.gsu.edu/iph_theses Part of the Public Health Commons
Recommended Citation Recommended Citation
Shah, Payal S., "Awareness of Diabetes Risk and Adoption of Diabetes Risk Reduction Behaviors in the Presence of Other Risk Factors in U.S Adults: An Examination of NHANES Data 2007-2008." Thesis, Georgia State University, 2011.
https://scholarworks.gsu.edu/iph_theses/188
AWARENESS OF DIABETES RISK AND ADOPTION OF DIABETES RISK REDUCTION BEHAVIORS IN THE PRESENCE OF OTHER RISK FACTORS IN U.S
ADULTS:
AN EXAMINATION OF NHANES DATA 2007-2008
by
PAYAL SURESH SHAH
B.S., UNIVERSITY OF GEORGIA
A Thesis Submitted to the Graduate Faculty
of Georgia State University in Partial Fulfillment
of the
Requirements for the Degree
MASTER OF PUBLIC HEALTH
APPROVAL PAGE
AWARENESS OF DIABETES RISK AND ADOPTION OF DIABETES RISK REDUCTION BEHAVIORS IN THE PRESENCE OF OTHER RISK FACTORS IN U.S
ADULTS: AN EXAMINATION OF NHANES DATA 2007-2008
by
PAYAL SURESH SHAH
Approved:
Ike S. Okosun______________________________
Committee Chair
Frances McCarty____________________________
Committee Member
__________________________________________
Committee Member
May 2011__________________________________
Date
To my Mother for all her love, support, and sacrifice. To my sister for her
encouragement, faith and believing in me. To Milan bhai for showing, directing, and guiding me on the right path of life and lastly to my Father who couldn’t be here, but for allowing me to fulfill his dream.
Thank You.
ACKNOWLEDGEMENTS
I would like to thank all the professors, faculty, and staff in the Institute of Public Health at Georgia State University for teaching and guiding me throughout my career and lifetime experiences. I would also like to give my special thanks to all my committee members Dr. Frances McCarty and my chair Dr. Ike S. Okosun, without them I wouldn’t be where I am today. I would also like to acknowledge Sheetal Shah for supporting and guiding me throughout my journey.
Author’s Statement
In presenting this thesis as a partial fulfillment of the requirements for an
advanced degree from Georgia State University, I agree that the Library of the University shall make it available for inspection and circulation in accordance with its regulations governing materials of this type. I agree that permission to quote from, to copy from, or to publish this thesis may be granted by the author or, in his/her absence, by the professor under whose direction it was written, or in his/her absence, by the Associate Dean, College of Health and Human Sciences. Such quoting, copying, or publishing must be solely for scholarly purposes and will not involve potential financial gain. It is understood that any copying from or publication of this dissertation which involves potential
financial gain will not be allowed without written permission of the author.
Notice to Borrowers
All theses deposited in the Georgia State University Library must be used in accordance with the stipulations prescribed by the author in the preceding statement.
The author of this thesis is: Payal Suresh Shah
2543 Davenham Lane Duluth, GA 30096
The Chair of the committee for this thesis is: Ike S. Okosun PhD, MS, MPH, FRIPH, FRSH Institute of Public Health
College of Health and Human Sciences Georgia State University
P.O. Box 3995
Atlanta, Georgia 30302-3995
Users of this thesis who not regularly enrolled as students at Georgia State University are required to attest acceptance of the preceding stipulation by signing below. Libraries borrowing this thesis for the use of their patrons are required to see that each user records here the information requested.
Payal Suresh Shah
●2543 Davenham Ln ●Duluth, GA 30096 ● 770-623-2078 (H) ● 404-731-0052 (C) ● [email protected]
Education
Master of Public Health, January 2010-Present Georgia State University, Atlanta, GA
Bachelors of Science in Chemistry, Minor: Biology, May 2009 University of Georgia, Athens, GA
Work Experience
Public Health Analyst/ Data Operator, Summer 2009-Winter, Atlanta, Ga
NAI Contractor for Centers for Disease Control and Prevention (CDC)
• Completed data abstraction actions of Public Health Assessments, Health Consultations, and Technical Assistance documents.
• Reviewed, evaluated, and analyzed content of these documents to ensure they are scientifically and technically sound to successfully abstract data into Sequoia database. • Completed Quality Assurance (QA) for public health documents and reviewed the information entered by other abstractors to determine whether information is entered in database correctly. This process enhances the way partners are completing the work and the nature of the data contained in the documents to ensure that the abstraction process contain the information needed to accurately reflect the information about individual sites in the Agency’s database.
• Identified data gaps in documents that needed to be filled in order to have good quality data in Sequoia database.
• Significant contributions while evaluating and analyzing contents of scientific
documents is the ability to recognize inconsistencies in documents that authors needed to correct.
Assistant Research Scientist, Spring 2008-Spring 2009, Athens, Ga
Complex Carbohydrate Research Center
• Conducted experiments using methods such as centrifugation and dialysis to acquire data that can be used to solve problems and substantiate hypothesis and theoretical assumptions.
• Contributed to scientific articles on projects that are still being further researched for publishing.
AWARENESS OF DIABETES RISK AND ADOPTION OF DIABETES
RISK REDUCTION BEHAVIOR S IN THE PRESENCE OF OTHER
RISK FACTORS IN U.S ADULTS: AN EXAMINATION OF NHANES
DATA 2007-2008
STUDENTS’S NAME:
Payal Suresh Shah
THESIS CHAIR:
Ike S Okosun PhD, MS, MPH, FRIPH, FRSH
ABSTRACT
Background: Prediabetes is a precursor condition to type 2 diabetes mellitus. Previous research and clinical trials have shown that the onset of type 2 diabetes could be delayed or prevented through structured life style modifications such as dietary changes, modest weight loss and moderate-intensity exercise. This study examines U.S adults of different ethnicities that include non-Hispanic white, non-Hispanic black and Mexican Americans and whether their awareness of diabetes risk is associated with their participation in diabetes risk reduction behavior, a combination of physical activity, weight control and fat/calories intake.
Methods: The 2007-2008 National Health and Nutrition Examination Survey, NHANES, was used to conduct a cross-sectional study of 4083 U.S. adults who were 20 years old and above and were aware of their diabetes risk. The association between the awareness of one’s diabetes risk and the adoption of diabetes risk reduction behavior were examined in present of other risk factors such as age, gender, ethnicity, education, annual family income, BMI, hypertension, mean systolic blood pressure, mean diastolic blood pressure, total cholesterol, LDL, HDL and triglyceride levels. Males and females were examined separately for all analyses performed. Cross tabulation was conducted and p-values were calculated by the Pearson’s chi-square test for the categorical variables which include gender, ethnicity, education, annual family income, adiposity and hypertension. One Way ANOVA and Tukey post hoc tests were conducted for the continuous variables which include age, mean systolic blood pressure, mean diastolic blood pressure, total
cholesterol, LDL, HDL and triglyceride levels. Univariate and multivariate analyses were performed to determine the association between the main independent variable,
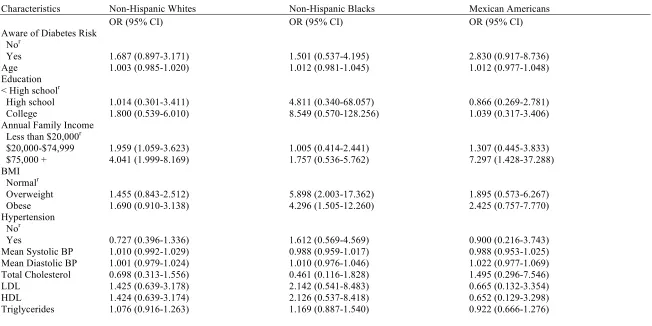
Results: After controlling for age, gender, race, education, annual family income, BMI, hypertension, mean systolic blood pressure, mean diastolic blood pressure, total
cholesterol, LDL, HDL, and triglycerides, results from the multivariate analysis showed that subjects who were aware of their diabetes risk were more likely to adopt diabetes risk reduction behavior (OR= 1,734, 95 % CI=1.217-2.470). Females and non-Hispanic blacks, who were aware of their diabetes risk, were also more likely to adopt diabetes risk reduction behavior compared to males, non-Hispanic whites and Mexican Americans. An increase in the levels of education, annual family income and BMI was also
associated with the adoption of diabetes risk reduction behavior. Stratification according to gender and ethnicity, showed that Mexican American males and females were more likely to engage in diabetes risk reduction behavior compared to non-Hispanic whites and non-Hispanic blacks (Mexican American males: OR: 2.496, CI: 0.792-7.868; Mexican American females: OR: 2.830, CI: 0.917-8.736).
APPROVAL PAGE……….………ii
DEDICATION PAGE………iii
ACKNOWLEDGEMENTS………...……….iv
INTRODUCTION………...1
1a. Background………...1
1b. Purpose of Study………...4
1c. Research Questions………...5
REVIEW OF THE LITERATURE……….7
2a. Epidemiology of Diabetes and Prediabetes………...7
2b. Risk factors for Diabetes and Prediabetes………9
a.Age……….10
b.Ethnicity……….11
c.Gender………14
d.Education as Socioeconomic Status, SES………..15
e.Income as SES………...17
f.Body Mass Index, BMI………..19
g. Blood Pressure and Hypertension……….21
h. Cholesterol, HDL and LDL………..24
i. Triglycerides……….25
METHODOLOGY………27
3a. Data Source and Study Population………..27
3c. Independent Variables……….30
3d. Statistical Analysis………..36
RESULTS………..38
4a. Sample Demographics………38
4b. Diabetes Risk Reduction Behavior Characteristics………39
4c. Univariate Analysis……….41
4d. Multivariate Analysis………..42
DISCUSSION AND CONCLUSION………...45
5a. Discussion………...45
5b. Strengths and Limitations of the Study………...49
5c. Clinical and Public Health Implications……….50
5d. Conclusion………..51
REFERENCES………..53
Above……….59
Table 2. Demographic and Biological Characteristics of U.S. Female Adults Ages 20 and Above……….60
Table 3. Diabetes Risk Reduction Behavior Characteristics of U.S. Male Adults Ages 20 and
Above...61
Table 4. Diabetes Risk Reduction Behavior Characteristics of U.S. Female Adults Ages 20 and
Above……….62
Table 5. Univariate Analysis of Association between Awareness of One’s Diabetes Risk with Adoption of Diabetes Risk Reduction Behavior in U.S. Male Adults Ages 20 and Above by
Ethnicity……….63
Table 6. Univariate Analysis of Association between Awareness of One’s Diabetes Risk with Adoption of Diabetes Risk Reduction Behavior in U.S. Female Adults Ages 20 and Above by
Ethnicity……….64
Table 7. Multivariate Analysis of Association between Awareness of One’s Diabetes Risk with Adoption of Diabetes Risk Reduction Behavior for U.S. Male and Female Adults Ages 20 and
Above……….65
Table 8. Multivariate Analysis of Association between Awareness of One’s Diabetes Risk with Adoption of Diabetes Risk Reduction Behavior for U.S. male adults ages 20 and above………...66
1 CHAPTER I
INTRODUCTION
1a. Background
Diabetes mellitus is a metabolic disease condition characterized by
hyperglycemia, or high blood glucose levels, which results from defects in insulin
secretion, insulin action or both (Narayan, Zhang, Kanaya, Williams, Engelgau,
Imperator &Ramachandran, 2006). Diabetes often goes undiagnosed because of its many
symptoms that may seem to be harmless. For example, symptoms may include frequent
urination, unusual thirst, extreme hunger, unusual weight loss, and extreme fatigue and
irritability (ADA, 2011). Therefore, many people with diabetes do not seek treatment
until symptoms worsen. Diabetes takes three major forms which include Type 1, Type 2
and gestational diabetes. Type 1 diabetes usually occurs in children and adolescents and
results from the destruction of the beta cells in the pancreas which leads to absolute
insulin deficiency (Narayan et al., 2006). The body does not produce insulin in type 1
diabetes and only 5% of people with diabetes have this form of disease (ADA, 2011).
However, with the help of insulin therapy and other treatments people can learn to
manage Type 1diabetes and live a healthy lifestyle. Type 2 diabetes, which accounts for
approximately 85 to 95 percent of all diagnosed cases, is usually characterized by insulin
resistance in which target tissues do not use insulin properly (Narayan et al., 2006).
Millions of Americans have been diagnosed with Type 2 diabetes and many more are
unaware they are at high risk (ADA, 2011). In addition, research has found that some
example, Type 2 diabetes is more common in African Americans, Latinos, Native
Americans, Asian Americans, Native Hawaiians and other Pacific Islanders (ADA,
2011).A third type of diabetes, gestational diabetes, is first recognized during pregnancy,
usually around the 24th week. (Narayan et al., 2006).
In addition to the three forms of diabetes, is another condition known as
prediabetes in which blood glucose levels are higher than normal but not yet high enough
to be diagnosed as diabetes (ADA, 2011). Prediabetes is also a condition defined as
having impaired fasting glucose (plasma glucose level of 100 to < 126 mg/dL after an
overnight fast), impaired glucose tolerance (plasma glucose level of 140 to < 200 mg/dL
after a 2-hour oral glucose tolerance test) or both (CDC, 2008). Three different tests such
as the A1C, the fasting plasma glucose (FPG) and the Oral Glucose Tolerance Test
(OGTT), are used by doctors to determine if one has prediabetes (ADA, 2011). The blood
glucose levels measured after these tests determine whether one has normal metabolism,
prediabetes or diabetes. There are approximately 79 million people in the United States
that have prediabetes and recent research has shown some long-term damage to the body
especially the heart and circulatory system (ADA, 2011). Persons with prediabetes are
also at an increased risk for developing type 2 diabetes, heart disease, and stroke (CDC,
2008). People that are diagnosed with prediabetes are aware of their high risk for
developing diabetes. Therefore, they may engage in or adapt certain lifestyle changes that
can prevent or delay development of diabetes and its complications (CDC, 2008). The
benefits of engaging in risk reduction behaviors such as weight control, increased
physical activity, and reduction in fat or caloric intake may outweigh the negative
3
Prevention Program intervention trial showed that diet and exercise can lower the
incidence of type 2 diabetes by 58% over 3 years among those at high risk for diabetes
(CDC, 2008). Furthermore, clinical trials provide strong and consistent evidence that type
2 diabetes can be prevented or delayed in high-risk adults with dysglycemia through
structured lifestyle modifications, including dietary changes, moderate-intensity exercise,
and modest weight loss (Geiss et al., 2010). However, the extent to which U.S. adults
with prediabetes are making lifestyle changes consistent with reducing risk is unknown
(Geiss et al., 2010). Additional research is also needed to determine the effect of lifestyle
interventions on diabetes complications, particularly cardiovascular outcomes (Geiss et
al., 2010).
Successful prevention trials, in combination with subsequent practical trials
implemented in community settings, suggest that if people with dysglycemia can be
efficiently identified and made aware of their risk status, they may be referred to effective
community programs to change their levels of physical activity, dietary intake, and
weight (Geiss et al., 2010). In addition, identification of high-risk states may also be
useful to provide a stimulus for brief counseling by healthcare providers or for
individuals to undertake self-directed behavior change (Geiss et al., 2010). Identification
and awareness of prediabetes may be an important step in initiating effective lifestyle
interventions (Geiss et al., 2010). Development of linguistically competent education
materials for those people of different ethnicities and cultures and who are at a high risk
for diabetes may encourage them to practice behaviors that may reduce or delay the onset
Furthermore, interventions to prevent or delay onset of type 2 diabetes in persons
with prediabetes are feasible and cost effective. It is found that lifestyle interventions are
more cost effective than medications (CDC, 2008). One study evaluated the cost
effectiveness of a screening program for pre diabetes which was followed up by
treatment with pharmaceutical interventions or lifestyle interventions (diet, exercise, or
diet and exercise) in order to prevent or slow the onset of diabetes in those at high risk
(Bertram, Lim, Barendregt&Vos, 2010). Results indicated that the most cost-effective
intervention options were diet and exercise combined with pharmaceutical medication
metformin (Bertram et al., 2010).
The gap in prevalence between those with prediabetes and those aware of their
condition presents an opportunity to reduce the burden of diabetes by increasing
awareness of prediabetes and encouraging adoption of healthier lifestyles and risk
reduction activities (CDC, 2008). Implementation of intervention programs that are
culturally and linguistically appropriate may lead high risk individuals to engage in
lifestyle modifications such as diet, physical activity and weight control, which in turn
may be economically and monetarily cost effective for the individual and the nation as a
whole.
1b. Purpose of Study
This study will examine U.S. males and females of different ethnicities
(Non-Hispanic Whites, Non-(Non-Hispanic Blacks and Mexican Americans). It will identify subjects
that are aware of their health risk for diabetes and whether they will perform risk
5
education, socioeconomic status (determined from annual family income), and biological
factors such as body mass index (BMI), hypertension, total cholesterol, LDL, HDL, and
triglyceride levels. Although prediabetes is defined as having impaired fasting glucose or
impaired glucose tolerance, but not (yet) having diabetes, this study will utilize
diabetes-related questions from the National Health and Nutrition Examination Survey 2007-2008,
NHANES 2007-2008, to define those individuals aware of their high risk for diabetes.
The NHANES 2007-2008 questions: Ever told you have prediabetes? and Ever told you
have health risk for diabetes? were used to determine an individual’s awareness of their
health risk for diabetes.
The identification of an individual’s awareness of their health risk for diabetes or
prediabetes, may encourage them to adapt life style modifications and to seek
interventions to reverse their risk for diabetes. Since this study focuses on U.S. adults of
different ethnicities and genders it may encourage the development of future programs
and interventions specifically tailored to target those populations who are at a higher risk
for diabetes.
1c. Research Questions
Question #1: Is the awareness of one’s diabetes risk associated with the involvement in
diabetes risk reduction behavior including ongoing weight control, increase in physical
activity and fat/calories reduction?
Null Hypothesis # 1: Subjects who are aware of their diabetes risk would not be more
Alternate Hypothesis #1: Subjects who are aware of their diabetes risk would be more
likely to engage in diabetes risk reduction behavior compared to those who are unaware.
Question # 2: Will the relationship between one’s awareness of diabetes risk and
participation in diabetes risk reduction behavior vary by race/ethnicity?
Null Hypothesis #2: The relationship between one’s awareness of diabetes risk and
participation in diabetes risk reduction behavior would not vary by race/ethnicity.
Alternate Hypothesis # 2: The relationship between one’s awareness of diabetes risk and
participation in diabetes risk reduction behavior would vary by race/ethnicity.
Question # 3: Will the relationship between one’s awareness of diabetes risk and
participation in diabetes risk reduction behavior vary by gender?
Null Hypothesis # 3: The relationship between one’s awareness of diabetes risk and
participation in diabetes risk reduction behavior would not vary by gender?
Alternate Hypothesis # 3: The relationship between one’s awareness of diabetes risk and
7 CHAPTER II
LITERATURE REVIEW
The literature review examines the epidemiology of diabetes and prediabetes in
the U.S and around the world and their associated risk factors. The following chapter
presents scientific literature that supports the inclusion of the variables of interest in this
study. Since there are very limited studies on prediabetes, risk factors for diabetes were
examined as they are similar to the risk factors for prediabetes.
2a. Epidemiology of Diabetes and Prediabetes
Type 2 diabetes mellitus is a major cause of morbidity and mortality in the United
States and countries around the world and may contribute substantially to health care
costs (Moore, Zgibar, &Dasanayake, 2003). Diabetes affects at least 5 percent of the U.S.
population, while another 3 percent of the population may have the disorder but have not
been diagnosed (Moore et al., 2003). Although the epidemic of diabetes in the United
States has been observed over the past 2 decades, there is an expected continued rise in
the incidence of diabetes as the population ages, a continued increase in adult obesity
rates, and an increase in the population of minority groups that are at high risk for
diabetes (Deshpande, Harris-Hayes &Schootman, 2008). In addition, rising childhood
obesity rates and the increasing diagnosis of type 2 diabetes among children and
adolescents have become an increasingly serious health crisis, which will result in more
2005, it was estimated that more than 20 million people in the United States had diabetes
(Deshpande et al., 2008). Approximately 30% of these people had undiagnosed cases
(Deshpande et al., 2008). In addition, an estimated 1.5 million new cases of diabetes were
diagnosed. (Deshpande et al., 2008). The incidence and prevalence of diabetes mellitus
are increasing with more than 135 million people affected worldwide (Moore et al.,
2003). Although the incidence describes increases in the number of people affected by
the disease, the prevalence describes the overall burden of the disease in the population
(Deshpande et al., 2008). The National Health and Nutrition Examination Survey,
NHANES, provides estimates for both diagnosed and undiagnosed diabetes (Deshpande
et al., 2008). Based on prevalence estimates from NHANES for 2005, the total
prevalence of diabetes (both diagnosed and undiagnosed) was estimated at 20.8 million
or 7.0% of the U.S. population (Deshpande et al., 2008). Of these, 14.6 million were
diagnosed and 6.2 million almost 30% of all diabetes cases were undiagnosed
(Deshpande et al., 2008). In the United States, the prevalence and incidence of diabetes
have increased dramatically during the past 2 decades (Deshpande et al., 2008).
According to data from the National Health Interview Survey, NHIS, for the period from
1980 to 2005, the age-adjusted prevalence of diagnosed diabetes was fairly stable at
about 3.0% from 1980 to 1990 and then begun to increase (Deshpande et al., 2008). In
1990, the age-adjusted prevalence rate was 2.9% (Deshpande et al., 2008). It increased to
4.5% in 2000 and to 5.3% in 2005 (Deshpande et al., 2008). The overall prevalence of
diagnosed diabetes increases with age and the rate of increase overtime has been longest
9
diagnosed diabetes has increased over time from 1997 to 2005 in all age groups
(Deshpande et al., 2008).
Prediabetes is a precursor condition to diabetes where people can have impaired
fasting glucose (IFG) or impaired glucose tolerance (IGT) or both.From 1988 to 1994,
approximately 25% of a cross-sectional sample of U.S. adults 40 to 74 years of age were
classified as having prediabetes (Deshpande et al., 2008). For the year 2000, this would
mean that 12 million people in the United States had prediabetes (Deshpande et al.,
2008). In 2005 to 2008, based on fasting glucose or A1c levels, 35% of U.S adults aged
20 years or older had prediabetes (50% of those aged 65 years or older) (CDC, 2011).
Applying this percentage to the entire U.S. population in 2010 yields an estimated 79
million Americans, aged 20 years or older, with prediabetes (CDC, 2011). On the basis of
fasting glucose or A1c levels, and after adjusting for population age differences, the
percentage of U.S. adults aged 20 years or older with prediabetes in 2005 to 2008 was
similar for non-Hispanic whites (35%), non-Hispanic blacks (35%), and Mexican
Americans (36%) (CDC, 2011).According to the IDF Diabetes Atlas, currently, the
number of cases of impaired glucose tolerance (2010) worldwide is estimated to be
approximately 340 million (Rhee & Woo, 2011). North America has the highest
prevalence of impaired glucose tolerance in the world, with 10.4% (Rhee et al., 2011).
For Europe and the Middle East, the values are 8.9% and 8.2% respectively (Rhee et al.,
2011). There is also a predicted increase in the prevalence of pre diabetes world wide. It
is found that by 2030, the global prevalence of impaired glucose tolerance is estimated to
reach 8.4%, which will be approximately 456 million people (Rhee et al., 2011).
The biology and pathogenesis of diabetes is complex and a number of modifiable
and nonmodifiable risk factors increase the risk for diabetes. Risk factors for type 1
diabetes include family history, race and certain viral infections during childhood
(Deshpande et al., 2008). Risk factors for type 2 diabetes are more diverse where some
are modifiable and others are not. Nonmodifiable risk factors for type 2 diabetes include
age, gender, ethnicity, family history, history of gestational diabetes and low birth weight
(Deshpande et al., 2008). Modifiable or lifestyle risk factors include BMI, physical
inactivity, poor nutrition, hypertension, smoking, alcohol use, education, total cholesterol,
LDL, HDL, and triglyceride levels (Deshpande et al., 2008). This study examines the
following risk factors: age, gender, education, annual family income, BMI, hypertension,
mean systolic blood pressure, mean diastolic blood pressure, total cholesterol, LDL,
HDL, and triglycerides.
a. Age
The age of an individual is one risk factor for pre diabetes and type 2 diabetes. It
is found that diabetes incidence and prevalence increases with age (Deshpande et al.,
2008). In 2005, the Centers for Disease Control reported that the prevalence of diabetes
among people aged 20 years or older was 20.6 million (9.6% of the people in that age
group), and the prevalence of diabetes increased with age (10.3 million people aged 60
years or older, or 20.9% of those in that age group, had diabetes.) (Deshpande et al.,
2008). Rhee et al. also found that even in NHANES subjects, the prevalence of IFG and
IGT increase proportionally with age (2011). In a study by Cowie et al. the prevalence of
IFG, IGT and total pre diabetes, crude prevalence of either IFG or IGT, according to age
11
20 years, 25.7% had IFG (Cowie et al., 2009). IFG also increased with age, doubling
between ages 20-39 and 40-59 years (Cowie et al., 2009). For individuals over the age of
60 years, the IFG levels remained constant (Cowie et al., 2009). IGT was found in 13.8%
of those aged over 20 years which was about half the prevalence of IFG (Cowie et al.,
2009). The prevalence steadily increased with age, peaking at 35.1% in those aged 75
years and above (Cowie et al., 2009). The total pre diabetes which is estimated by either
IFG or IGT was about 30% among people 20 years and above (Cowie et al., 2009). The
prevalence also increased with age, peaking at 75 years and above (Cowie et al., 2009).
In another study by Harris et al. the prevalence of impaired fasting glucose increased
from ages 20 to 39 years to age 60 to 74 years or ages above 75 years (1998).
b. Ethnicity
The United States consists of a vast number of ethnic minorities and other
population sub groups. Based on the 2000 Census data, ethnic minorities constitute
approximately 25% of the overall population of the U.S (Dagogo-Jack, 2003). In
addition, the population of minority groups has been increasing at a faster rate than the
general U.S. population (Dagogo-Jack, 2003). Although the growth of these minority
populations is a sign of diversity, minority ethnic groups suffer disproportionately from
type 2 diabetes, pre diabetes and their long-term complications. There is no finding as to
why ethnic disparities exist in the occurrence of diabetes however, genetic,
environmental and lifestyle factors may likely account for the increased prevalence of
type 2 diabetes among ethnic minorities (Dagogo-Jack, 2003). Furthermore, the increase
in morbidity and mortality from diabetes may be the result of socioeconomic factors
Diabetes-related mortality is higher for minorities than for white persons, and the
rate is increasing (Carter et al., 1996). It is found that African Americans and other ethnic
minority groups suffer disproportionately from type 2 diabetes and its complications than
do white Americans (Deshpande et al. 2008). Age-adjusted prevalence rates for
diagnosed diabetes have been higher among African Americans and Hispanics compared
with whites (Deshpande et al., 2008). African American women have the highest
prevalence of diabetes compared with other racial or ethnic and gender groups
(Deshpande et al., 2008). In 2005, the age-adjusted prevalence rate for diagnosed diabetes
was 8.3% in African American women compared with 8 % in African American men,
7.5% in Hispanic women, 7.1% in Hispanic men, 4.7% in white women and 5.4% in
white men (Deshpande et al., 2008). Estimates show that 3.2 million African Americans
currently have diabetes and the number of African Americans with diabetes is projected
to triple by the year 2050, while the number of whites with diabetes is estimated to only
double (Deshpande et al. 2008).
The American Diabetes Association (ADA) states that type 2 diabetes is more
common in African Americans, Latinos, Native Americans, Asian Americans, Native
Hawaiians and other Pacific Islanders (ADA, 2011). In addition, after adjusting for
population age differences, 2007-2009 national survey data for people diagnosed with
diabetes found the following prevalence by race ethnicity for those 20 years or older:
7.1% of non-Hispanic whites, 8.4% of Asian Americans, 12.6% of non-Hispanic blacks
and 11.8% of Hispanics (ADA, 2011). Among Hispanics the rates were: 7.6% for
13
The 1976-1980 National Health and Nutrition Examination Survey (NHANES II) found
the total prevalence of diabetes in blacks persons (diagnosed and undiagnosed) to be 1.5
times greater than that of white persons (Carter et al., 1996). The NHIS also confirms this
increased risk for black persons even after controlling for an increased prevalence of
obesity (Carter et al., 1996). All Hispanic population subgroups studied to date have a
greater prevalence of diabetes than do white persons (Carter et al., 1996). For example,
data from the 1982-1984 Hispanic Health and Nutrition Examination Survey (HHANES)
show that, among Hispanic persons living in the United States, the prevalence of
non-insulin dependent diabetes is greatest for Puerto Ricans and Hispanic persons living in
the southwest while it is lowest for Cubans (Carter et al., 1996). The excess of diabetes in
the Mexican-American population persists even when the greater overall and centralized
obesity rates of the Mexican American population are compared with those of white
persons (Carter et al., 1996).
According to the 1990 census, Native Americans comprise more than 500 tribal
organizations and about 1.9 million persons identified themselves as an American Indian
or Alaska native (Carter et al., 1996). High prevalences of diabetes among most Native
American tribes have been reported (Carter et al., 1996). For example, the Pima tribe in
Arizona has one of the highest rates of diabetes in the world (Carter et al., 1996).
The Seattle Japanese-American Community Diabetes Study also found that Asian
Americans and Pacific Islander Americans had a higher prevalence of diabetes than that
reported for the U.S. white population (Carter et al., 1996). Carter et al. reported that
Filipinos had the highest prevalence of diabetes among the four largest ethnic Asian
groups had higher prevalences than those of white persons (Carter et al., 1996). Few
incidence studies on diabetes have been done thus far however, incidence rates in the
United States have been found to be higher in black persons, Mexican Americans, the
Pima tribe and Japanese Americans compared to white individuals (Carter et al., 1996).
c. Gender
The prevalence of prediabetes and diabetes according to gender has been
contradictory. Some studies have found that women suffer more disproportionately from
diabetes while others have found men to have a slightly higher prevalence. For example,
Moore et al. (2003) stated that the prevalence of diabetes in adults is slightly higher in
women and increases significantly with age. Another study which used the 2002 and
2004 core interviews of the U.S. nationally representative Health Retirement Study
(HRS) and the 2003 HRS diabetes-specific mail survey had found that women had
significantly higher HbA1c levels, blood pressure, body mass index and more frequent
occurrence of early complications than men (Chiu & Wray, 2011). In addition, this study
also found that women reported significantly less frequent exercise behavior and had
lower scores than did men on diabetes coping status, perceived control, self efficacy, and
perceived family support, but higher scores on depressive symptoms, compared to men
(Chiu & Wray, 2011).
In contrast, results from a Canadian study, that used the 1996 to 1997 National
Population Health Survey, indicated that males in almost all age groups, had a higher
prevalence of diabetes than females (Choi & Shi, 2001). The only exception was in the
15
(1.5%) (Choi et al., 2001). The overall odds ratio for diabetes was 1.44 comparing males
with females, after adjusting for a number of potential confounders (Choi et al., 2001). In
regards to gender, while this study found a higher proportion of males (54% males, 46%
females) among Canadian patients with diabetes, studies in the United States found a
higher proportion of females (42% males, 58% females) with diabetes (Choi et al., 2001).
Another study evaluated the prevalence and time trends for diagnosed and
undiagnosed diabetes, impaired fasting glucose and impaired glucose tolerance in U.S.
adults based on the Third National Health and Nutrition Examination Survey, 1988-1994
(NHANES III) (Harris, Flegal, Cowie, Eberhardt, Goldstein, Little, Wiedmeyer &
Byrd-Holt, 1998). It was found that for the total prevalence of diabetes, prevalence was similar
for men and women in each age group (Harris et al., 1998). However, the prevalence of
impaired fasting glucose was higher for men than for women in each racial or ethnic
group, and the age standardized rate in men versus women was 1.8 for all races combined
(Harris et al., 1998). Lastly, the total prevalence of diabetes and impaired fasting glucose
combined was estimated to be 15.6 million for men and only 13.4 million for women
(Harris et al., 1998).
d. Education as Socioeconomic Status
The prevalence of type 2 diabetes varies with socioeconomic status (SES) within
different populations. SES is a complex construct and most often different variables such
as education, income, and occupation, that are used to measure it, can reflect different
specific exposures (Robbins, Vaccarino, Zhang & Kasl, 2001). Many studies have found
United States, intragroup comparisons among white persons, black persons, Hispanic
persons, and Japanese Americans show an association between lower socioeconomic
status or education level and higher prevalence of diabetes (Carter et al., 1996). This
finding is due to the fact that large proportions of black and Hispanic populations live in
poverty and have less than a high school education (Carter et al., 1996). Therefore,
socioeconomic status may strongly influence the prevalence of diabetes in these minority
groups (Carter et al., 1996).
Robbins and colleagues examined the association of diabetes with different
measures of SES, education as one of them, within each of 4 strata-African American
women, non-Hispanic White women, African American men and non-Hispanic white
men (2001). The study found that education was a significant predictor of diabetes
prevalence among African American women and that education was also inversely
associated with diabetes prevalence among non-Hispanic white women in particular for
the group with more than 12 years of education (Robbins et al., 2001). However,
education had a weak inverse gradient with diabetes prevalence among non-Hispanic
white men with an odds ratio for those with more than 12 years of education of 0.60
relative to those with less than 9 years of education (Robbins et al., 2001). Similarly,
education did not yield significant associations with diabetes in African American men
(Robbins et al., 2001). The analyses from this study provide strong, consistent evidence
that SES, measured by education, income and occupation, is inversely associated with
type 2 diabetes in both African American and non-Hispanic white women (Robbins et al.,
2001). However, they do not provide such evidence for African American or
17
Another study determined and quantified socioeconomic position (SEP), a
similar measure to SES, inequalities in diabetes in different areas of Europe for men and
women. Similar to the previous mentioned study, it was found that low SEP was related
to a higher prevalence of diabetes (Espelt, Borrell, Roskam, Rodriguez-Sanz, Stirbu,
Dalmau-Bueno, Regidor, Bopp, Martikainen, Leinsalu, Artnik, Rychtarikova, Kalediene,
Dzurova, Mackenbach & Kunst, 2008). For example, men who attained a level of
education equivalent to lower secondary school or less had a prevalence ratio of 1.6
compared with those who attained tertiary level education, whereas the corresponding
value in women was 2.2 (Espelt et al., 2008). In addition, one study found that people
with less than primary education have 2.69 higher risk of having diabetes than those with
primary education or more (Espelt, Goda, Franch&Borrell, 2011).
Furthermore, there is an inverse relationship between SEP, morbidity and
mortality. For example, Saydah and collegues examined disparities in diabetes-related
mortality for socioeconomic status groups in nationally representative U.S. samples
(2010). Results indicated that having less than a high school education was associated
with a twofold higher mortality from diabetes after controlling for age, gender,
race/ethnicity, marital status, and body mass index compared with adults with a college
degree or higher education level (Saydah & Lochner, 2010). In addition, the risk of
diabetes-related death demonstrated a clear gradient from lowest to highest education
level (Saydah et al., 2010). A study by Sims et al. found that the lack of awareness of
diabetes was associated with low education and low occupation in women but not in men
and that the lack of treatment was also associated with low education in women (2011).
Income is another measure that researchers use to measure SES and its constituent
elements which are accepted as being determinants of health. Income is not only a direct
measure of economic resources but also a primary determinant of social prestige and
status in the United States. There is considerable evidence to show that low income is
associated with shorter life expectancies and increased mortality (Rabi et al., 2006).
Research has also found that diabetes may be up to two times more prevalent in low
income populations compared to wealthy populations (Rabi et al., 2006). One study
examined the socioeconomic gradient in diabetes prevalence, awareness, treatment, and
control among African Americans and found that in adjusted models, low-income men
and women had greater probabilities of diabetes than high income men and women
(Sims, Diez Roux, Boykin, Sarpong, Gebreab, Wyatt, Hickson, Payton, Ekunwe &
Taylor, 2011). Associations of low income with diabetes prevalence persisted and
remained statistically significant after risk factor adjustment in both men and women
(Sims et al., 2011). In addition, women had a higher prevalence of diabetes than men
(19.6% vs. 15.9%), but greater awareness (90% vs. 88.2%), treatment (86.8% vs. 84.4%),
and control (39.2% vs. 35.8%) (Sims et al., 2011).
Another study that examined socioeconomic status and diagnosed diabetes
incidence, found that among women, diabetes incidence was inversely associated with
income (Robbins, Vaccarino, Zhang & Kasl, 2005). Among men, a trend toward lower
diabetes incidence with higher income and higher education was evident (Robbins et al.,
2005). This inverse association between income and diabetes risk is complex. However,
it has been speculated that the increased diabetes risk seen in low income groups is
19
A Canadian study by Rabi et al. was conducted to determine whether income is
associated with referral to a diabetes center within a universal health care system (2006).
Results indicated that low income is associated with a higher prevalence of diabetes and a
higher population rate of referral (Rabi et al., 2006) In regard to access to diabetes care, it
is found that individuals from lower socio-economic groups have impaired access to care
reflected in longer wait times and fewer referrals for specialist care (Rabi et al., 2006).
This contributes to the observation of worse health outcomes such as the increased rate of
acute diabetic complications. The impaired access to care may also affect one’s
engagement in diabetes risk reduction behaviors. Rabi et al. suggest that neighborhood
and community level factors contribute to the increased diabetes risk seen in low income
populations (2006). For example, the “built” environment has been shown to be a clear
barrier to physical activity in poorer neighborhoods (Rabi et al., 2006). In addition, low
income communities have been shown to have less biomass and park-space compared to
wealthier communities (Rabi et al., 2006). There may also be a perception that it is less
safe to walk in a poorer neighborhood which deters not only physical activity but erodes
the sense of community among residents (Rabi et al., 2006). Robbins and colleagues
suggest that while most clinicians who treat patients with diabetes in the United States are
aware that type 2 diabetes occurs more frequently among racial and ethnic minorities,
many are not aware that it is also more likely to appear among patients with low SES,
regardless of race or ethnicity (2005). Findings of this study state that effective,
population-based interventions to decrease obesity and improve health behaviors may
reduce, but not eliminate, SES disparities in diabetes incidence (Robbins et al., 2005).
Obesity is defined medically as a state of increased adipose tissue of sufficient
magnitude that may result in adverse health consequences. (Gómez-Ambrosi, Silva,
Galofré, Escalada, Santos, Gil, Valentí, Rotellar, Ramírez, Salvador &Frühbeck, 2011).
Therefore, obesity is a major modifiable risk factor for type 2 diabetes and many other
diseases (Choi et al., 2001). BMI has been traditionally used as a surrogate measure of
adiposity and is the most frequently used diagnostic tool in the current classification
system for obesity (Gómez-Ambrosi et al., 2011). Many studies have shown consistent
results that the prevalence of diabetes increases with obesity (BMI) in both males and
females. Choi et al. found a differential effect of obesity on the prevalence of diabetes in
males and females (2001). For males, the prevalence of diabetes started to increase when
BMI reached 27 (overweight category) but for females the prevalence of diabetes started
to increase at a lower BMI level of 25 (Choi et al., 2001). This is consistent with other
studies, which have shown that the per unit increase in BMI had a larger effect on the risk
of diabetes among women than men. However, results of this study also indicate the need
to use different criteria to define obesity for women and men. Men on average have a
larger body build than women and therefore obesity should be defined differently based
on BMI (Choe et al., 2001).
Another study determined whether the associations of BMI and fat distribution
with diabetes risk are modified by race. Previous research on the prevalence and
incidence of type 2 diabetes in the U.S. has consistently shown the frequency of diabetes
to be higher among black than among white Americans and to be higher among obese
individuals and those with centralized fat distribution (Resnick, Valsania, Halter & Lin,
21
(STR) among blacks and showed that blacks were at a substantially higher 16-year risk of
developing diabetes than whites (Resnicketal., 1998). Resnick et al. discovered that the
age-adjusted cumulative incidence of diabetes was greater with increasing BMI in all
race-sex groups (1998). For example, blacks were at higher risk of diabetes at all levels
of BMI compared with whites. However, at lower BMI, the relative risk of diabetes for
black: white subjects was much larger than at higher levels of BMI (Resnick et al., 1998).
Studies have also focused on modifying an individual’s BMI and weight to
prevent and reduce the risk for diabetes. For example, a study by the Diabetes Prevention
Program identified individuals who were at risk for developing diabetes due to elevated
fasting plasma glucose or impaired glucose tolerance levels that were not yet in the
diagnostic range, in order to determine if the medication metformin or an intensive
lifestyle intervention, which consists of a goal of 7% weight loss and 150 min/wk of
moderate physical activity, could delay or prevent the onset of diabetes (Crandall,
Knowler, Kahn, Marrero, Bray, Haffner, Hoskin& Nathan, 2008). Results indicated that
fifty percent of the lifestyle-intervention group lost 7% of their body weight and that the
3-year incidence of diabetes in the metformin group was 31% lower than that in the
placebo group (Crandall et al., 2008). In addition, the incidence of diabetes was 58%
lower in the lifestyle group than in the placebo group (Crandall et al., 2008). Weight loss
was the predominant predictor of reduced diabetes incidence, with a 16% reduction in
risk per kilogram of weight lost (Crandall et al., 2008). The effectiveness of the Diabetes
Prevention Program lifestyle intervention was similar in all ethnic groups and both sexes
and was greatest in older participants (Crandall et al., 2008).
The incidence of type 2 diabetes is increasing rapidly and research has shown a
close relationship between hypertension and type 2 diabetes. Despite this close
relationship, little information exists on the relationship of blood pressure levels with the
subsequent development of type 2 diabetes (Conen, Ridker, Mora, Buring & Glynn,
2007). In addition, few studies have analyzed the precise relationship between blood
pressure and incident type 2 diabetes. Gress et al. found that individuals with
hypertension had a relative risk of 2.34 (95% confidence interval 2.16-2.73) of
developing type 2 diabetes compared with individuals without hypertension (2000).
However, no multivariable adjustment of this association was performed in their study
(Conen et al., 2007). Recently, hypertension has further emerged as a potential risk factor
based on several longitudinal studies’ findings that higher blood pressure is associated
with increased risk of diabetes (Wei, Coady, Goff, Brancati, Levy, Selvin, Vasan& Fox,
2011). However, it still remains unclear whether hypertension is associated with diabetes
above and beyond other known risk factors such as age, race, and adiposity (Wei et al.,
2011).
Wei et al. examined the association between high blood pressure and incident
type 2 diabetes in African Americans and whites aged 35 to 54 years at baseline (2011).
Results indicated that 14.6% of African Americans and 7.9% of whites developed
diabetes and that the age-adjusted incidence was increasingly higher across increasing
blood pressure groups, with the incidence lowest in the normal blood pressure group and
highest in the hypertension group (Wei et al., 2011). In addition, after adjustment for age,
sex, BMI, fasting glucose, HDL cholesterol and triglycerides, prehypertension or
23
diabetes in whites, but not African Americans (Wei et al., 2011). Hazard ratios for
developing diabetes among normotensive, prehypertensive, and hypertensive African
Americans versus normotensive whites were 2.75, 2.28, and 2.36 respectively (Wei et al.,
2011). Wei et al. also suggested that in African Americans the higher incidence of
diabetes among hypertensive individuals may be explained by concomitantly greater
adiposity and other cardiometabolic risk factors (2011). In whites, the association of both
prehypertension and hypertension with incident diabetes is partially explained by these
and other risk factors. However, regardless of baseline blood pressure status, research has
found that African Americans have a greater risk of developing diabetes than whites (Wei
et al., 2011).
Furthermore, Conen et al. conducted a prospective cohort study and examined the
relationship of blood pressure and blood pressure progression with the subsequent
development of type 2 diabetes in women (2007). Results showed that the baseline blood
pressure and blood pressure progression are strong and independent predictors of incident
type 2 diabetes among initially healthy women (Conen et al., 2007). During the median
follow-up of 10.2 years, 1672 out of 38172 women developed type 2 diabetes (Conen et
al., 2007). After 10 years of follow up, 1.4, 2.9, 5.7, and 9.4% of women across the four
baseline blood pressure categories developed type 2 diabetes (Conen et al., 2007). In
addition, women with baseline hypertension had a seven-fold increased risk of
developing diabetes compared with women with optimal blood pressure (Conen et al.,
2007). Even after multivariable adjustment, these risk factors were attenuated but
remained statistically significant (Conen et al., 2007). Thus, there was still a three-fold
women with optimal blood pressure (Conen et al., 2007). Lastly, women progressing to
hypertension had a 64% increased risk of incident diabetes, and this risk more than
doubled in those with baseline hypertension (Conen et al., 2007).
h. Cholesterol, HDL and LDL
Persons with type 2 diabetes feature important modification of both low density
lipoprotein, LDL, and high density lipoprotein particles (Krauss, 2004). Insulin resistance
and type 2 diabetes are associated with a clustering of interrelated plasma lipid and
lipoprotein abnormalities, which include reduced HDL cholesterol, a predominance of
small dense LDL particles, and elevated triglyceride levels (Krauss, 2004). It is found
that these abnormalities occur in many patients despite normal LDL cholesterol levels
(Krauss, 2004). Lipid modification is also a feature of the insulin resistance syndrome,
which underlies many cases of type 2 diabetes (Krauss, 2004). In fact, pre-diabetic
individuals often exhibit an atherogenic pattern of risk factors that includes higher levels
of total cholesterol, LDL cholesterol, and triglycerides and lower levels of HDL
cholesterol than non diabetic individuals (Krauss, 2004). Although the plasma LDL
cholesterol level is usually normal in type 2 diabetic patients, metabolism of LDL is
significantly modified (Krauss, 2004). The increased production of precursors of small
dense LDL particles results from the increased hepatic production and/or retarded
clearance from plasma of large VLDL (Krauss, 2004). Plasma VLDL levels correlate
with increased density and decreased size of LDL which in turn is inversely related to
plasma levels of HDL (Krauss, 2004). It is found that small dense LDL particles appear
to arise from the intravascular processing of specific larger VLDL precursors through a
25
lipolytic products through the action of cholesteryl ester transfer protein, together with
hydrolysis of triglyceride and phospholipids by hepatic lipase, leads to increased
production of small dense LDL particles (Krauss, 2004). The reductions in HDL
associated with type 2 diabetes and insulin resistance are multifactorial, but a major
factor appears to be increased transfer of cholesterol from HDL to triglyceride-rich
lipoproteins, with reciprocal transfer of triglyceride to HDL (Krauss, 2004).
Triglyceride-rich HDL particles are hydrolyzed by hepatic lipase and, as a result are rapidly
catabolized and cleared from plasma (Krauss, 2004). The combination of increased
production and decreased catabolism of triglyceride-rich lipoproteins accentuates
hypertriglyceridemia (Kreisberg, 1998). Hypertriglyceridemia changes the composition
of all lipoproteins, enriches them with triglycerides, and makes them better substrates for
hepatic lipase, which leads to decreased levels of HDL cholesterol and increased
production of LDL cholesterol (Kreisberg, 1998). Therefore, as triglycerides increase
within the “normal range”, abnormalities in HDL and LDL become more apparent.
Krauss also found that behavioral interventions such as diet and exercise can improve
diabetic dyslipidemia however, for most patients, pharmacological therapy is needed to
reach treatment goals (2004). In addition, there are several classes of medications that can
be used to treat lipid and lipoprotein abnormalities associated with insulin resistance and
type 2 diabetes. Epidemiologic and intervention studies have shown significant
improvement in the features of diabetic dyslipidemia with medical nutrition therapy and
physical activity (Krauss, 2004).
Lipid abnormalities in patients with type 2 diabetes are likely to play an important
role in the development atherogenesis. These lipid disorders include not only quantitative
but also qualitative abnormalities of lipoproteins (Vergés, 2005). It is found that plasma
triglyceride level is frequently increased in type 2 diabetes which is due to an augmented
number of VLDL and IDL particles (Vergés, 2005). In addition, research has shown that
reducing excess triglycerides in the blood can lower you chance of developing diabetes as
well as heart disease and other problems (MSN, 2011). In a 10 year study of otherwise
healthy men, researchers found that those with the lowest triglyceride levels were least
likely to develop diabetes (MSN, 2011). In addition, men with high triglycerides who
lowered them with healthy lifestyle changes had a diabetes risk that was similar to those
who never had a triglyceride problem at all. The results of this study were true even when
controlling for diabetes risk factors such as blood pressure, physical activity, body mass
index, family history and more (MSN, 2011). Lastly, researchers don’t fully understand
the relationship between triglycerides and diabetes. However, they believe that excess
27
CHAPTER III
METHODOLOGY
3a. Data Source and Study Population
The data for this study came from the 2007-2008 National Health and Nutrition
Examination Survey, 2007-2008 NHANES. This data source is provided by the National
Center for Health Statistics, NCHS, and is an annual representative survey of the U.S.
civilian non-institutionalized population. The NHANES program began in the early
1960s and since then has been conducted as a series of surveys focusing on different
population groups or health topics (CDC, 2009). NHANES assesses the health and
nutritional status of adults and children in the U.S. (CDC, 2009). This survey is unique in
that it combines interviews and physical examinations. Survey participants are
interviewed at home and are invited to a mobile examination center to undergo various
examinations and laboratory measurements (Geiss et al., 2010). The survey examines a
nationally representative sample of about 5,000 persons each year in which these persons
are located in various counties across the country (CDC, 2009). The interview portion of
this survey consists of demographic, socioeconomic, dietary, and health-related
questions, while the examination component includes medical, dental, and physiological
measurements (CDC, 2009). Furthermore, this is the only national survey that reports and
captures information about diabetes and prediabetes from an interview as well as
informed consent is obtained from each participant for the interview as well as the
laboratory examination (CDC, 2009). Findings from NHANES are used to determine the
prevalence of major diseases, such as diabetes, and risk factors for these diseases. Risk
factors, those aspects of a person’s lifestyle, constitution, heredity, or environment that
may increase the chances of developing a certain disease or condition are also examined
(CDC, 2009). In addition, the survey sample is selected in order to represent the U.S.
population of all ages. To produce reliable statistics, NHANES over-samples persons 60
years in age and older, African Americans and Hispanics (CDC, 2009). All participants
of the survey visit the physician and have body measurements, laboratory examination,
and dietary interviews. Since the U.S. population has been experiencing a dramatic
growth in the number of older people, particular attention and extensive examination is
performed for this population in question (CDC, 2009). NHANES information and data
are made available to data users and researchers around the world through the internet
and on easy-to-use CD-ROMs (CDC, 2009). Therefore, research organizations,
universities, health care providers and educators benefit from using this data source. In
addition, results from NHANES benefit people in the United States in important ways.
For example, facts about the distribution of health problems and risk factors in the
population provide researchers important clues to the causes of disease (CDC, 2009).
For this study, data from the 2007-2008 NHANES diabetes questionnaire,
laboratory, examination and demographic files were used. The demographic file provides
family-level and individual-level information. All survey participants who have a
household interview record have a demographics file record (CDC, 2009). The
29
interview and examination sample weights, languages of interview for the household and
examination interviews, information about household reference person, proxy respondent
codes and demographic variables about the survey participant (CDC, 2009). Persons 16
years of age and older and emancipated minors were interviewed directly and a
household interview was conducted in-person with an interviewer (CDC, 2009). In this
study the following demographic variables were used: age, gender, ethnicity, education
and annual family income. The examination variables included in this study were
diastolic blood pressure, systolic blood pressure and body mass index. Laboratory
variables that were used in this study included HDL, LDL, triglycerides and total
cholesterol. The laboratory data also contains measures such as the OGTT and fasting
blood glucose levels, FPG. This helped identifying those individuals that had
undiagnosed diabetes. Standard diagnostic criteria were used to determine whether an
individual had undiagnosed diabetes based on OGTT and FPG values. If an individual
had an OGTT greater than 200 and FPG greater than 126 than the individual was
excluded from the study. These laboratory values were the recommended values from the
American Diabetes Association (2011).
3b. Eligibility Criteria
The diabetes questionnaire was used to determine those that are aware of their
risk for diabetes (prediabetes), those that have diabetes and those individuals that are
engaging in diabetes risk reduction behaviors. The questions asked to determine if an
individual is at risk for diabetes was ever told you have prediabetes and ever told have
health risk for diabetes. A new variable was than created called awareness of diabetes
have health risk for diabetes and was the main independent variable in the study. Only
those individuals aware of their risk for diabetes were included in this study. The
question asked to determine if an individual has diabetes was doctor told has diabetes. If
the individual was diagnosed with diabetes, than they were excluded from the study.
Questions that determined if an individual was reducing their risk for diabetes were are
you controlling weight, are you increasing physical activity, are you reducing fat/calories
in diet, past year told control weight, past year told increase physical activity and past
year told to reduce fat/calories in diet. A new variable called diabetes risk reduction
behavior was than created from the ongoing risk behavior questions: are you controlling
weight, are you increasing physical activity and are you reducing fat/calories in diet and
was the main dependent variable of the study. The total sample before exclusions were
made was 10149. However, after the exclusions according to the criteria mentioned, the
total sample of NHANES respondents that met the study eligibility criteria was 4083.The
4083 participants included in this study were also aged 20 years and above and were
non-Hispanic black, non-non-Hispanic white and Mexican American in ethnicity. In addition,
males and females of the total sample were examined separately. It was found that 2007
(49.2%) of the study respondents were males and 2076 (50.8%) were females.
3c. Independent Variables
The independent variables were obtained from the demographic, examination,
laboratory and questionnaire files. These included age, ethnicity, education, annual
family income, BMI, hypertension, mean systolic blood pressure, mean diastolic blood
31
complete information on the demographic, laboratory, examination and questionnaire
component of the survey was eliminated from the study.
Aware of Diabetes Risk:
This variable was created from the questions: ever told you have prediabetes and
ever told have health risk for diabetes. This was the main independent variable.
Diabetes Risk Reduction Behavior:
This variable was created from the ongoing diabetes risk reduction behavior questions
which include: are you controlling weight, are you increasing physical activity and are
you reducing fat/calories in diet. This was the dependent variable.
Age:
Age was reported as a whole number in years at time of screening. Only those
individuals 20 years and above were included in this study.
Gender:
Gender of the participant was reported as either male or female and coded as 0 for
male and 1 for female.
Ethnicity:
Ethnicity was categorized into three groups: non-Hispanic whites, non-Hispanic
blacks and Mexican Americans.
The education variable is the highest grade or level of education completed by
adults 20 years and older (CDC, 2009). The response categories are: less than 9th grade education, 9-11th grade education (includes 12th grade and no diploma), High school
graduate /GED, some college or associates (AA) degree, and college graduate or higher
(CDC, 2009). Education level was self-reported and categorized into 3 groups: less than
high school, high school, and college.
Annual Family Income:
This variable is the total family income variable and is released as an income
range value. The income section of the household interview includes several questions
about sources of income including wages, retirement income, disability payments,
interest income, and assistance programs, but the amounts of income from each of the
income sources were not obtained (CDC, 2009). The respondent was asked to report total
family income for themselves and the other members of their family in dollars (CDC,
2009). Annual Family income was categorized into three groups: less than $20,000,
$20,000-$74,999 and $75,000 and above.
BMI:
Body mass index was reported as kg/m2. BMI was categorized into three groups: less
than 25 as “normal”, 25 to 29.999 as “overweight” and greater than or equal to 30 as
“obese”.
33
The hypertension variable was created from questions of the blood pressure
questionnaire and mean systolic and diastolic blood pressure readings. Questions
included: taking prescription for hypertension, told have prehypertension and borderline
hypertension. If the survey participant also had a mean systolic blood pressure reading
greater than 140 or a mean diastolic blood pressure reading greater than 90 than they
were considered to have hypertension. Recommendations for the blood pressure readings
came from the American Heart Association (2011).
Mean Systolic Blood Pressure:
The systolic blood pressure readings came from the examination portion of the
survey. The survey participant would rest quietly in a sitting position for 5 minutes
determining the maximum inflation level (CDC, 2009). Three consecutive systolic blood
pressure readings were taken to obtain an accurate blood pressure. Systolic blood
pressure readings were reported in mm Hg. A mean systolic blood pressure reading was
computed from the three readings. All blood pressure determinations were taken in the
mobile examination center.
Mean Diastolic Blood Pressure:
The diastolic blood pressure readings also came from the examination portion of
the survey. The survey participant would rest quietly in a sitting position for 5 minutes
determining the maximum inflation level (CDC, 2009). Three consecutive diastolic blood
pressure readings were taken to obtain an accurate blood pressure. Diastolic blood