Negative Bacteria by Use of Matrix-Assisted Laser Desorption
Ionization–Time of Flight Mass Spectrometry and the Bruker Biotyper
Bradley A. Ford,* Carey-Ann D. Burnham
Department of Pathology & Immunology, Washington University School of Medicine, St. Louis, Missouri, USA
Matrix-assisted laser desorption ionization–time of flight mass spectrometry (MALDI-TOF MS) might complement and one day
replace phenotypic identification of bacteria in the clinical microbiology laboratory, but there is no consensus standard
regard-ing the requirements for its validation prior to clinical use in the United States. The objective of this study was to assess the
pre-analytical variables influencing Gram-negative identification by use of the Bruker Biotyper MALDI-TOF MS system, including
density of organism spotting on a stainless steel target plate and the direct overlay of organisms with formic acid. A heavy smear
with formic acid overlay was either superior or equivalent to alternative smear conditions. Microbiological preanalytical
vari-ables were also assayed, such as culture medium, growth temperature, and use of serial subculture. Postanalytical analysis
in-cluded the application of modified species-level identification acceptance criteria. Biotyper identifications were compared with
those using traditional phenotypic methods, and discrepancies were resolved with 16S rRNA gene sequencing. Compared to the
recommended score cutoffs of the manufacturer, the application of optimized Biotyper score cutoffs for species-level
identifica-tion increased the rate of identificaidentifica-tion by 6.75% for the enteric negative bacteria and 4.25% for the nonfermenting
Gram-negative bacteria. Various incubation temperatures, growth medium types, and repeat subcultures did not result in
misidentifi-cation. We conclude that the Bruker MALDI Biotyper is a robust system for the identification of Gram-negative organisms in the
clinical laboratory and that meaningful performance improvements can be made by implementing simple pre- and
postanalyti-cal techniques.
M
atrix-assisted laser desorption ionization–time of flight
mass spectrometry (MALDI-TOF MS) employs soft
ioniza-tion to detect individual intact biomolecules within complex
so-lutions. Practical use of MALDI-TOF has been facilitated by the
development of matrices, such as
␣-cyano-4-hydroxycinnamic
acid (
1
). While the potential for the identification of bacteria by
their individual mass spectrometric “fingerprints” has long been
appreciated (
2
), the adoption of MALDI-TOF MS in clinical
mi-crobiology laboratories in the United States has been hindered
until recently by a lack of available platforms with databases of
bacterial whole-cell MALDI-TOF reference spectra.
Recent studies using the Bruker Biotyper MALDI-TOF MS
platform have revealed that this system might correctly identify
bacteria to the species level 95% of the time, with the remaining
5% comprising unidentified or erroneously identified isolates (
3
,
4
). These studies invariably used Bruker’s recommended scoring
cutoffs (a Biotyper score of
ⱖ2.0 for species-level identification
and
ⱖ
1.7 for genus-level identification) to define the confidence
with which a correct identification had been made. Alatoom and
colleagues (
5
) noted that the preparatory extraction of the
pro-tein fraction of Gram-positive organisms was necessary to
ob-tain the species-level identification score recommended by
Bruker. This raised questions of how often extraction would be
used in routine practice compared to spotting whole cells
di-rectly from culture medium onto MALDI-TOF target plates
and whether the cutoffs supplied by the manufacturer are
op-timal for all classes of bacteria.
Subtleties of the MALDI-TOF analytical techniques have the
potential to modulate performance. The objective of this study
was to validate the Bruker Biotyper system for clinical use in
iden-tifying Gram-negative enteric and non-glucose-fermenting
or-ganisms, while also assessing the impact of variables routinely
en-countered in the clinical laboratory. We focused on variables that
are encountered in routine clinical practice in order to derive a
comprehensive protocol for how Gram-negative clinical isolates
might be optimally identified by use of MALDI-TOF MS. An
ac-companying paper by McElvania TeKippe et al. (
6
) focuses on the
optimization of the Bruker Biotyper system for identification of
Gram-positive bacteria.
(This work was presented in part at the 22nd Annual European
Congress of Clinical Microbiology and Infectious Diseases,
Lon-don, England, April 2012.)
MATERIALS AND METHODS
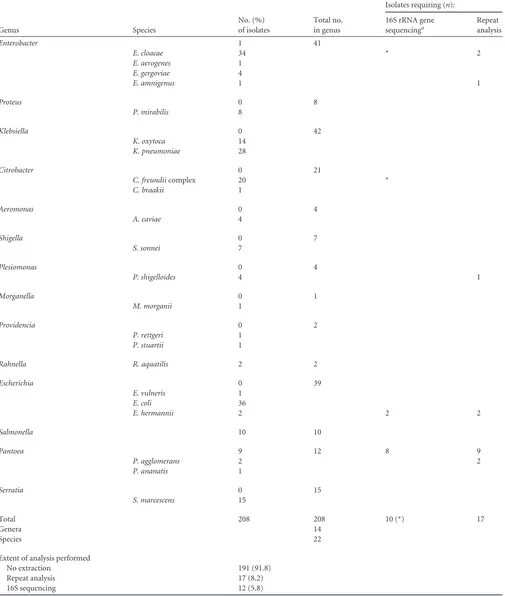
Clinical isolates.The clinical isolates tested in this study were recovered in routine clinical workflow from specimens submitted to the St. Louis Children’s Hospital Microbiology Laboratory from April 2011 to August 2011; unusual isolates from freezer stocks were also used (Tables 1and2). Cultures were processed per standard laboratory practices and, once pure culture was obtained, enteric Gram-negative bacteria (EGNB) and non-glucose-fermenting/fastidious Gram-negative bacteria (NFGNB) were
Received12 July 2012 Returned for modification7 August 2012
Accepted9 February 2013
Published ahead of print20 February 2013
Address correspondence to Carey-Ann D. Burnham, [email protected]. * Present Address: Bradley A. Ford, Department of Pathology, University of Iowa Hospitals and Clinics, Iowa City, Iowa, USA.
Copyright © 2013, American Society for Microbiology. All Rights Reserved. doi:10.1128/JCM.01803-12
on May 16, 2020 by guest
http://jcm.asm.org/
TABLE 1Identity and analysis of isolates for enteric Gram-negative bacteria
No. (%) of isolates
Total no. in genus
Isolates requiring (n):
Genus Species
16S rRNA gene sequencinga
Repeat analysis
Enterobacter 1 41
E. cloacae 34 * 2
E. aerogenes 1
E. gergoviae 4
E. amnigenus 1 1
Proteus 0 8
P. mirabilis 8
Klebsiella 0 42
K. oxytoca 14
K. pneumoniae 28
Citrobacter 0 21
C. freundiicomplex 20 *
C. braakii 1
Aeromonas 0 4
A. caviae 4
Shigella 0 7
S. sonnei 7
Plesiomonas 0 4
P. shigelloides 4 1
Morganella 0 1
M. morganii 1
Providencia 0 2
P. rettgeri 1
P. stuartii 1
Rahnella R. aquatilis 2 2
Escherichia 0 39
E. vulneris 1
E. coli 36
E. hermannii 2 2 2
Salmonella 10 10
Pantoea 9 12 8 9
P. agglomerans 2 2
P. ananatis 1
Serratia 0 15
S. marcescens 15
Total 208 208 10 (*) 17
Genera 14
Species 22
Extent of analysis performed
No extraction 191 (91.8)
Repeat analysis 17 (8.2)
16S sequencing 12 (5.8)
a
Each asterisk indicates that oneE. kobeiand oneC. freundiiisolate (seeTable 5) had correct MALDI-TOF identifications to the species level but were sequenced because of an inadequate phenotypic identification. These did not require repeat analysis; by definition, the rest of the isolates for which 16S rRNA gene sequencing was performed required repeat analysis. Other isolates (right column) were identified on repeat analysis, averting 16S rRNA gene sequencing.
on May 16, 2020 by guest
http://jcm.asm.org/
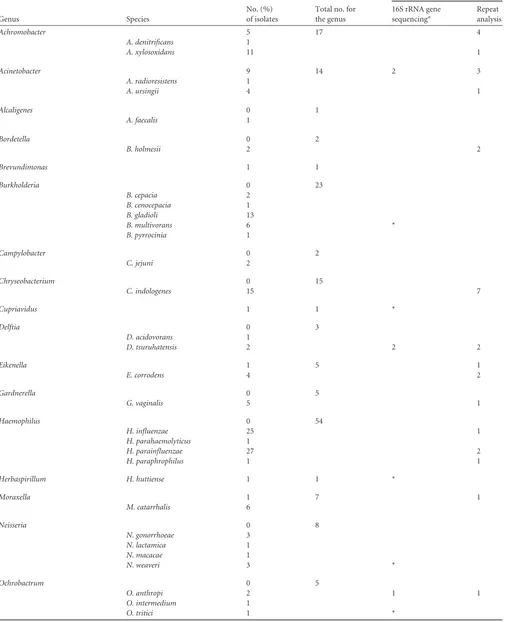
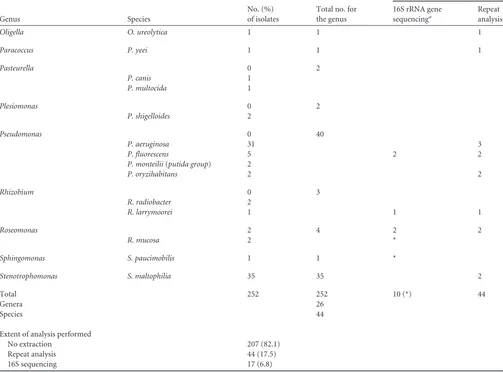
TABLE 2Identity and analysis of isolates, non-glucose-fermenting Gram-negative bacteria
Genus Species
No. (%) of isolates
Total no. for the genus
Isolates requiring (n):
16S rRNA gene sequencinga
Repeat analysis
Achromobacter 5 17 4
A. denitrificans 1
A. xylosoxidans 11 1
Acinetobacter 9 14 2 3
A. radioresistens 1
A. ursingii 4 1
Alcaligenes 0 1
A. faecalis 1
Bordetella 0 2
B. holmesii 2 2
Brevundimonas 1 1
Burkholderia 0 23
B. cepacia 2
B. cenocepacia 1
B. gladioli 13
B. multivorans 6 *
B. pyrrocinia 1
Campylobacter 0 2
C. jejuni 2
Chryseobacterium 0 15
C. indologenes 15 7
Cupriavidus 1 1 *
Delftia 0 3
D. acidovorans 1
D. tsuruhatensis 2 2 2
Eikenella 1 5 1
E. corrodens 4 2
Gardnerella 0 5
G. vaginalis 5 1
Haemophilus 0 54
H. influenzae 25 1
H. parahaemolyticus 1
H. parainfluenzae 27 2
H. paraphrophilus 1 1
Herbaspirillum H. huttiense 1 1 *
Moraxella 1 7 1
M. catarrhalis 6
Neisseria 0 8
N. gonorrhoeae 3
N. lactamica 1
N. macacae 1
N. weaveri 3 *
Ochrobactrum 0 5
O. anthropi 2 1 1
O. intermedium 1
O. tritici 1 *
(Continued on following page)
on May 16, 2020 by guest
http://jcm.asm.org/
identified according to the standard operating procedures (SOPs) of our laboratory. This included a variety of phenotypic, automated, and com-mercial methods, such as Vitek 2 (bioMérieux, St. Louis, MO), Phoenix (Becton-Dickson, Sparks, MD), API 20 NE (bioMérieux), and other man-ual identification methods. In parallel to routine processing, colonies were applied to a MALDI-TOF target as part of the normal workflow and were batch processed for MS analysis at the end of the workday. MALDI-TOF operators were blinded to the phenotypic identities of the organisms. The Biotyper scoring system involves a pattern-matching algorithm that queries a database of spectra to generate a score reflecting the probability that an identification is correct. Per the recommendations of the manu-facturer, a score ofⱖ2.0 is considered an accurate species-level identifi-cation, a score from 1.7 to 1.99 is considered accurate to the genus level and a score of⬍1.7 is considered unreliable. For our study, positive iden-tifications were defined as those with a Biotyper score ofⱖ2.0 when ana-lyzed in automatic mode under any of four spotting conditions (described below); isolates with lower scores were reanalyzed in manual mode. If a score ofⱖ2.0 was still not achieved, the sample was subcultured for re-processing the next day. Failure to obtain an identification after replating prompted chemical extraction of the isolate. Failure to identify the
organ-ism after extraction, or any MALDI-TOF/phenotypic discrepant identifi-cation, prompted 16S rRNA gene sequencing of the isolate. Isolate char-acteristics and the extent of analysis are summarized inTables 1and2.
[image:4.585.41.544.91.463.2]Individual MALDI-TOF analyses.Two hundred eight EGNB isolates (97.6% from the regular clinical workflow) and 252 NFGNB isolates (88.9% from the regular clinical workflow) were spotted using four meth-ods for MALDI-TOF analysis as follows. For a “heavy smear,” individual colonies were picked with the tip of a sterile wooden toothpick and spot-ted with a circular motion onto a 96-spot reusable Bruker stainless steel MALDI target plate (part no. 224990, Bruker Daltonics, Billerica, MA). Without picking up more material from the original colony, the isolate was spotted again to the adjacent spot on the MALDI target, for a “light smear.” Heavy and light smears were repeated, allowed to dry, and over-laid with 1l 100% formic acid. Once dry, all four spots were overlaid with 1 l of an ␣-cyano-4-hydroxycinnamic-acid matrix (part no. 255344, Bruker). Two microliters of bacterial test standard (BTS) (part no. 255343, Bruker), prepared according to the instructions of the man-ufacturer, were plated in duplicate for each run for calibration and quality control purposes. Identifications were assigned using the Bruker Biotyper software v3.0.
TABLE 2(Continued)
Genus Species
No. (%) of isolates
Total no. for the genus
Isolates requiring (n):
16S rRNA gene sequencinga
Repeat analysis
Oligella O. ureolytica 1 1 1
Paracoccus P. yeei 1 1 1
Pasteurella 0 2
P. canis 1
P. multocida 1
Plesiomonas 0 2
P. shigelloides 2
Pseudomonas 0 40
P. aeruginosa 31 3
P. fluorescens 5 2 2
P. monteilii(putida group) 2
P. oryzihabitans 2 2
Rhizobium 0 3
R. radiobacter 2
R. larrymoorei 1 1 1
Roseomonas 2 4 2 2
R. mucosa 2 *
Sphingomonas S. paucimobilis 1 1 *
Stenotrophomonas S. maltophilia 35 35 2
Total 252 252 10 (*) 44
Genera 26
Species 44
Extent of analysis performed
No extraction 207 (82.1)
Repeat analysis 44 (17.5)
16S sequencing 17 (6.8)
aEach asterisk indicates that one isolate each ofC. pauculus,B. multivorans,N. weaveri,S. paucimobilis,R. mucosa,H. huttiense, andO. tritici(seeTable 5) had correct MALDI-TOF identifications to the species level but were sequenced because of an inadequate or incorrect phenotypic identification. These did not require repeat analysis; by definition, the rest of the isolates for which 16S rRNA gene sequencing was performed required repeat analysis. Other isolates (right column) were identified on repeat analysis, averting 16S rRNA gene sequencing.
on May 16, 2020 by guest
http://jcm.asm.org/
Medium, temperature, and subculture studies.A subset of 24 di-verse isolates of EGNB (Table 3, footnotea) were cultured on sheep blood, MacConkey, chocolate, Hektoen enteric, blood with ampicillin, and MacConkey-sorbitol agars and were analyzed as described above after overnight incubation at 35°C (under 5% CO2atmosphere for sheep blood
and chocolate agars and room air for all others). Twenty-five diverse iso-lates of NFGNB (Table 3, footnoteb) were cultured on sheep blood, Mac-Conkey, chocolate, oxidation-fermentation polymyxin-bacitracin-lac-tose (OFPBL), andHaemophilusisolation plate (HIP) agars and were analyzed as described above after overnight incubation at 35°C (under the atmosphere conditions described above).
For temperature studies, the isolates from the medium studies were subcultured to MacConkey agar, incubated at 35°C in room air for 24 h, and then incubated at 35°C, 4°C, and room temperature for 5 consecu-tive days and analyzed using the four direct smear techniques de-scribed above. For subculture studies, the isolates from the medium studies were subcultured to MacConkey agar once per day for 5 con-secutive days and were analyzed four times as described above on days 3, 4, and 5. All media for the medium, temperature, and subculture studies were purchased from Remel (Lenexa, KS).
Organism extraction.For the extraction protocol (5,7), a single large colony was transferred to a microcentrifuge tube containing 300l of molecular-grade water. To this, 900l of 100% ethanol was added, and the solution was vortexed and centrifuged at 13,780⫻gfor 2 min. The supernatant was decanted completely and the pellet was resuspended in 50l of 70% formic acid and vortexed, and then it was mixed with 50l of 100% acetonitrile and vortexed again. This mixture was centrifuged, and 1l of the supernatant was plated to a steel target, allowed to dry, overlaid with matrix, and analyzed as described above. All reagents were high-performance liquid chromatography (HPLC) grade or better.
16S rRNA gene sequencing and sequence analysis.Samples that were not assigned a Biotyper score ofⱖ2.0 using any of the four direct smear techniques, or those whose MALDI-TOF identification was discrepant with the identification determined by traditional phenotypic methods, were identified by use of standard 16S rRNA gene sequencing (8,9). The resulting sequences were aligned with the GenBank nonredundant/nucle-otide collection (nr/nt) (10), Ribosomal Database Project (RDP) (11), and GreenGenes databases (12). Interpretation of sequencing results was in accordance with the criteria of the CLSI MM18-A guideline (9).
Supplemental testing and taxonomic resolution.For EGNB, the iso-lates identified by MALDI-TOF asEscherichia coliwere confirmed by an evaluation of lactose fermentation and the use of a spot indole test; if an isolate was lactose and indole negative, its identity was changed toShigella sp. (based on our local epidemiology) (13). Any isolate identified as
Raoultella ornithinolyticawas tested for ornithine decarboxylase activity (14) and, if negative, its identity was changed toKlebsiella oxytoca(13,15). Citrobacterand Enterobacter species identified by MALDI-TOF were grouped as “Citrobacter freundiicomplex” or “Enterobacter cloacae com-plex,” respectively, if it was appropriate in accordance with how these organisms were routinely reported in the clinical laboratory.
For NFGNB, the genomovars ofBurkholderia cepaciawere grouped as “B. cepaciacomplex” for reporting and interpretation purposes, and sub-species within thePseudomonas fluorescens, Pseudomonas putida, and Pseudomonas aeruginosagroups were each reported to the group level, respectively.
Statistical analysis.Tests of statistical significance (specified where they are presented) were performed with Systat 12 software (Systat Soft-ware, Inc., Chicago, IL). APvalue ofⱕ0.05 was considered significant.
RESULTS
[image:5.585.40.545.78.215.2]MALDI-TOF performance using manufacturer’s scoring
cut-offs.
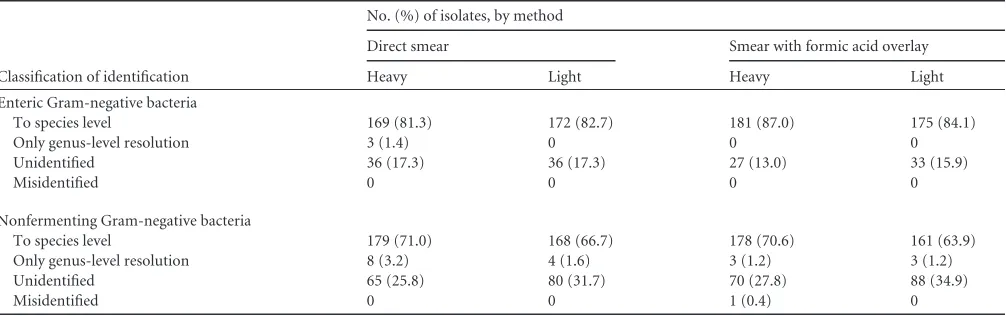
For EGNB, Biotyper scores for both direct light (average
score, 2.17) and heavy smear with formic acid overlay (average
score, 2.19) were statistically superior to those for standard direct
spotting with a heavy smear (average score, 2.07), according to a
repeated-measures analysis of variance (ANOVA) comparing all
possible combinations of groups (
P
⬍
0.01); the heavy smear with
formic acid group demonstrated the highest rate of identification
to the species level (
Table 4
). Notably, formic acid treatment
re-duced the number of unidentified isolates from 36 to 27. For
NFGNB, a Biotyper score for a light formic acid-treated smear was
statistically inferior (
P
⬍
0.01) to the heavy-smear formic
acid-treated isolates, but otherwise, all other pairs of treatments were
not statistically different by repeated-measures ANOVA
compar-ing the scores for all possible combinations of groups. Superior
scores for the heavy-smear formic acid-overlaid group were
re-flected by a higher rate of species-level identification using the
cutoff of the manufacturer (70.6% versus 63.9%, for heavy- and
light-smear formic acid-overlaid groups, respectively [
Table 4
]).
This is in contrast to EGNB, where formic acid treatment did not
result in a statistically different rate of identification for this organism
group (
Table 4
). There was only one misidentification in this data set,
which was in the formic acid-treated heavy-smear group of the
NFGNB. An isolate of
Stenotrophomonas maltophilia
was falsely
iden-tified as
Cupriavidus pauculus
, with a Biotyper score of 2.08.
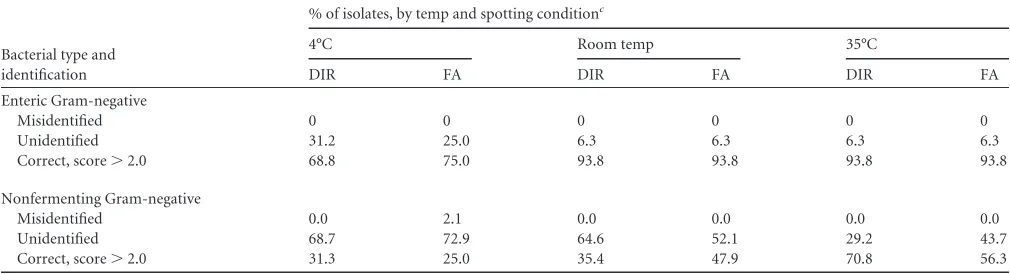
TABLE 3Temperature studies of entericaand non-glucose-fermentingbGram-negative bacteriaBacterial type and identification
% of isolates, by temp and spotting conditionc
4°C Room temp 35°C
DIR FA DIR FA DIR FA
Enteric Gram-negative
Misidentified 0 0 0 0 0 0
Unidentified 31.2 25.0 6.3 6.3 6.3 6.3
Correct, score⬎2.0 68.8 75.0 93.8 93.8 93.8 93.8
Nonfermenting Gram-negative
Misidentified 0.0 2.1 0.0 0.0 0.0 0.0
Unidentified 68.7 72.9 64.6 52.1 29.2 43.7
Correct, score⬎2.0 31.3 25.0 35.4 47.9 70.8 56.3
a
Twenty-four isolates consisting of the following (number of isolates in parentheses if more than one):A. caviae,C. freundii(2),E. aerogenes,E. cloacae(2),E. gergoviae,E. coli(5),
K. oxytoca(2),K. pneumoniae(3),M. morganii,P. mirabilis(2),Salmonellaspp. (2), andS. marcescens(2). b
Twenty-five isolates consisting of the following (number of isolates in parentheses if more than one):A. xylosoxidans(2),B. cenocepacia,B. cepacia,B. gladioli(2),C. indologenes
(2),H. influenzae(2),H. parainfluenzae,M. catarrhalis(2),P. ananatis,P. canis,P. shigelloides,P. aeruginosa(5), andS. maltophilia(4). c
DIR, direct spotting without formic acid treatment; FA, formic acid treated. Data from heavy and light spotting conditions are pooled.
on May 16, 2020 by guest
http://jcm.asm.org/
Improved MALDI-TOF performance with optimized
scor-ing cutoffs.
For EGNB, all isolates with a Bruker Biotyper score of
ⱖ
1.9 were correctly identified to the species level. When the score
was
⬍1.9, identifications were a mix of incorrect and correct,
ren-dering the identification “to the genus level” irrelevant in this
context. Therefore, we applied a single Bruker Biotyper cutoff for
a correct identification to the species level of 1.9, which resulted in
a rate of identification of 88.0% (a 1% improvement) for a formic
acid-treated heavy smear, a total improvement of 6.75% over the
use of Bruker’s recommended species-level score cutoff with a
non-formic-acid-treated smear. Nine of 16 additional isolates
identified were members of the
E. cloacae
group, which is
geneti-cally homogeneous (
16
) and is a difficult group to identify by use
of MALDI-TOF analysis (
3
).
For the NFGNB, formic acid treatment had no statistical effect
on scores and no appreciable effect on the rates of identification
when this group of organisms was analyzed together (
Table 4
).
Therefore, we sought to improve the rate of identification by
di-viding the NFGNB into “fastidious” isolates (those that do not
grow on MacConkey agar) and “nonfastidious” isolates (those
that do grow on MacConkey agar) and then reanalyzing the data
by constructing modified receiver operating curves for the heavily
smeared spots to choose a score for clinical reporting that
maxi-mized the rate of correct identifications while minimizing
mis-identifications (data not shown). The highest yield of
identifica-tions to the species level without any misidentificaidentifica-tions was
achieved with a heavy smear without formic acid treatment and
with Biotyper score cutoffs of
ⱖ2.0 for fastidious NFGNB and
ⱖ
1.9 for nonfastidious NFGNB. This raised the rate of
identifica-tion to 77% for the NFGNB as a group, an improvement of 4.25%
over direct heavy spotting with a cutoff of
ⱖ
2.0.
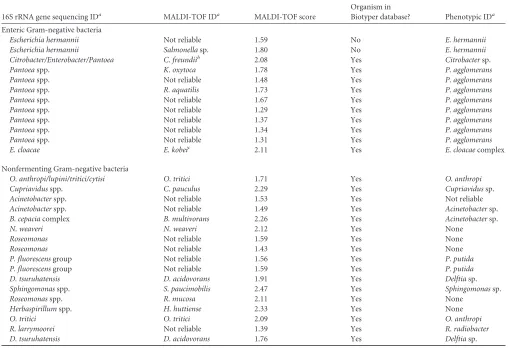
Subanalysis of failed and discrepant identifications.
Most
unidentified isolates were random, i.e., one of four spots of a set
failed to be identified. Seventeen EGNB samples required repeat
analysis, resulting in 5 additional identifications. Twelve isolates
were selected for 16S rRNA gene sequencing, as they were not
identified by use of MALDI-TOF (i.e., none of the four replicates
had a score of
⬎2.0) and/or there was a discrepancy with the
phenotypic method or the isolate was not identified by use of
phenotypic means. Of these 12 samples, phenotypic identification
was always correct, while MALDI-TOF agreed with the
pheno-typic identification twice but failed to identify 8
Pantoea
spp. and
2
Escherichia hermannii
isolates (
Table 5
). A single
C. freundii
isolate and a single
E. cloacae
isolate were identified correctly
by MALDI-TOF, phenotypic methods, and 16S sequencing
(
Table 5
). Of these isolates, all were present in the Biotyper 3.0
database except
E. hermannii
.
Repeat analysis of 45 NFGNB isolates (17.9%) resulted in 28
additional identifications. Seventeen isolates (6.8%) were then
se-lected for 16S sequencing, and of these, MALDI-TOF was correct
to the species level 7 times (
Cupriavidus pauculus
,
Burkholderia
multivorans
,
Sphingomonas paucimobilis
,
Roseomonas mucosa
,
Ochrobactrum tritici
,
Herbaspirillum huttiense
, and
Neisseria
weaveri
), while phenotypic identification was correct 5 times, but
generally with less resolution when identified to the species level
(
Cupriavidus
sp., two
Delftia
spp.,
Sphingomonas
sp., and
Ochro-bactrum anthropi
); both were correct 4 times, and neither was
correct 5 times (
Table 5
). All organisms identified in this group
were present in the Biotyper database.
Medium, temperature, and subculture studies.
A subset of 24
EGNB and 25 NFGNB isolates was analyzed on a number of
dif-ferent medium types to assess the impact of selective medium on
MALDI-TOF MS identification of Gram-negative bacteria. For
EGNB, performance on most media, with or without formic acid
treatment, was similar. Hektoen enteric medium resulted in a rate
of successful identification that was approximately 20% less than
rates of the other medium types, but there were no
misidentifica-tions on any medium type.
For NFGNB, organisms that did not grow on a particular
medium were excluded from analysis. There was one
misiden-tification from MacConkey agar (
Burkholderia gladioli
was
identified as
Chryseobacterium indologenes
by MALDI-TOF
MS, with a relatively high score of 2.33) with formic acid
treat-ment and a heavy smear. Otherwise, the rates of identification
ranged widely, from over 90% on sheep blood agar to less than
60% on OFPBL agar.
[image:6.585.42.545.77.235.2]The isolates from the medium studies were subcultured to
MacConkey agar at 35°C for 24 h and then analyzed once after 5
days of further incubation at 4°C, 25°C, and 35°C to assess the
impact of growth temperature on the rate of MALDI-TOF MS
identification. The rate of identification decreased with decreasing
temperature. The rate of identification for EGNB was identical
from 35°C to room temperature (93.8%) and dropped by 25% at
4°C. This effect was more pronounced for NFGNB; the rate of
TABLE 4Classification statistics using a cutoff ofⱖ2.0 for species identification and⬎1.7 to⬍2.0 for genus identificationClassification of identification
No. (%) of isolates, by method
Direct smear Smear with formic acid overlay
Heavy Light Heavy Light
Enteric Gram-negative bacteria
To species level 169 (81.3) 172 (82.7) 181 (87.0) 175 (84.1)
Only genus-level resolution 3 (1.4) 0 0 0
Unidentified 36 (17.3) 36 (17.3) 27 (13.0) 33 (15.9)
Misidentified 0 0 0 0
Nonfermenting Gram-negative bacteria
To species level 179 (71.0) 168 (66.7) 178 (70.6) 161 (63.9)
Only genus-level resolution 8 (3.2) 4 (1.6) 3 (1.2) 3 (1.2)
Unidentified 65 (25.8) 80 (31.7) 70 (27.8) 88 (34.9)
Misidentified 0 0 1 (0.4) 0
on May 16, 2020 by guest
http://jcm.asm.org/
identification at 35°C was cut in half at room temperature and
declined an additional 4% to 31.3% at 4°C (
Table 3
). In spite of the
low rate of identification, there was only one misidentification in
the heavy smear formic acid-treated NFGNB group at 4°C, which
again was a
B. gladioli
isolate that was called
C. indologenes
(Bio-typer score, 2.08).
On serial subculture of 24 (EGNB) or 25 (NFGNB) isolates to
sheep blood agar once per day for 5 days, the mean scores and rates
of identification were essentially identical day-to-day (data not
shown). We were therefore able to calculate day-to-day scoring
coefficients of variation for the different spotting conditions,
which ranged from 3.0 to 5.6% for the enterics and 11.0 to 28.9%
for the nonfermenters.
DISCUSSION
Currently, phenotypic identification methods consist of a variety
of rapid benchtop, tubed, manual parallel, and automated parallel
biochemical tests that are used in concert with Gram stain to
ob-tain species-level identification. Identification of nonfermenting
Gram-negative bacteria is frequently protracted and expensive.
This difficulty is usually attributed to the mucoid nature of these
isolates and/or the fact that they may be biochemically inert (
17
–
19
). This situation is possibly improved by MALDI-TOF, but
be-cause no system is currently cleared by the FDA, laboratories are
presented with only generic scoring cutoffs for species-level
iden-tification and a lack of a specific procedures or clear framework
providing detailed information about related technical nuances.
In building this framework for Gram-negative organisms, we
found that the rate of identification to the species level was 88%
for EGNB (heavy smear and formic acid overlay) and 77% for
NFGNB (heavy smear and no formic acid overlay) and our
opti-mized Biotyper cutoffs. While these rates are consistent with
pub-lished data for EGNB (
4
,
13
,
20
,
21
) and NFGNB (
22
–
24
), this
study is unique in its assessment of preanalytical (temperature,
media type, and subculture), analytical (spotting density, formic
acid overlay, and database completeness), and postanalytical
(Bio-typer scoring cutoffs, additional biochemical testing required, and
sequencing analysis) variables and in its focus on the identification
of organisms directly from the routine clinical workflow. For this
reason, we believe the approach outlined here might serve as a
template for laboratories that are considering validation and
op-timization of MALDI-TOF systems.
[image:7.585.39.549.78.426.2]Using our optimized procedure, the Bruker MALDI Biotyper
system made only two erroneous identifications across all studies,
TABLE 516S rRNA gene sequencing for enteric and nonfermenting Gram-negative bacteria16S rRNA gene sequencing IDa MALDI-TOF IDa MALDI-TOF score
Organism in
Biotyper database? Phenotypic IDa
Enteric Gram-negative bacteria
Escherichia hermannii Not reliable 1.59 No E. hermannii
Escherichia hermannii Salmonellasp. 1.80 No E. hermannii
Citrobacter/Enterobacter/Pantoea C. freundiib 2.08 Yes Citrobactersp.
Pantoeaspp. K. oxytoca 1.78 Yes P. agglomerans
Pantoeaspp. Not reliable 1.48 Yes P. agglomerans
Pantoeaspp. R. aquatilis 1.73 Yes P. agglomerans
Pantoeaspp. Not reliable 1.67 Yes P. agglomerans
Pantoeaspp. Not reliable 1.29 Yes P. agglomerans
Pantoeaspp. Not reliable 1.37 Yes P. agglomerans
Pantoeaspp. Not reliable 1.34 Yes P. agglomerans
Pantoeaspp. Not reliable 1.31 Yes P. agglomerans
E. cloacae E. kobeic 2.11 Yes E. cloacaecomplex
Nonfermenting Gram-negative bacteria
O. anthropi/lupini/tritici/cytisi O. tritici 1.71 Yes O. anthropi
Cupriavidusspp. C. pauculus 2.29 Yes Cupriavidussp.
Acinetobacterspp. Not reliable 1.53 Yes Not reliable
Acinetobacterspp. Not reliable 1.49 Yes Acinetobactersp.
B. cepaciacomplex B. multivorans 2.26 Yes Acinetobactersp.
N. weaveri N. weaveri 2.12 Yes None
Roseomonas Not reliable 1.59 Yes None
Roseomonas Not reliable 1.43 Yes None
P. fluorescensgroup Not reliable 1.56 Yes P. putida
P. fluorescensgroup Not reliable 1.59 Yes P. putida
D. tsuruhatensis D. acidovorans 1.91 Yes Delftiasp.
Sphingomonasspp. S. paucimobilis 2.47 Yes Sphingomonassp.
Roseomonasspp. R. mucosa 2.11 Yes None
Herbaspirillumspp. H. huttiense 2.33 Yes None
O. tritici O. tritici 2.09 Yes O. anthropi
R. larrymoorei Not reliable 1.39 Yes R. radiobacter
D. tsuruhatensis D. acidovorans 1.76 Yes Delftiasp.
a
ID, identification.
bA second ID ofC. youngae(score 2.02) was obtained, prompting rRNA gene sequencing. c
WhileE. kobeiis in theE. cloacaecomplex, a second ID ofE. asburiae(score of 2.07, also in theE. cloacaecomplex) was obtained, prompting rRNA gene sequencing that could not distinguish these two species.
on May 16, 2020 by guest
http://jcm.asm.org/
which examined a total of 460 isolates four times each. Our rate of
identification to the species level falls between that of 16S rRNA
gene sequencing and that of standard phenotypic identification
systems, such as Vitek 2 or API 20 NE (
17
,
25
), with
MALDI-TOF being markedly faster than either of these other methods.
An exception where phenotypic methods were superior was in
the identification of organisms that form durable, adherent, or
mucoid colonies, such as
Pantoea agglomerans
and mucoid
Pseudomonas
spp.; this is consistent with previous findings that
mucoid organisms can represent a challenge for MALDI-TOF
analysis (
7
,
26
,
27
).
Many clinical specimen types, such as stool and respiratory
specimens, are plated to a variety of selective and differential
me-dia to minimize the overgrowth of normal flora and facilitate the
recovery of pathogens. The ability to analyze isolates directly on
these medium types, rather than subculturing to enriched
me-dium first, can improve the time it takes to identify these isolates.
It is intuitively understood that incubation on different media
may alter the MALDI-TOF spectral profile for a given isolate (
26
,
28
,
29
), and others have noted that Hektoen enteric medium
re-sults in poor performance or requires a full extraction (
13
,
30
).
However, we found that this medium type, as well as other
selec-tive media, such as MacConkey and OFPBL, reduced the rate of
identification but induced no misidentifications, verifying that
MALDI-TOF analysis can be performed from primary
subcul-tures on selective agar.
A final practical consideration was the burden of additional
testing required in order to obtain reliable identifications from the
isolates recovered in routine workflow. Among Gram-negative
organisms,
Shigella
spp. and
E. coli
are indistinguishable from each
other using 16S rRNA gene sequencing or MALDI-TOF (
20
,
31
,
32
), which is attributed to the taxonomic proximity of these two
organisms (
33
); individual laboratories will need procedures to
reconcile this based on local epidemiology and the availability of
additional biochemical testing methods. An unanticipated but not
surprising (
14
) tendency to call
K. oxytoca
isolates
R.
ornithino-lytica
is easily remedied using ornithine decarboxylase.
In routine practice, the need to perform 16S rRNA
sequenc-ing on
⬃
6% of isolates might be balanced by the reduced need
for additional biochemical testing and the previously reported
low cost of consumables for MALDI-TOF testing (
4
,
27
).
Oth-ers (
34
) have also found that a time savings of many days is
possible with biochemically inert nonfermenting
Gram-nega-tive organisms.
Bruker’s generic scoring cutoff of
ⱖ
2.0 for a species-level
iden-tification was overly conservative for EGNB and nonfastidious
NFGNB. When the threshold for species-level identification was
reduced to
ⱖ1.9 for EGNB, this resulted in the identification of 17
additional isolates, 9 of which were
Enterobacter
spp. In clinical
use, unless other tests have been performed to identify an isolate as
Gram-negative enteric or nonfermenting Gram-negative, we
sug-gest that a cutoff of
ⱖ1.9 be used for any Gram-negative organism
that grows on MacConkey agar and
ⱖ
2.0 be used for those that do
not or that were not grown on MacConkey agar in primary
cul-ture. From the findings of our medium, temperature, and
subcul-ture studies, we recommend that if an initial identification is
⬎0.2
Biotyper scoring units below the cutoff, the isolate should be
sub-cultured to sheep blood agar, incubated at 35°C, and reanalyzed
the next day.
In conclusion, we provide a comprehensive assessment of the
major variables that influence MALDI-TOF MS identification of
clinically relevant Gram-negative bacteria. The major finding of
this study is that the use of a single spot overlaid with formic acid
and the application of less-stringent scoring cutoffs for EGNB and
nonfastidious NFGNB improved the rates of identification
with-out inducing misidentifications. As data acquisition, spectral
da-tabases, and algorithms for spectral pattern matching evolve,
per-formance is likely to improve and the specific failings of the
present system might be remedied. With simple procedural
opti-mizations, the rates of correct identification and misidentification
(higher and lower, respectively) for even the most fastidious
or-ganisms are superior to those using biochemical methods (
35
),
positioning MALDI-TOF to supplant them in the clinical
micro-biology laboratory.
ACKNOWLEDGMENTS
We gratefully acknowledge the assistance of Sunni Shuey, David Winkler, Meghan Butler, Patricia Sellenriek, and the staff of the clinical microbiol-ogy laboratory at St. Louis Children’s Hospital, St. Louis, MO.
REFERENCES
1.Beavis RC, Chait BT.1989. Cinnamic acid derivatives as matrices for ultraviolet laser desorption mass spectrometry of proteins. Rapid Com-mun. Mass Spectrom.3:432– 435.
2.Lay JO, Jr.2001. MALDI-TOF mass spectrometry of bacteria. Mass Spec-trom. Rev.20:172–194.
3.Stevenson LG, Drake SK, Murray PR. 2010. Rapid identification of bacteria in positive blood culture broths by matrix-assisted laser desorp-tion ionizadesorp-tion-time of flight mass spectrometry. J. Clin. Microbiol.48: 444 – 447.
4.Tan KE, Ellis BC, Lee R, Stamper PD, Zhang SX, Carroll KC.2012. Prospective evaluation of a matrix-assisted laser desorption ionization-time of flight mass spectrometry system in a hospital clinical microbiology laboratory for identification of bacteria and yeasts: a bench-by-bench study for assessing the impact on time to identification and cost-effectiveness. J. Clin. Microbiol.50:3301–3308.
5.Alatoom AA, Cunningham SA, Ihde SM, Mandrekar J, Patel R.2011. Comparison of direct colony method versus extraction method for iden-tification of gram-positive cocci by use of Bruker Biotyper matrix-assisted laser desorption ionization-time of flight mass spectrometry. J. Clin. Mi-crobiol.49:2868 –2873.
6.McElvania TeKippe E, Shuey S, Winkler DW, Butler MA, Burnham CAD.2013. Optimizing identification of clinically relevant Gram-positive organisms by use of the Bruker Biotyper matrix-assisted laser desorption ionization–time of flight mass spectrometry system. J. Clin. Microbiol. 51:1421–1427.
7.Sogawa K, Watanabe M, Sato K, Segawa S, Ishii C, Miyabe A, Murata S, Saito T, Nomura F.2011. Use of the MALDI BioTyper system with MALDI-TOF mass spectrometry for rapid identification of microorgan-isms. Anal. Bioanal. Chem.400:1905–1911.
8. Watson ME, Jr, Estabrook MM, Burnham CAD. 2011. Catheter-associatedNocardia higoensisbacteremia in a child with acute lymphocytic leukemia. J. Clin. Microbiol.49:469 – 471.
9.Clinical and Laboratory Standards Institute.2008. Interpretive criteria for identification of bacteria and fungi by DNA target sequencing; ap-proved guideline. CLSI document MM18-A (ISBN 1-56238-664-6). Clin-ical and Laboratory Standards Institute, Wayne, PA.
10. Benson DA, Karsch-Mizrachi I, Lipman DJ, Ostell J, Sayers EW.2005. GenBank. Nucleic Acids Res.33:D34 –D38. doi:10.1093/nar/gkq1079. 11. Cole JR, Wang Q, Cardenas E, Fish J, Chai B, Farris RJ,
Kulam-Syed-Mohideen AS, McGarrell DM, Marsh T, Garrity GM, Tiedje JM.2009. The Ribosomal Database Project: improved alignments and new tools for rRNA analysis. Nucleic Acids Res. 37:D141–D145. doi:10.1093/nar /gkn879.
12. DeSantis TZ, Hugenholtz P, Larsen N, Rojas M, Brodie EL, Keller K, Huber T, Dalevi D, Hu P, Andersen GL.2006. Greengenes, a chimera-checked 16S rRNA gene database and workbench compatible with ARB. Appl. Environ. Microbiol.72:5069 –5072.
13. Saffert RT, Cunningham SA, Ihde SM, Jobe KE, Mandrekar J, Patel R.
on May 16, 2020 by guest
http://jcm.asm.org/
2011. Comparison of Bruker Biotyper matrix-assisted laser desorption ionization-time of flight mass spectrometer to BD Phoenix automated microbiology system for identification of gram-negative bacilli. J. Clin. Microbiol.49:887– 892.
14. Drancourt M, Bollet C, Carta A, Rousselier P. 2001. Phylogenetic analyses ofKlebsiellaspecies delineateKlebsiellaandRaoultellagen. nov., with description ofRaoultella ornithinolyticacomb. nov.,Raoultella terri-genacomb. nov. andRaoultella planticolacomb. nov. Int. J. Syst. Evol. Microbiol.51:925–932.
15. Ferreira L, Vega S, Sánchez-Juanes F, González M, Herrero A, Muñiz MC, González-Buitrago JM, Muñoz JL.2010. Identifying bacteria using a matrix-assisted laser desorption ionization time-of-flight (MALDI-TOF) mass spectrometer. Comparison with routine methods used in clin-ical microbiology laboratories. Enferm. Infecc. Microbiol. Clin.28:492– 497. (In Spanish.)
16. Paauw A, Caspers MPM, Schuren FHJ, Leverstein-van Hall MA, Delé-toile A, Montijn RC, Verhoef J, Fluit AC.2008. Genomic diversity within theEnterobacter cloacaecomplex. PLoS One3:e3018. doi:10.1371/journal .pone.0003018.
17. Bosshard PP, Zbinden R, Abels S, Böddinghaus B, Altwegg M, Böttger EC.2006. 16S rRNA gene sequencing versus the API 20 NE system and the VITEK 2 ID-GNB card for identification of nonfermenting Gram-negative bacteria in the clinical laboratory. J. Clin. Microbiol.44:1359 – 1366.
18. Kiska DL, Kerr A, Jones MC, Caracciolo JA, Eskridge B, Jordan M, Miller S, Hughes D, King N, Gilligan PH. 1996. Accuracy of four commercial systems for identification ofBurkholderia cepaciaand other gram-negative nonfermenting bacilli recovered from patients with cystic fibrosis. J. Clin. Microbiol.34:886 – 891.
19. Funke G, Funke-Kissling P.2004. Evaluation of the new VITEK 2 card for identification of clinically relevant gram-negative rods. J. Clin. Microbiol. 42:4067– 4071.
20. He Y, Li H, Lu X, Stratton CW, Tang YW.2010. Mass spectrometry Biotyper system identifies enteric bacterial pathogens directly from colo-nies grown on selective stool culture media. J. Clin. Microbiol.48:3888 – 3892.
21. Neville SA, Lecordier A, Ziochos H, Chater MJ, Gosbell IB, Maley MW, van Hal SJ.2011. Utility of matrix-assisted laser desorption ionization-time of flight mass spectrometry following introduction for routine labo-ratory bacterial identification. J. Clin. Microbiol.49:2980 –2984. 22. Marko DC, Saffert RT, Cunningham SA, Hyman J, Walsh J, Arbefeville
S, Howard W, Pruessner J, Safwat N, Cockerill FR, Bossler AD, Patel R, Richter SS.2012. Evaluation of the Bruker Biotyper and Vitek MS matrix-assisted laser desorption ionization-time of flight mass spectrometry sys-tems for identification of nonfermenting gram-negative bacilli isolated from cultures from cystic fibrosis patients. J. Clin. Microbiol.50:2034 – 2039.
23. Bessède E, Angla-Gre M, Delagarde Y, Sep Hieng S, Ménard A, Mé-graud F.2010. Matrix-assisted laser-desorption/ionization biotyper:
ex-perience in the routine of a University hospital. Clin. Microbiol. Infect. 17:533–538.
24. Carbonnelle E, Grohs P, Jacquier H, Day N, Tenza S, Dewailly A, Vissouarn O, Rottman M, Herrmann JL, Podglajen I, Raskine L.2012. Robustness of two MALDI-TOF mass spectrometry systems for bacterial identification. J. Microbiol. Methods89:133–136.
25. Cloud JL, Harmsen D, Iwen PC, Dunn JJ, Hall G, Lasala PR, Hoggan K, Wilson D, Woods GL, Mellmann A.2010. Comparison of traditional phenotypic identification methods with partial 5=16S rRNA gene se-quencing for species-level identification of nonfermenting Gram-negative bacilli. J. Clin. Microbiol.48:1442–1444.
26. Anderson NW, Buchan BW, Riebe KM, Parsons LN, Gnacinski S, Ledeboer NA.2012. Effects of solid-medium type on routine identifica-tion of bacterial isolates by use of matrix-assisted laser desorpidentifica-tion ioniza-tion-time of flight mass spectrometry. J. Clin. Microbiol.50:1008 –1013. 27. Haigh J, Degun A, Eydmann M, Millar M, Wilks M.2011. Improved
performance of bacterium and yeast identification by a commercial ma-trix-assisted laser desorption ionization–time of flight mass spectrometry system in the clinical microbiology laboratory. J. Clin. Microbiol.49:3441. 28. Walker J, Fox AJ, Edwards-Jones V, Gordon DB.2002. Intact cell mass spectrometry (ICMS) used to type methicillin-resistantStaphylococcus au-reus: media effects and inter-laboratory reproducibility. J. Microbiol. Methods48:117–126.
29. Valentine N, Wunschel S, Wunschel D, Petersen C, Wahl K.2005. Effect of culture conditions on microorganism identification by matrix-assisted laser desorption ionization mass spectrometry. Appl. Environ. Microbiol. 71:58 – 64.
30. Bizzini A, Durussel C, Bille J, Greub G, Prod’hom G.2010. Performance of matrix-assisted laser desorption ionization-time of flight mass spec-trometry for identification of bacterial strains routinely isolated in a clin-ical microbiology laboratory. J. Clin. Microbiol.48:1549 –1554. 31. Seng P, Drancourt M, Gouriet F, La Scola B, Fournier PE, Rolain JM,
Raoult D.2009. Ongoing revolution in bacteriology: routine identifica-tion of bacteria by matrix-assisted laser desorpidentifica-tion ionizaidentifica-tion time-of-flight mass spectrometry. Clin. Infect. Dis.49:543–551.
32. Eigner U, Holfelder M, Oberdorfer K, Betz-Wild U, Bertsch D, Fahr AM.2009. Performance of a matrix-assisted laser desorption ionization-time-of-flight mass spectrometry system for the identification of bacterial isolates in the clinical routine laboratory. Clin. Lab.55:289 –296. 33. Peng J, Yang J, Jin Q.2009. The molecular evolutionary history of
Shigellaspp. and enteroinvasiveEscherichia coli. Infect. Genet. Evol. 9:147–152.
34. Desai AP, Stanley T, Atuan M, McKey J, Lipuma JJ, Rogers B, Jerris R. 2012. Use of matrix assisted laser desorption ionisation-time of flight mass spectrometry in a paediatric clinical laboratory for identification of bacte-ria commonly isolated from cystic fibrosis patients. J. Clin. Pathol.65: 835– 838.
35. Valenza G, Ruoff C, Vogel U, Frosch M, Abele-Horn M.2007. Micro-biological evaluation of the new VITEK 2Neisseria-Haemophilus identifi-cation card. J. Clin. Microbiol.45:3493–3497.