Screen Method, and the Vitek 2 Automated Antimicrobial
Susceptibility Testing System for Detection of Clinical Isolates of
Enterococci with Low- and Medium-Level VanB-Type Vancomycin
Resistance: a Multicenter Study
Kristin Hegstad,a,bChristian G. Giske,cBjørg Haldorsen,aErika Matuschek,dKristian Schønning,eTruls M. Leegaard,f Gunnar Kahlmeter,dArnfinn Sundsfjord,a,bon behalf of the NordicAST VRE Detection Study Group
Reference Centre for Detection of Antimicrobial Resistance, Department of Microbiology and Infection Control, University Hospital of North Norway, Tromsø, Norwaya; Research Group for Host-Microbe Interactions, Faculty of Health Sciences, University of Tromsø-The Arctic University of Norway, Tromsø, Norwayb; Department of Clinical Microbiology, MTC, Karolinska Institutet, Karolinska University Hospital, Stockholm, Swedenc; EUCAST Laboratory for Antimicrobial Susceptibility Testing, Växjö, Swedend; Department of Clinical Microbiology, Hvidovre Hospital, Hvidovre, Denmarke; Department of Microbiology, Akershus University Hospital, Oslo, Norwayf
Different antimicrobial susceptibility testing methods to detect low-level vancomycin resistance in enterococci were evaluated in
a Scandinavian multicenter study (
n
ⴝ
28). A phenotypically and genotypically well-characterized diverse collection of
Entero-coccus faecalis
(
n
ⴝ
12) and
Enterococcus faecium
(
n
ⴝ
18) strains with and without nonsusceptibility to vancomycin was
exam-ined blindly in Danish (
n
ⴝ
5), Norwegian (
n
ⴝ
13), and Swedish (
n
ⴝ
10) laboratories using the EUCAST disk diffusion method
(
n
ⴝ
28) and the CLSI agar screen (
n
ⴝ
18) or the Vitek 2 system (bioMérieux) (
n
ⴝ
5). The EUCAST disk diffusion method (very
major error [VME] rate, 7.0%; sensitivity, 0.93; major error [ME] rate, 2.4%; specificity, 0.98) and CLSI agar screen (VME rate,
6.6%; sensitivity, 0.93; ME rate, 5.6%; specificity, 0.94) performed significantly better (
P
ⴝ
0.02) than the Vitek 2 system (VME
rate, 13%; sensitivity, 0.87; ME rate, 0%; specificity, 1). The performance of the EUCAST disk diffusion method was challenged
by differences in vancomycin inhibition zone sizes as well as the experience of the personnel in interpreting fuzzy zone edges as
an indication of vancomycin resistance. Laboratories using Oxoid agar (
P
<
0.0001) or Merck Mueller-Hinton (MH) agar (
P
ⴝ
0.027) for the disk diffusion assay performed significantly better than did laboratories using BBL MH II medium. Laboratories
using Difco brain heart infusion (BHI) agar for the CLSI agar screen performed significantly better (
P
ⴝ
0.017) than did those
using Oxoid BHI agar. In conclusion, both the EUCAST disk diffusion and CLSI agar screening methods performed acceptably
(sensitivity, 0.93; specificity, 0.94 to 0.98) in the detection of VanB-type vancomycin-resistant enterococci with low-level
resis-tance. Importantly, use of the CLSI agar screen requires careful monitoring of the vancomycin concentration in the plates.
More-over, disk diffusion methodology requires that personnel be trained in interpreting zone edges.
E
nterococci are now recognized as an important cause of
hos-pital-acquired infections worldwide (
1
,
2
). Notably, recent
Eu-ropean surveys have documented pronounced yearly increases in
bloodstream infections caused by multidrug-resistant (MDR)
En-terococcus faecium
, represented by high-risk clones (
3
). The
rela-tive increase in infections caused by MDR enterococci is related to
several characteristics, including their intrinsic ability to
with-stand exposure to broad-spectrum antibiotics and environmental
extremes, as well as the capacity to acquire new genetic
determi-nants promoting gastrointestinal colonization and survival in the
hospital environment (
4
,
5
). Moreover, their remarkable ability to
acquire new antimicrobial resistance determinants poses
substan-tial therapeutic problems, and physicians are forced to use
last-resort therapeutic options (
4
,
6
). Therefore, it is important that
clinical laboratories have the ability to deliver rapid accurate
an-timicrobial susceptibility data for enterococci, to support
appro-priate therapeutic and infection-control measures.
Currently, the vancomycin resistance (
van
) clusters in
entero-cocci include eight acquired gene clusters, i.e.,
vanA
,
vanB
,
vanD
,
vanE
,
vanG
,
vanL
(
7
),
vanM
(
8
), and
vanN
(
9
). The
vanA
genotype
is the most prevalent genotype in vancomycin-resistant
entero-cocci (VRE) worldwide, but infections with VanB-type VRE
(mainly
E. faecium
) have shown dramatic increases in several
Eu-ropean countries and are predominant in Australia (
10–16
). The
vanB
ligase gene has been divided into three subtypes,
vanB1
to
vanB3
, based on phylogenetic diversity (
17–19
).
The VanB-type VRE have inducible resistance and express
var-ious levels of resistance to vancomycin (MICs, 4 to 1,024 mg/liter)
and susceptibility to teicoplanin (MICs,
ⱕ
2 mg/liter)
in vitro
(
7
,
20
). The wide range of vancomycin MICs in VanB-type
entero-cocci is well known and has been observed within the same clone
during outbreaks (
12
,
21
) (A. Sivertsen, H. Billström, O
¨ . Melefors,
B. Olsson Liljequist, K. Tegmark Wisell, M. Ullberg, V. O
¨ zenci, A.
Received20 December 2013Returned for modification21 January 2014 Accepted21 February 2014
Published ahead of print5 March 2014 Editor:R. Patel
Address correspondence to Kristin Hegstad, [email protected], or Arnfinn Sundsfjord, [email protected].
Supplemental material for this article may be found athttp://dx.doi.org/10.1128 /JCM.03544-13.
Copyright © 2014, American Society for Microbiology. All Rights Reserved.
doi:10.1128/JCM.03544-13
on May 16, 2020 by guest
http://jcm.asm.org/
Sundsfjord, and K. Hegstad, submitted for publication). The MIC
clinical breakpoints defined by the European Committee on
An-timicrobial Susceptibility Testing (EUCAST) for
Enterococcus
spp.
are as follows: for vancomycin, susceptible,
ⱕ
4 mg/liter; resistant,
⬎
4 mg/liter; for teicoplanin, susceptible,
ⱕ
2 mg/liter; resistant,
⬎
2 mg/liter (
22
). The inducible phenotypes of VanB-type VRE
with moderate to low vancomycin MICs challenge current
phe-notypic detection methods. It is important to detect these VRE
isolates, as glycopeptide treatment of infections caused by such
isolates may lead to treatment failure due to increased MICs or
selection of constitutively expressed
vanB
clusters also showing
resistance to teicoplanin (
23–26
).
The purpose of this study was to examine the ability of different
antimicrobial susceptibility testing methods to detect VRE with
low or medium levels of resistance. It was organized as a
multi-center study in which Danish, Norwegian, and Swedish
laborato-ries were invited to blindly examine a phenotypically and
geno-typically well-characterized diverse collection of
Enterococcus
faecalis
(
n
⫽
12) and
E. faecium
(
n
⫽
18) isolates with and without
nonsusceptibility to vancomycin. The collection was examined by
the EUCAST disk diffusion method in all laboratories and by one
alternative method, which could include the vancomycin-brain
heart infusion (BHI) agar screening method (referred to as the
Clinical and Laboratory Standards Institute [CLSI] agar screen), a
commercial chromogenic agar screening method, or an
auto-mated antimicrobial susceptibility testing system.
MATERIALS AND METHODS
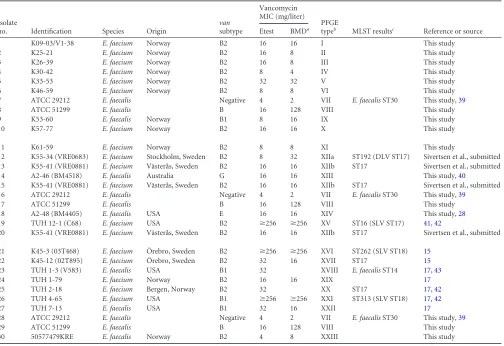
Bacterial strains used in this study.All isolates were previously geno-typed by multiplex identification-PCR (27),vanA/B/E/GPCRs (17,28,
29), SmaI pulsed-field gel electrophoresis (PFGE) (30), and/or multilocus sequence typing (MLST), to ensure species identification,vangenotype identification, and genetic diversity. The isolates covered the whole range of vancomycin MIC values. The vancomycin MICs of the isolates were confirmed by both gradient testing (Etest; bioMérieux, Marcy l’Etoile, France) on Mueller-Hinton (MH) agar, as described by the manufacturer, and broth microdilution testing, according to International Organization for Standardization recommendations (31).
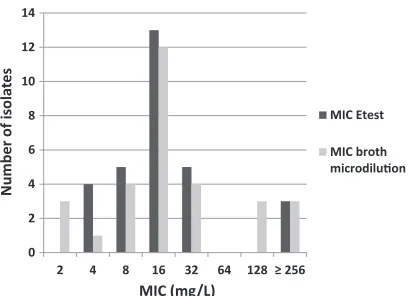
[image:2.585.43.547.86.432.2]The isolate panel consisted of well-characterized vancomycin-suscep-tible (n⫽3; three copies ofE. faecalisATCC 29212) and vancomycin-resistant (n⫽27) strains ofE. faecalis andE. faecium(Table 1). The resistant isolates expressed various vancomycin MICs (Fig. 1). Twelve of the isolates wereE. faecalis(vanB1,n⫽3;vanB2,n⫽1;vanE,n⫽1;vanG, n⫽1; ATCC 29212, vancomycin susceptible,n⫽3; ATCC 51299,vanB, n⫽3) and 18E. faecium(vanB1,n⫽1;vanB2,n⫽17), of diverse
TABLE 1Isolate identification, species,vangenotype, gradient test results, broth microdilution MICs for vancomycin, and PFGE and MLST types
for the blinded material used in this study
Isolate
no. Identification Species Origin
van subtype
Vancomycin MIC (mg/liter)
PFGE
typeb MLST resultsc Reference or source
Etest BMDa
1 K09-03/V1-38 E. faecium Norway B2 16 16 I This study
2 K25-21 E. faecium Norway B2 16 8 II This study
3 K26-39 E. faecium Norway B2 16 8 III This study
4 K30-42 E. faecium Norway B2 8 4 IV This study
5 K33-53 E. faecium Norway B2 32 32 V This study
6 K46-59 E. faecium Norway B2 8 8 VI This study
7 ATCC 29212 E. faecalis Negative 4 2 VII E. faecalisST30 This study,39
8 ATCC 51299 E. faecalis B 16 128 VIII This study
9 K53-60 E. faecalis Norway B1 8 16 IX This study
10 K57-77 E. faecium Norway B2 16 16 X This study
11 K61-59 E. faecium Norway B2 8 8 XI This study
12 K55-34 (VRE0683) E. faecium Stockholm, Sweden B2 8 32 XIIa ST192 (DLV ST17) Sivertsen et al., submitted
13 K55-41 (VRE0881) E. faecium Västerås, Sweden B2 16 16 XIIb ST17 Sivertsen et al., submitted
14 A2-46 (BM4518) E. faecalis Australia G 16 16 XIII This study,40
15 K55-41 (VRE0881) E. faecium Västerås, Sweden B2 16 16 XIIb ST17 Sivertsen et al., submitted
16 ATCC 29212 E. faecalis Negative 4 2 VII E. faecalisST30 This study,39
17 ATCC 51299 E. faecalis B 16 128 VIII This study
18 A2-48 (BM4405) E. faecalis USA E 16 16 XIV This study,28
19 TUH 12-1 (C68) E. faecium USA B2 ⱖ256 ⱖ256 XV ST16 (SLV ST17) 41,42
20 K55-41 (VRE0881) E. faecium Västerås, Sweden B2 16 16 XIIb ST17 Sivertsen et al., submitted
21 K45-3 (03T468) E. faecium O¨ rebro, Sweden B2 ⱖ256 ⱖ256 XVI ST262 (SLV ST18) 15
22 K45-12 (02T895) E. faecium O¨ rebro, Sweden B2 32 16 XVII ST17 15
23 TUH 1-3 (V583) E. faecalis USA B1 32 XVIII E. faecalisST14 17,43
24 TUH 1-79 E. faecium Norway B2 16 16 XIX 17
25 TUH 2-18 E. faecium Bergen, Norway B2 32 XX ST17 17,42
26 TUH 4-65 E. faecium USA B1 ⱖ256 ⱖ256 XXI ST313 (SLV ST18) 17,42
27 TUH 7-13 E. faecalis USA B1 32 16 XXII 17
28 ATCC 29212 E. faecalis Negative 4 2 VII E. faecalisST30 This study,39
29 ATCC 51299 E. faecalis B 16 128 VIII This study
30 50577479KRE E. faecalis Norway B2 4 8 XXIII This study
aBMD, broth microdilution. b
Previous PFGE type designations have been changed to consecutive numbering with Roman numerals in this study, for pedagogic reasons.
cSLV, single-locus variant; DLV, double-locus variant.
on May 16, 2020 by guest
http://jcm.asm.org/
geographical origins (Norway,n⫽12; United States,n⫽11; Sweden,n⫽ 6; Australia,n⫽1). Seven of the isolates represented Nordic outbreak strains from Bergen, Norway (1996) (MIC, 32 mg/liter) (32,33), O¨ rebro, Sweden (2002 to 2003) (MICs, 32 andⱖ256 mg/liter) (15), Stockholm, Sweden (2007) (MIC, 8 mg/liter), and Västerås, Sweden (2008) (MIC, 16 mg/liter) (Sivertsen et al., submitted). The remaining 20 resistant strains expressed low-level (MIC, 4 to 8 mg/liter;n⫽5), medium-level (MIC, 16 to 32 mg/liter;n⫽13), or high-level (MIC,ⱖ64 mg/liter;n⫽2) vanco-mycin resistance. The panel consisted of 23 PFGE types and two subtypes within type XII. MLST analysis of 13 isolates demonstrated 5 sequence types (STs) among theE. faeciumclonal complex 17 (CC17) high-risk clones (ST16,n⫽1; ST17,n⫽5; ST192,n⫽1; ST262,n⫽1; ST313,n⫽ 1), as well asE. faecalisST14 (n⫽1) and ST30 (ATCC 29212,n⫽3)
(Table 1).
Study design.The study was organized through the NordicAST (Nor-dic Committee on Antimicrobial Susceptibility Testing) network (www
.nordicast.org). All Danish (n⫽13), Swedish (n⫽23), and Norwegian
(n⫽24) diagnostic laboratories for clinical microbiology were invited to participate in the study, examining the bacterial panel listed inTable 1. All laboratories were asked to perform the reference agar disk diffusion method as recommended by EUCAST (34) and at least one alternative method, i.e., the CLSI agar screening method (35) using BHI agar supple-mented with vancomycin at 6 mg/liter and/or a commercial automated test available in the laboratory (Vitek 2 system). The laboratories were also welcome to test the performance of commercial VRE-selective agars. Each participating laboratory used its own supply of test reagents, disks, and agar. The laboratories were instructed to avoid any testing with a confir-matory method (vangenotyping or gradient testing), as the objective was for the strains to be examined through a blinded nonbiased approach. The time frame for the laboratories to complete the susceptibility testing was a maximum of 3 weeks. A result data form was filled in for each participat-ing laboratory for each strain and included zone diameter and zone edge quality (fuzzy or sharp zone edge) for the agar disk diffusion testing, growth/no-growth for the agar screening, results for the commercial au-tomated antimicrobial susceptibility testing systems as reported, interpre-tation (susceptible or resistant) according to EUCAST clinical break-points (22), and a comment on whether, under normal circumstances, the laboratory would refer the sample for confirmatory testing in a reference laboratory.
Phenotypic methods used for antimicrobial susceptibility testing. The disk diffusion test was performed with 6-mm disks with 5g vanco-mycin and MH agar plates, using the EUCAST method (34) and clinical breakpoints (22). Each laboratory participating in the study used its own supply of MH agar, which was either Oxoid agar (Oxoid Ltd./Thermo Fisher Scientific, Cambridge, United Kingdom) (n⫽16), BBL MH II agar (Becton, Dickinson Diagnostics, Baltimore, MD) (n⫽10), or Merck agar (Merck KGaA, Darmstadt, Germany) (n⫽2).
The CLSI agar screening method was performed with BHI agar with 6 mg/liter vancomycin and results were read after 24 h, as described by Swenson et al. (35). The BHI agar used was either Difco agar (Becton, Dickinson Diagnostics) (n⫽8), Oxoid agar (n⫽5), BBL agar (Becton, Dickinson Diagnostics) (n⫽3), Scharlau agar (Scharlab SL, Barcelona, Spain) (n⫽1), or Acumedia agar (Neogen Corp., Lansing, MI) (n⫽1). Growth on commercial chromogenic culture media, read after 48 h, was tested using chromID VRE agar (bioMérieux, Marcy l’Etoile, France) (n⫽7) or CHROMagar VRE medium (CHROMagar, Paris, France) (n⫽ 5). Automated susceptibility testing with the Vitek 2 system was per-formed using either AST-P592 (n⫽2), AST-P586 (n⫽2), or AST-594 (n⫽1) susceptibility cards (bioMérieux).
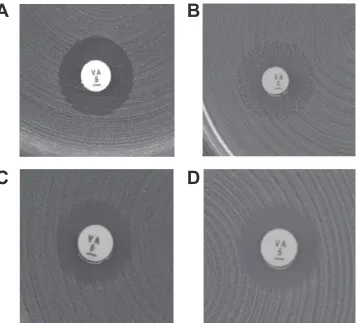
Evaluation of results.The test results were categorized as either cor-rect (susceptible reported as susceptible and resistant reported as resis-tant), very major error (VME) (resistant reported as susceptible), or ma-jor error (ME) (susceptible reported as resistant), as EUCAST has not defined any intermediate category for clinical vancomycin breakpoints (thus excluding the possibility of minor errors occurring). According to the EUCAST disk diffusion method, the isolates were categorized as resis-tant when the zone diameter was less than 12 mm. Also, according to the method, resistance should be suspected when the vancomycin zone edge is fuzzy (examples inFig. 2CandD) or colonies are growing within the inhibition zone (example inFig. 2B). Thus, zone edge quality was also taken into account. The isolates were reported as vancomycin susceptible only when the zone edges were sharp andⱖ12 mm (example inFig. 2A). Statistical methods and interpretation. Sensitivities (conditional probabilities that resistant isolates are correctly categorized), specificities (conditional probabilities that susceptible isolates are correctly catego-rized), and confidence intervals (CIs) were calculated using Clinical Re-search Calculator 1 (vassarstats.net/index.html). Fisher’s exact test with two-tailedPvalues, performed using an online calculator (www.graphpad
.com/quickcalcs/contingency1.cfm), was used to identify statistically
sig-nificant differences (P⬍0.05) between pairs of methods or media.
RESULTS
A total of 34 Scandinavian laboratories agreed to participate and
delivered data to the study. The results from six laboratories were
excluded because the laboratories did not deliver data on the
EUCAST disk diffusion method. Thus, results from 28
laborato-ries were included, i.e., 13 Norwegian, 10 Swedish, and five Danish
laboratories. The laboratories delivered data sets on the EUCAST
disk diffusion (
n
⫽
28), CLSI agar screen (
n
⫽
18), agar screen
using commercial chromogenic VRE media (
n
⫽
12), and Vitek 2
(
n
⫽
5) (bioMérieux) methods.
Routine phenotypic testing for vancomycin resistance in
en-terococci is done by CLSI agar screening in Norwegian
laborato-ries, while the EUCAST disk diffusion method is the preferred
method in Sweden. Three of the Danish laboratories were also
familiar with the EUCAST disk diffusion method for detection
of VRE.
EUCAST disk diffusion and CLSI agar screen methods
per-formed better than the Vitek 2 system.
VME and ME rates,
sen-sitivity, and specificity were calculated for each method or agar
type used (
Table 2
shows calculations for
n
ⱖ
5). None of the
tested methods scored as perfect. The sensitivity (0.87 to 0.93) and
specificity (0.94 to 1) values were high for the EUCAST disk
dif-fusion method, the CLSI agar screen, and the Vitek 2 system (
Ta-ble 2
). Overall, the EUCAST disk diffusion and CLSI agar screen
methods performed better than the Vitek 2 system (
Table 2
; also
see Table S1 in the supplemental material). Comparisons of the
methods with one another showed that both the disk diffusion
method and the CLSI agar screen performed significantly better
MIC (mg/L)N
u
mb
er
of
i
sol
a
tes
0 2 4 6 8 10 12 14
2 4 8 16 32 64 128 ≥ 256
MIC Etest
MIC broth microdiluon
FIG 1MIC distribution of the collection of blinded isolates (n⫽30).
on May 16, 2020 by guest
http://jcm.asm.org/
[image:3.585.62.266.65.213.2]than the Vitek 2 system in identifying the isolates as resistant or
susceptible (see Table S1).
The distribution of VMEs related to reference MIC values of
the isolates (data not shown) revealed that the troublesome
isolates for the disk diffusion and CLSI agar screen methods
mainly expressed low MIC values (4 to 8 mg/liter), whereas the
Vitek 2 system had more problems concerning detection of
moderate resistance levels (MICs, 16 to 32 mg/liter). The mean,
median, lowest, and highest numbers of errors per laboratory
for each method are reported in
Table 3
. The mean and median
A
B
C
D
FIG 2Examples of disk diffusion inhibition zones forEnterococcusspp. with 5-g vancomycin disks. (A) Cultures with sharp zone edges and zone diameters of
[image:4.585.117.476.67.390.2]ⱖ12 mm should be reported as susceptible. (B to D) Cultures with fuzzy zone edges (C and D) or colonies within the zone (B) should be reported as resistant, even if the zone diameter isⱖ12 mm.
TABLE 2Numbers of very major and major errors, sensitivity, and specificity calculated for each detection method and for each type of agar used
(fornⱖ5)a
Method (no. of laboratories)
No. of VMEs/total no. of isolates
withvangenotype (%) Sensitivity (95% CI)
No. of MEs/total no. of
susceptible isolates (%) Specificity (95% CI)
EUCAST disk diffusion (28) 53/756 (7.0) 0.93 (0.91–0.95) 2/84 (2.4) 0.98 (0.91–1) Oxoid MH agar (16) 14/432 (3.2) 0.97 (0.94–0.98) 0/48 1 (0.91–1) BBL MH II agar (10) 37/270 (14) 0.86 (0.81–0.90) 2/30 (6.7) 0.93 (0.76–0.99)
CLSI agar screen (18) 32/486 (6.6) 0.93 (0.91–0.95) 3/54 (5.6) 0.94 (0.84–0.99) Difco BHI agar (8) 9/216 (4.2) 0.96 (0.92–0.98) 0/24 1 (0.83–1) Oxoid BHI agar (5) 15/135 (11) 0.89 (0.82–0.93) 0/15 1 (0.75–1)
Chromogenic agar screen (12) 7/324 (2.2) 0.98 (0.95–0.99) 4/36 (11) 0.89 (0.73–0.96) chromID VRE agar (7) 3/189 (1.6) 0.98 (0.95–1) 1/21 (4.8) 0.95 (0.74–1) VRE CHROMagar (5) 4/135 (3.0) 0.97 (0.92–0.99) 3/15 (20) 0.8 (0.51–0.95)
Vitek 2 system (5) 18/135 (13) 0.87 (0.79–92) 0/15 (0) 1 (0.75–1) aIn VMEs, strains were classified as susceptible when containing thevangenotype. In MEs, strains were classified as resistant when containing novangenotype. According to
EUCAST rules for the disk diffusion assay with vancomycin, samples were considered resistant, although the zone size suggested susceptibility, if the zone edge was fuzzy or colonies were growing within the zone.
on May 16, 2020 by guest
http://jcm.asm.org/
[image:4.585.41.546.542.697.2]values were similar and low for the disk diffusion and CLSI agar
screen methods.
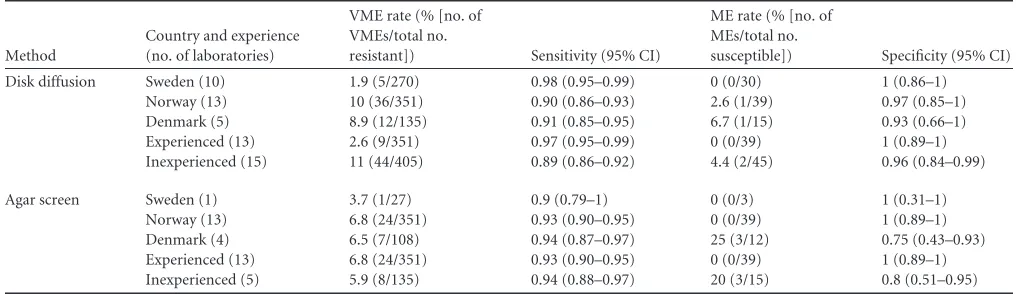
Experience and media influence the results of the EUCAST
disk diffusion method.
The observed numbers of VMEs and MEs,
as well as sensitivity and specificity, for the disk diffusion method
differed with laboratory country locations. Swedish laboratories,
which were experienced in using the disk diffusion method to
assess vancomycin resistance, in general performed better in
de-tecting the resistant isolates with the EUCAST disk diffusion
method (
Table 4
). Dividing the results according to the type of
MH agar used for disk diffusion indicated that BBL MH II agar did
not perform as well as Oxoid MH agar (
Table 2
) and Merck MH
agar. Statistical analyses showed that laboratories using Oxoid
MH agar (
P
⬍
0.0001) and Merck MH agar (
P
⫽
0.027)
per-formed significantly better than laboratories using BBL MH II
agar. The disk diffusion inhibition zones were read to be 0.8 mm
larger, on average, with BBL MH II agar than with Oxoid agar (
Fig.
3
). Resistant isolates had zone sizes of
ⱖ
12 mm more often on BBL
MH II agar than on other agars (
Fig. 3
).
Nine of 10 laboratories using BBL MH II agar were
inexperi-enced with the agar disk diffusion method for the detection of
VRE. Thus, the number of experienced users who reported results
with BBL MH II agar was too small to get a clear picture of whether
these errors were due to inexperience or agar characteristics (see
Tables S2 and S3 in the supplemental material). In line with this,
the four inexperienced laboratories using Oxoid MH agar were
not significantly better at identifying the isolates than the nine
inexperienced laboratories using BBL MH II agar.
Three laboratories performed disk diffusion assays using
Neo-Sensitabs 9-mm disks (Rosco Diagnostica A/S, Taastrup,
Den-mark). The VME rate (14%) and specificity of 1 for Neo-Sensitabs
were higher than the values for 6-mm disks (VME rate, 6.5%;
specificity, 0.98), while the ME rate (0%) and sensitivity (0.86)
were lower than those for 6-mm disks (ME rate, 2.2%; sensitivity,
0.93). Agar disk diffusion assays using 6-mm disks performed
sig-nificantly better (
P
⫽
0.042) than assays using Neo-Sensitabs in
identifying the isolates as resistant or susceptible. However, the
VME rate and sensitivity for assays with Neo-Sensitabs were
slightly different from values from inexperienced personnel using
6-mm disks (VME, 11%; sensitivity, 0.89), and agar disk diffusion
assays conducted by inexperienced personnel using 6-mm disks
did not perform significantly better than assays with
Neo-Sensit-abs in identifying the isolates as resistant or susceptible (data not
shown).
[image:5.585.42.553.77.141.2]Media influence the results of CLSI agar screening.
The
ob-served numbers of VMEs and MEs, sensitivity, and specificity for
the CLSI agar screen revealed that the Norwegian laboratories,
which were experienced in using agar screening for testing
vanco-mycin resistance, did not appear to be better in detecting resistant
isolates by this method than was the only participating Swedish
laboratory that reported data for this method (
Table 4
). The
lab-oratories using Oxoid agar (
Table 2
) and BBL BHI agar (data not
shown) for agar screening performed less well in revealing the
susceptibility category of isolates than did those using Difco BHI
agar. Laboratories using Difco BHI agar performed significantly
better (
P
⫽
0.017) than those using Oxoid BHI agar but just
in-significantly (
P
⫽
0.052) better than those using BBL BHI agar
(data not shown). Comparing only experienced laboratories,
Difco BHI agar performed significantly better in identifying
iso-lates correctly than did Oxoid BHI agar in the agar screen (see
Table S3 in the supplemental material). The numbers of
labora-tories using Scharlau or Acumedia BHI agar for agar screening
TABLE 3Mean, median, lowest, and highest numbers of errors per laboratory for each methoda
Method (no. of laboratories)
No. of VMEs/laboratory No. of MEs/laboratory
Mean Median Lowest Highest Mean Median Lowest Highest
EUCAST disk diffusion (28) 1.9 1 0 13 0.071 0 0 2
CLSI agar screen (18) 1.8 2 0 5 0.17 0 0 3
Vitek 2 system (5) 3.2 2.5 1 6 0 0 0 0
aIn VMEs, strains were classified as susceptible when containing thevangenotype. In MEs, strains were classified as resistant when containing novangenotype. The median
[image:5.585.38.546.568.715.2]number is the middle number in a numerically sorted list of numbers.
TABLE 4Numbers of very major and major errors, sensitivity, and specificity calculated for EUCAST disk diffusion and CLSI agar screen methods,
according to the country of the laboratories or their experience in using the detection methodsa
Method
Country and experience (no. of laboratories)
VME rate (% [no. of VMEs/total no.
resistant]) Sensitivity (95% CI)
ME rate (% [no. of MEs/total no.
susceptible]) Specificity (95% CI)
Disk diffusion Sweden (10) 1.9 (5/270) 0.98 (0.95–0.99) 0 (0/30) 1 (0.86–1) Norway (13) 10 (36/351) 0.90 (0.86–0.93) 2.6 (1/39) 0.97 (0.85–1) Denmark (5) 8.9 (12/135) 0.91 (0.85–0.95) 6.7 (1/15) 0.93 (0.66–1) Experienced (13) 2.6 (9/351) 0.97 (0.95–0.99) 0 (0/39) 1 (0.89–1) Inexperienced (15) 11 (44/405) 0.89 (0.86–0.92) 4.4 (2/45) 0.96 (0.84–0.99)
Agar screen Sweden (1) 3.7 (1/27) 0.9 (0.79–1) 0 (0/3) 1 (0.31–1) Norway (13) 6.8 (24/351) 0.93 (0.90–0.95) 0 (0/39) 1 (0.89–1) Denmark (4) 6.5 (7/108) 0.94 (0.87–0.97) 25 (3/12) 0.75 (0.43–0.93) Experienced (13) 6.8 (24/351) 0.93 (0.90–0.95) 0 (0/39) 1 (0.89–1) Inexperienced (5) 5.9 (8/135) 0.94 (0.88–0.97) 20 (3/15) 0.8 (0.51–0.95) aIn VMEs, strains were classified as susceptible when containing thevangenotype. In MEs, strains were classified as resistant when containing novangenotype.
on May 16, 2020 by guest
http://jcm.asm.org/
were too small to give any significant differences in comparison
with Oxoid and Difco BHI agar.
Agar screening using commercial chromogenic VRE media.
Agar screening using commercial chromogenic VRE media (
n
⫽
12) showed a higher ME rate (11%) and sensitivity (0.98) and
lower specificity (0.89) than values obtained with disk diffusion,
CLSI agar screening, and Vitek 2 methods (
Table 2
). The high ME
rates and lower specificities for commercial chromogenic VRE
agars indicate that their potential use in screening of clinical
strains for vancomycin resistance would result in many
false-pos-itive results. Comparison of the two different chromogenic VRE
media used showed slightly better performance of chromID VRE
agar than VRE CHROMagar medium (
Table 2
), but these results
were not statistically significant.
Different performance of AST cards used in the Vitek 2
sys-tem.
The Vitek 2 system results using different types of
antimicro-bial susceptibility test cards showed that card AST-P592 (VME
rate, 7.4%; sensitivity, 0.93) was better at identifying the isolates
correctly than were cards AST-P586 (VME rate, 20%; sensitivity,
0.80) and AST-P594 (VME rate, 11%; sensitivity, 0.89). However,
these results were not statistically significant.
DISCUSSION
We have examined the ability of the EUCAST disk diffusion assay,
the CLSI agar screen, and the Vitek 2 automated antimicrobial
susceptibility testing system to detect VanB-type VRE in a blinded
panel of well-characterized
E. faecalis
and
E. faecium
strains, with
or without low to medium levels of resistance to vancomycin. The
study was performed with a multicenter design involving clinical
laboratories in Denmark, Norway, and Sweden. All laboratories
tested the EUCAST agar disk diffusion method and in addition
one alternative method, i.e., the CLSI agar screen, commercial
chromogenic VRE agar screens, and/or automated systems.
In projects such as this, it is possible that project samples
re-ceive more attention than routine samples and that this
intro-duces bias in the evaluation of performance. On the other hand,
the results reveal the “best achievement level,” and knowing this is
valuable. Although none of the methods was perfect, the CLSI agar
screen and EUCAST agar disk diffusion methods showed
compa-rably high and acceptable sensitivity and specificity values.
Our results show that the ability to detect VRE by the agar disk
diffusion method is influenced by the experience of the personnel
in reading inhibition zones, while experience in the interpretation
of CLSI agar screen results is not that critical. For the agar screen
method, the choice of BHI agar and quality control of the
vanco-mycin concentration seemed to be more important for correct
identification of VRE. The notion that experience is more
impor-tant when using the disk diffusion method was supported by the
numbers calculated for the EUCAST disk diffusion and CLSI agar
screen methods for experienced versus inexperienced laboratories
(
Table 4
; see also Table S2 in the supplemental material).
Labora-tories experienced with the disk diffusion method performed
sig-nificantly better (
P
⬍
0.0001) in identifying the isolates as resistant
or susceptible by the disk diffusion method than did
inexperi-enced personnel (data not shown). Moreover, the mean and
me-dian error values were similar and low for the EUCAST disk
dif-fusion and CLSI agar screen methods, while the highest VME rates
for the EUCAST disk diffusion method were all reported from
laboratories that had no previous experience with use of the disk
diffusion method to detect low-level vancomycin resistance.
Comparing the different media in agar disk diffusion assays
showed that the resistant isolates more often had zone sizes of
ⱖ
12
mm on BBL MH II agar (
Fig. 3
), which would require experienced
readers to check the quality of zone edges in order to correctly
categorize isolates as resistant.
In this study, chromogenic VRE media gave the lowest VME
rates (
Table 2
) but the highest ME rates. In a recent study by Klare
et al., the VME rates of the chromogenic VRE screening media
were higher than those observed in our study (
36
). The higher
VME rates observed by Klare and coworkers could be due to their
selection of strains; 43/129 (33%) of their VanB-type
E. faecium
strains showed MICs of
ⱕ
4 mg/liter, thus pushing the detection
limits more than our collection, in which only 1 of 27 VRE isolates
showed a MIC of 4 mg/liter (
Table 1
).
It is important to have rapid routine antimicrobial
susceptibil-ity testing methods that yield results that can be easily interpreted
and communicated to clinicians. We have shown that results can
be influenced by the level of experience of the laboratory
person-nel and/or the media used. In this study, the participating
labora-tories were informed about the
van
status of the examined strain
collection after they reported their results. Subsequently, many
participants examined the samples again and reported that they
had read the troublesome samples incorrectly the first time. This
was specifically the case for the disk diffusion method. Detection
of low-level vancomycin-resistant isolates with the disk diffusion
method relies not only on evaluation of the zone size but also on
evaluation of the zone edges, which requires experience. Hence, it
is important to note that the EUCAST stresses that the zone edges
should be examined with transmitted light (the plate held up to
the light) and resistance suspected when the vancomycin zone
edge is fuzzy (
Fig. 2C
and
D
) or when colonies are growing within
the inhibition zone (
Fig. 2B
) and that glycopeptide susceptibility
tests on enterococci should be incubated for 24 h to ensure the
visibility of resistant colonies. These recommendations are
spe-cific for evaluating VRE and are different from those for reading
disk diffusion results for most other antimicrobials and species.
The sharp zones of susceptible isolates (
Fig. 2A
) are very
charac-teristic, in comparison with fuzzy zones. Thus, positive and
nega-tive controls for comparisons facilitate the evaluation of VRE with
low-level resistance. Moreover, the CLSI agar screen method
re-1 2 3 4 5 6 8 9
10 11 12 13 14 15 17 18 19 20 21 22 23 24 25 26 27 29 30
0 2 4 6 8 10 12 14 16 18
Isolate number
Zone
di
a
m
e
te
r
(
m
m
)
FIG 3Average zone diameters and standard deviations calculated for each
isolate from recorded results from laboratories using either Oxoid MH agar (䊐) or BBL MH II agar ().
on May 16, 2020 by guest
http://jcm.asm.org/
quires experienced personnel who can prepare and store the agar
plates correctly, so that the vancomycin concentration in the
plates is accurate.
It is well known that VanB-type VRE can be difficult to detect,
due to the inducible mechanism of resistance and the variable
levels of vancomycin resistance expressed (
12
,
37
). The strain
col-lection was designed to be genetically and epidemiologically
di-verse and to include troublesome isolates with low vancomycin
MICs in addition to ATCC reference strains (
Table 1
). The
vanB E.
faecalis
ATCC 51299 and
E. faecalis
ATCC 29212 strains are
rec-ommended as positive and negative quality controls, respectively,
for both the EUCAST disk diffusion (
34
) and CLSI agar screen
(
38
) methods. Twenty-one of the 28 laboratories in this study
reported using
vanB E. faecalis
ATCC 51299 and 5 laboratories
used various CCUG VanB-positive enterococcal strains as positive
controls. A previous evaluation of the
vanB E. faecalis
ATCC
51299 strain showed vancomycin MICs of 16 to 32 mg/liter after
24 h of incubation. After 48 h, however, a vancomycin MIC of 128
mg/liter was observed (
38
). A valid positive control is supposed to
challenge the detection limits of the method. In this study, the
vanB E. faecalis
ATCC 51299 strain was included in three copies in
the blinded test collection. According to the disk diffusion zone
sizes recorded in the different laboratories, this reference strain
does not seem to challenge the test conditions. All laboratories
were able to place this isolate well within the resistant category,
with zone diameters ranging from 6 to 9 mm. A more relevant
reference strain with a lower inducible vancomycin MIC should
be considered for quality control purposes.
In conclusion, our results demonstrate acceptable
perfor-mance by both the EUCAST disk diffusion and CLSI agar screen
methods. Both reliably detect VanB-type VRE with low-level
re-sistance. The high ME rates and lower specificities of commercial
chromogenic VRE agars indicate that their potential use in
screen-ing of clinical strains for vancomycin resistance would result in
many false-positive results. However, confirmation of the ME
rates and specificities calls for another study with more
vancomy-cin-susceptible strains included in the strain collection.
Impor-tantly, the use of the agar disk diffusion method requires
person-nel trained in the interpretation of zone edges, and use of the CLSI
agar screen method requires careful selection of control strains to
monitor the vancomycin concentration in the plates.
ACKNOWLEDGMENTS
We thank Bettina Aasnæs and Tracy Munthali Lunde for excellent tech-nical assistance.
The study was performed in collaboration with the diagnostic labora-tories in clinical microbiology in Norway, Sweden, and Denmark that form the NordicAST VRE Detection Study Group. Representatives of this study group included Kirsten Paulsen (Aalborg Hospital), Lars Erik Lem-ming (Aarhus University Hospital), Siri Haug Hänsgen (Akershus Uni-versity Hospital), Marianne Bäckman (Aleris Medilab), Jenny Åhman (EUCAST Laboratory for Antimicrobial Susceptibility Testing), Thomas Ahlqvist (Central Hospital Karlstad), Elisabeth Sirnes (Central Hospital Førde), Ann Cathrine Petersson (Department of Clinical Microbiology, Laboratory Medicine Lund), Håkan Janson (Department of Clinical Mi-crobiology, Laboratory Medicine Malmö), Ingegerd Sjögren (Hallands Hospital Halmstad), Kristin Stenhaug Kilhus (Haukeland University Hospital), Magnus Arpi (Herlev Hospital), Inger Brock (Hillerød Hospi-tal), Pia Littauer (Hvidovre HospiHospi-tal), Sara Gustavsson (Kalmar County Hospital), Hong Fang (Karolinska University Hospital Huddinge), Kirsti Jalakas Pörnull (Karolinska University Hospital Solna), Lennart E.
Nilsson (Linköping University Hospital), Margreet Boer (Molde Hospi-tal), Hege Elisabeth Larsen (Nordland Hospital Bodø), Anette Holm (Odense University Hospital), Pia Langseth (Rikshospitalet University Hospital), Ia Adlerberth (Sahlgrenska University Hospital), Ole Heltberg (Slagelse Hospital), Anette M. Hammerum (Statens Serum Institute), Anita Løvås Brekken (Stavanger University Hospital), Kjersti Wik Larssen (St. Olavs Hospital), Dagfinn Skaare (Vestfold Hospital), Anita Kanestrøm (Østfold Hospital), Ståle Tofteland (Sørlandet Hospital), Thea Bergheim (Ullevål University Hospital), Gunnar Skov Simonsen (University pital of North Norway), Angela Lagerqvist Vidh (Uppsala University Hos-pital), and Claus Østergaard (Velje Hospital).
REFERENCES
1.Werner G, Coque TM, Franz CM, Grohmann E, Hegstad K, Jensen L,
van Schaik W, Weaver K.2013. Antibiotic resistant enterococci: tales of
a drug resistance gene trafficker. Int. J. Med. Microbiol.303:360 –379.
http://dx.doi.org/10.1016/j.ijmm.2013.03.001.
2.Gilmore MS, Lebreton F, van Schaik W.2013. Genomic transition of
enterococci from gut commensals to leading causes of multidrug-resistant hospital infection in the antibiotic era. Curr. Opin. Microbiol.16:10 –16.
http://dx.doi.org/10.1016/j.mib.2013.01.006.
3.de Kraker ME, Jarlier V, Monen JC, Heuer OE, van de Sande N,
Grundmann H.2013. The changing epidemiology of bacteraemias in
Europe: trends from the European Antimicrobial Resistance Surveillance System. Clin. Microbiol. Infect.19:860 – 868.http://dx.doi.org/10.1111
/1469-0691.12028.
4.Gilmore MS, Ferretti JJ.2003. Microbiology: the thin line between gut
commensal and pathogen. Science299:1999 –2002.http://dx.doi.org/10
.1126/science.1083534.
5.Zhang X, Top J, de Been M, Bierschenk D, Rogers M, Leendertse M,
Bonten MJ, van der Poll T, Willems RJ, van Schaik W.2013.
Identifi-cation of a genetic determinant in clinicalEnterococcus faeciumstrains that contributes to intestinal colonization during antibiotic treatment. J. In-fect. Dis.207:1780 –1786.http://dx.doi.org/10.1093/infdis/jit076.
6.Arias CA, Contreras GA, Murray BE.2010. Management of multi-drug
resistant enterococcal infections. Clin. Microbiol. Infect. 16:555–562.
http://dx.doi.org/10.1111/j.1469-0691.2010.03214.x.
7.Hegstad K, Mikalsen T, Coque TM, Jensen LB, Werner G, Sundsfjord
A.2010. Mobile genetic elements and their contribution to the emergence of antimicrobial resistantEnterococcus faecalisandE. faecium. Clin. Mi-crobiol. Infect.16:541–554.http://dx.doi.org/10.1111/j.1469-0691.2010
.03226.x.
8.Xu X, Lin D, Yan G, Ye X, Wu S, Guo Y, Zhu D, Hu F, Zhang Y, Wang
F, Jacoby GA, Wang M.2010.vanM, a new glycopeptide resistance gene
cluster found inEnterococcus faecium. Antimicrob. Agents Chemother.
54:4643– 4647.http://dx.doi.org/10.1128/AAC.01710-09.
9.Lebreton F, Depardieu F, Bourdon N, Fines-Guyon M, Berger P,
Camiade S, Leclercq R, Courvalin P, Cattoir V. 2011. D-Ala-D-Ser
VanN-type transferable vancomycin resistance inEnterococcus faecium. Antimicrob. Agents Chemother. 55:4606 – 4612. http://dx.doi.org/10
.1128/AAC.00714-11.
10. Werner G, Coque TM, Hammerum AM, Hope R, Hryniewicz W,
Johnson A, Klare I, Kristinsson KG, Leclercq R, Lester CH, Lillie M, Novais C, Olsson-Liljequist B, Peixe LV, Sadowy E, Simonsen GS, Top
J, Vuopio-Varkila J, Willems RJ, Witte W, Woodford N.2008.
Emer-gence and spread of vancomycin resistance among enterococci in Europe. Euro Surveill.13(47):pii⫽19046.http://www.eurosurveillance.org/View
Article.aspx?ArticleId⫽19046.
11. Granlund M, Carlsson C, Edebro H, Emanuelsson K, Lundholm R.
2006. Nosocomial outbreak ofvanB2vancomycin-resistantEnterococcus faeciumin Sweden. J. Hosp. Infect.62:254 –256.http://dx.doi.org/10.1016
/j.jhin.2005.06.031.
12. Werner G, Klare I, Fleige C, Geringer U, Witte W, Just HM, Ziegler R.
2012. Vancomycin-resistantvanB-typeEnterococcus faeciumisolates ex-pressing varying levels of vancomycin resistance and being highly preva-lent among neonatal patients in a single ICU. Antimicrob. Resist. Infect. Control1:21.http://dx.doi.org/10.1186/2047-2994-1-21.
13. Bourdon N, Fines-Guyon M, Thiolet JM, Maugat S, Coignard B,
Leclercq R, Cattoir V.2011. Changing trends in vancomycin-resistant
enterococci in French hospitals, 2001– 08. J. Antimicrob. Chemother.66: 713–721.http://dx.doi.org/10.1093/jac/dkq524.
on May 16, 2020 by guest
http://jcm.asm.org/
14. Söderblom T, Aspevall O, Erntell M, Hedin G, Heimer D, Hökeberg I, Kidd-Ljunggren K, Melhus Å, Olsson-Liljequist B, Sjögren I,
Smed-jegård J, Struwe J, Sylvan S, Tegmark-Wisell K, Thore M.2010.
Alarm-ing spread of vancomycin resistant enterococci in Sweden since 2007. Euro Surveill.15(29):pii⫽19620.http://www.eurosurveillance.org/View
Article.aspx?ArticleId⫽19620.
15. Bjørkeng EK, Rasmussen G, Sundsfjord A, Sjöberg L, Hegstad K,
Söderquist B.2011. Clustering of polyclonal VanB-type
vancomycin-resistantEnterococcus faeciumin a low-endemic area was associated with CC17-genogroup strains harbouring transferablevanB2-Tn5382and pRUM-likerepAcontaining plasmids withaxe-txeplasmid addiction sys-tems. APMIS 119:247–258. http://dx.doi.org/10.1111/j.1600-0463.2011
.02724.x.
16. Johnson PD, Ballard SA, Grabsch EA, Stinear TP, Seemann T, Young
HL, Grayson ML, Howden BP.2010. A sustained hospital outbreak of
vancomycin-resistantEnterococcus faeciumbacteremia due to emergence ofvanB E. faeciumsequence type 203. J. Infect. Dis.202:1278 –1286.http:
//dx.doi.org/10.1086/656319.
17. Dahl KH, Simonsen GS, Olsvik Ø, Sundsfjord A.1999. Heterogeneity in
thevanBgene cluster of genomically diverse clinical strains of vancomy-cin-resistant enterococci. Antimicrob. Agents Chemother.43:1105–1110.
18. Gold HS, Unal S, Cercenado E, Thauvin Eliopoulos C, Eliopoulos GM,
Wennersten CB, Moellering RC, Jr.1993. A gene conferring resistance to
vancomycin but not teicoplanin in isolates ofEnterococcus faecalisand Enterococcus faeciumdemonstrates homology withvanB,vanA, andvanC genes of enterococci. Antimicrob. Agents Chemother. 37:1604 –1609.
http://dx.doi.org/10.1128/AAC.37.8.1604.
19. Patel R, Uhl JR, Kohner P, Hopkins MK, Steckelberg JM, Kline B,
Cockerill FR III. 1998. DNA sequence variation withinvanA, vanB,
vanC-1, andvanC-2/3genes of clinicalEnterococcusisolates. Antimicrob. Agents Chemother.42:202–205.
20. Courvalin P.2006. Vancomycin resistance in Gram-positive cocci. Clin.
Infect. Dis.42(Suppl 1):S25–S34.http://dx.doi.org/10.1086/491711.
21. Boyce JM, Opal SM, Chow JW, Zervos MJ, Potter-Bynoe G, Sherman
CB, Romulo RL, Fortna S, Medeiros AA.1994. Outbreak of
multidrug-resistantEnterococcus faeciumwith transferablevanBclass vancomycin resistance. J. Clin. Microbiol.32:1148 –1153.
22. European Committee on Antimicrobial Susceptibility Testing. 2013.
Breakpoint tables for interpretation of MICs and zone diameters, version 3.1, 2013. http://www.eucast.org/fileadmin/src/media/PDFs/EUCAST
_files/Breakpoint_tables/Breakpoint_table_v_3.1.pdf.
23. Hayden MK, Trenholme GM, Schultz JE, Sahm DF. 1993. In vivo
development of teicoplanin resistance in a VanBEnterococcus faecium iso-late. J. Infect. Dis.167:1224 –1227.http://dx.doi.org/10.1093/infdis/167.5
.1224.
24. Kawalec M, Gniadkowski M, Kedzierska J, Skotnicki A, Fiett J,
Hrynie-wicz W.2001. Selection of a teicoplanin-resistantEnterococcus faecium
mutant during an outbreak caused by vancomycin-resistant enterococci with thevanBphenotype. J. Clin. Microbiol.39:4274 – 4282.http://dx.doi
.org/10.1128/JCM.39.12.4274-4282.2001.
25. San Millan A, Depardieu F, Godreuil S, Courvalin P.2009. VanB-type
Enterococcus faeciumclinical isolate successively inducibly resistant to, de-pendent on, and constitutively resistant to vancomycin. Antimicrob. Agents Chemother.53:1974 –1982.http://dx.doi.org/10.1128/AAC.00034-09.
26. Holmes NE, Ballard SA, Lam MM, Johnson PD, Grayson ML, Stinear
TP, Howden BP.2013. Genomic analysis of teicoplanin resistance
emerg-ing duremerg-ing treatment ofvanBvancomycin-resistantEnterococcus faecium infections in solid organ transplant recipients including donor-derived cases. J. Antimicrob. Chemother. 68:2134 –2139. http://dx.doi.org/10
.1093/jac/dkt130.
27. Dutka-Malen S, Evers S, Courvalin P.1995. Detection of glycopeptide
resistance genotypes and identification to the species level of clinically relevant enterococci by PCR. J. Clin. Microbiol.33:24 –27.
28. Fines M, Perichon B, Reynolds P, Sahm DF, Courvalin P.1999. VanE,
a new type of acquired glycopeptide resistance inEnterococcus faecalis BM4405. Antimicrob. Agents Chemother.43:2161–2164.
29. Depardieu F, Perichon B, Courvalin P. 2004. Detection of the van
alphabet and identification of enterococci and staphylococci at the species
level by multiplex PCR. J. Clin. Microbiol.42:5857–5860.http://dx.doi
.org/10.1128/JCM.42.12.5857-5860.2004.
30. Dahl KH, Lundblad EW, Røkenes TP, Olsvik Ø, Sundsfjord A.2000.
Genetic linkage of thevanB2gene cluster to Tn5382in vancomycin-resistant enterococci and characterization of two novel insertion se-quences. Microbiology146:1469 –1479.
31. International Organization for Standardization.2006. Clinical
labora-tory testing andin vitrodiagnostic test systems: susceptibility testing of infectious agents and evaluation of performance of antimicrobial suscep-tibility test devices. Part 1: reference method for testing thein vitroactivity of antimicrobial agents against rapidly growing aerobic bacteria involved in infectious diseases. Publication ISO 20776 –1. International Organiza-tion for StandardizaOrganiza-tion, Geneva, Switzerland.
32. Dahl KH, Røkenes TP, Lundblad EW, Sundsfjord A.2003.
Nonconju-gative transposition of thevanB-containing Tn5382-like element in En-terococcus faecium. Antimicrob. Agents Chemother.47:786 –789.http://dx
.doi.org/10.1128/AAC.47.2.786-789.2003.
33. Harthug S, Digranes A, Hope O, Kristiansen BE, Allum AG, Langeland
N.2000. Vancomycin resistance emerging in a clonal outbreak caused by ampicillin-resistantEnterococcus faecium. Clin. Microbiol. Infect.6:19 –
28.http://dx.doi.org/10.1046/j.1469-0691.2000.00008.x.
34. European Committee on Antimicrobial Susceptibility Testing. 2013.
Antimicrobial susceptibility testing: EUCAST disk diffusion method, ver-sion 3.0, 2013. http://www.eucast.org/fileadmin/src/media/PDFs /EUCAST_files/Disk_test_documents/Manual_v_3.0_EUCAST_Disk
_Test.pdf.
35. Swenson JM, Clark NC, Ferraro MJ, Sahm DF, Doern G, Pfaller MA,
Reller LB, Weinstein MP, Zabransky RJ, Tenover FC.1994.
Develop-ment of a standardized screening method for detection of vancomycin-resistant enterococci. J. Clin. Microbiol.32:1700 –1704.
36. Klare I, Fleige C, Geringer U, Witte W, Werner G.2012. Performance
of three chromogenic VRE screening agars, two EtestRvancomycin
pro-tocols, and different microdilution methods in detectingvanBgenotype Enterococcus faeciumwith varying vancomycin MICs. Diagn. Microbiol. Infect. Dis. 74:171–176. http://dx.doi.org/10.1016/j.diagmicrobio.2012
.06.020.
37. Grabsch EA, Chua K, Xie S, Byrne J, Ballard SA, Ward PB, Grayson
ML.2008. Improved detection ofvanB2-containingEnterococcus faecium with vancomycin susceptibility by Etest using oxgall supplementation. J. Clin. Microbiol.46:1961–1964.http://dx.doi.org/10.1128/JCM.01778-07.
38. Swenson JM, Clark NC, Sahm DF, Ferraro MJ, Doern G, Hindler J,
Jorgensen JH, Pfaller MA, Reller LB, Weinstein MP.1995. Molecular
characterization and multilaboratory evaluation ofEnterococcus faecalis ATCC 51299 for quality control of screening tests for vancomycin and high-level aminoglycoside resistance in enterococci. J. Clin. Microbiol. 33:3019 –3021.
39. Kim EB, Kopit LM, Harris LJ, Marco ML.2012. Draft genome sequence
of the quality control strainEnterococcus faecalisATCC 29212. J. Bacteriol.
194:6006 – 6007.http://dx.doi.org/10.1128/JB.01423-12.
40. Depardieu F, Bonora MG, Reynolds PE, Courvalin P.2003. ThevanG
glycopeptide resistance operon fromEnterococcus faecalisrevisited. Mol. Microbiol.50:931–948.http://dx.doi.org/10.1046/j.1365-2958.2003
.03737.x.
41. Carias LL, Rudin SD, Donskey CJ, Rice LB.1998. Genetic linkage and
cotransfer of a novel,vanB-containing transposon (Tn5382) and a low-affinity penicillin-binding protein 5 gene in a clinical vancomycin-resistantEnterococcus faeciumisolate. J. Bacteriol.180:4426 – 4434.
42. Rosvoll TC, Pedersen T, Sletvold H, Johnsen PJ, Sollid JE, Simonsen
GS, Jensen LB, Nielsen KM, Sundsfjord A.2010. PCR-based plasmid
typing inEnterococcus faeciumstrains reveals widely distributed pRE25-, pRUM-, pIP501- and pHT-related replicons associated with glycopep-tide resistance and stabilizing toxin-antitoxin systems. FEMS Immunol. Med. Microbiol. 58:254 –268. http://dx.doi.org/10.1111/j.1574-695X
.2009.00633.x.
43. Nallapareddy SR, Wenxiang H, Weinstock GM, Murray BE. 2005.
Molecular characterization of a widespread, pathogenic, and antibiotic resistance-receptiveEnterococcus faecalislineage and dissemination of its putative pathogenicity island. J. Bacteriol.187:5709 –5718.http://dx.doi
.org/10.1128/JB.187.16.5709-5718.2005.