Comparative Study on Skin Cancer Using the
Approach of Data Mining
Masilamani1, G.D.Praveenkumar2, R.Gayathri3
1
Research Scholar, Department of CA & IT, Kaamadhenu Arts & Science College, Sathy
2
Asst. Professor, Department of Computer Science, Bharathiar University Arts & Science College Gudalur
3#
Asst.professor, Department of CA & IT, Kaamadhenu Arts & Science College, Sathy
Abstract- This paper deals with skin cancer and its factors. The skin cancer is a new formation of cancer speared in all around the Earth. It developed by sunrays affected by human body. In the resent years medical data evaluated in Data mining applied and analyze the national record aiming at the discovery of new knowledge useful for medical decision making. The idea of medical data mining is to extract hidden knowledge in medical field using data mining techniques. The research data sets are collected from various website. The data set are tested in R-mininer. We are implemented in different classification and clustering algorithm to evaluate the skin cancer(melanoma) dataset .
Key words- cancer, medical data mining, classification and clustering algorithm
I. INTRODUCTION
Data warehousing and knowledge management technologies can contribute a lot of decision support system in health care. The medical database has gathered large quantities of information about patients and their medical condition. These articles have collection of skin cancer datasets are evaluated from different data mining algorithm. Data mining is the non trivial extraction of implicit previously unknown and potentially useful information about the data. They contain medical data set is also called medical data mining. A huge amount of medical records are stored in database.
A. Skin cancer
Skin cancer is a common, usually low-grade cancerous (malignant) growth of the skin. It starts from cells that begin as normal skin cells and transform into those with the potential to reproduce in an out-of-control manner. Unlike other cancers, the vast majority of skin cancers have no potential to spread to other parts of the body (metastasize) and become life-threatening.
1) Melanoma: Less common than other types, melanoma is by far the most dangerous, causing about 75 percent of all skin cancer-related deaths (American Melanoma Foundation, 2009). It occurs in the skin cells that create pigment, and it creates moles or lesions that follow an ABCDE pattern in their irregularities:
a) asymmetrical shape b) border irregularities c) color
d) diameter
e) evolution of the lesion
Fig 1 melanoma
The Four Major Types of Melanoma
©IJRASET: All Rights are Reserved
690
b) Lentigo maligna melanoma: Usually affects the elderly; involves large, flat, brownish lesions
c) Nodular melanoma: Can be dark blue, black, orreddish-blue, but may have no color at all. It usually starts as a raised patch. d) Acral lentiginous melanoma: The least common type; typically affects the palms, soles of the feet, or under finger and toenails.
II. REVIEW OF LITERATURE
Children have more opportunities and time than adults to be exposed to sunlight and thus more opportunities to increase their risk of developing skin cancer. At least 25% of a person’s lifetime UV exposure occurs during childhood.
Muhammed Akmal Sapon , Khadijah Ismail and Suehazlyn Zainudin presented a study of supervised learning algorithms of Artificial Neural Network on diabetes prediction. By using Regression Analysis, the performance of each algorithm is discussed. To validate the prediction accuracy, the prediction accuracy algorithm is calculated. The best performance is produced by Bayesian Regulation algorithm in the prediction of diabetes.
Zakaria Nouir, et . al applied a new fuzzy clustering algorithm to a prediction tool of a third generation (3G) cellular radio network. Outcomes explain that the differences between simulation and the measurements can be diminished and the generalization capacity is improved to the proposed clustering algorithm. This algorithm performs better than the K- means algorithm. This algorithm is used to improve the generalization capabilities that use measurements to reduce the bias between reality and simulation and to prevent over- learning. This algorithm is used to predict the stochastic transfer function between s measurements and simulations. Hence improve the quality and precision of the simulations.
Doug Burdick , et. al performed study for mining maximal frequent item sets from a large transactional database by using MAFIA algorithm. When extracting long item sets MAFIA performs best. MAFIA is highly optimized for mining long item sets and on dense data consistently outperforms Depth project by ten to thirty and Gen Max by two to ten.
III. METHODOLOGY
A. Over view of R-mining tool
R is a system for statistical computation and graphics. It consists of a language plus a run-time environment with graphics, a debugger, access to certain system functions, and the ability to run programs stored in script files. The design of R has been heavily influenced by two existing languages: Becker, Chambers & Wilks’ Sand Sussman’s.Whereas the resulting language is very similar in appearance to S, the underlying implementation and semantics are derived from Scheme.The core of R is an interpreted computer language which allows branching and looping as well as modular programming using functions. Most of the user-visible functions in R are written in R. It is possible for the user to interface to procedures written in the C, C++, or FORTRAN languages for efficiency. The R distribution contains functionality for a large number of statistical procedures. Among these are: linear and generalized linear models, nonlinear regression models, time series analysis, classical parametric and nonparametric tests, clustering and smoothing. There is also a large set of functions which provide a flexible graphical environment for creating various kinds of data presentations. R was initially written by Ross Ihaka and Robert Gentleman at the Department of Statistics of the University of Auckland in Auckland, New Zealand. In addition, a large group of individuals has contributed to R by sending code and bug reports.
B. Data sets
Data sets are collected from the various website in around India during the year of 2000-2015.The data sets are basic concept of Data Mining. It contain less number of attribute and instance.
C. Data preprocessing
The data processing process contain, Data normalization, Data preparation, Data transformation,
Data cleaning, Data formatting. After preprocess are dataset are ready to uses in the tools and display the given details of melanoma. Data transformation report for melnoma
MELANOMA
N missing unique Info Mean 11 0 8 0.95 47151
% 9 36 9 9 9 9 9 9
YEA R
12000 20000 15000 35000
2 0 0 2 2 0 1 0 1 2 0 0 0 2 0 0 0 0 ORAL OESOPHA GUS 1 0 0 0 0 2 5 0 0 0 1 5 0 0 0 3 5 0 0 0 STOMA CH
2002 2008 2014 10000 25000 30000 60000
3 0 0 0 0 6 0 0 0 0 MELANOMA
Rattle 2016-Feb-23 15:00:58 system1
Fig.2 visualize the all cancer result
D. Performing different classification and clustering algorithm in R mining
1) Classification: Classification is the most commonly applied data mining technique, which employs a set of pre-classified examples to develop a model that can classify the population of records at large. Fraud detection and credit risk applications are particularly well suited to this type of analysis. This approach frequently employs decision tree or neural network –based classification algorithms. The data classification process involves learning and classification. In learning the training data are analyzed by classification test data are used to estimate the accuracy of the classification rules. If the accuracy is acceptable the rules can be applied to the new data tuples. For a fraud detection application, this would include complete records of both fraudulent and valid activities determined on a record-by-record basis. The classifier-training algorithm uses these pre-classified examples to determine the set of parameter required for proper discrimination. The algorithm then encodes these parameters into a model called a classifier.
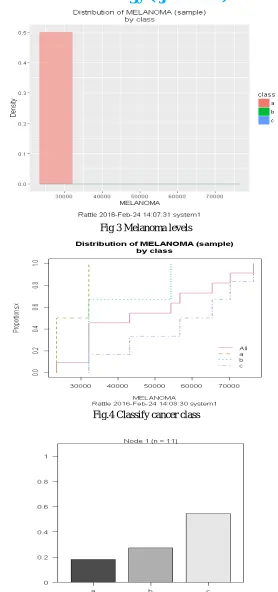
a) Decision Tree: Summary of the Decision Tree model for Classification (built using 'rpart'): n= 11
node), split, n, loss, yval, (yprob) * denotes terminal node
1) root 11 5 c (0.1818182 0.2727273 0.5454545) * Classification tree:
rpart(formula = class ~ ., data = crs$dataset[crs$train, c(crs$input, crs$target)],
method = "class", parms = list(split = "information"), control = rpart.control(usesurrogate = 0, maxsurrogate = 0)) Variables actually used in tree construction:
character(0)
Root node error: 5/11 = 0.45455 n= 11
©IJRASET: All Rights are Reserved
692
Fig 3 Melanoma levels
Fig.4 Classify cancer class
b) Random Forest: Summary of the Random Forest Model ==================================
Number of observations used to build the model: 11 Call:
randomForest(formula = class ~ .,
data = crs$dataset[crs$sample, c(crs$input, crs$target)],
ntree = 50, mtry = 2, sampsize = c(3), importance = TRUE, replace = FALSE, na.action = na.omit) Type of random forest: classification
Number of trees: 50
No. of variables tried at each split: 2 OOB estimate of error rate: 27.27% Confusion matrix:
a b c class.error a 0 2 0 1.0000000 b 0 3 0 0.0000000 c 0 1 5 0.1666667 Variable Importance ===================
A b c MeanDecreas Accuracy MeanDecreaseGini ORAL 0.00 1.96 3.34 2.94 0.32
LUNGS 1.79 1.44 2.84 2.86 0.29 MELANOMA 1.01 -0.58 1.96 1.37 0.23 BREAST 0.00 1.37 1.07 1.29 0.22 OESOPHAGUS 1.79 2.21 1.03 2.02 0.23 STOMACH -1.44 -1.44 -1.60 -1.86 0.26 Time taken: 0.03 secs
STOMACH BREAST MELANOMA OESOPHAGUS LUNGS ORAL
-2 -1 0 1 2 3
MeanDecreaseAccuracy BREAST MELANOMA OESOPHAGUS STOMACH LUNGS ORAL
0.00 0.10 0.20 0.30
MeanDecreaseGini
Variable Importance Random Forest SKIN CANCER.csv
©IJRASET: All Rights are Reserved
694
Fig.7Error rate in random tree
2) Clustering: Clustering is a technique for identification of similar classes of objects. By using clustering techniques we can further identify dense and sparse regions in object space and can discover overall distribution pattern and correlations among data attributes. Classification approach can also be used for effective means of distinguishing groups or classes of object but it becomes costly so clustering can be used as preprocessing approach for attribute subset selection and classification. For example, to form group of customers based on purchasing patterns, to categories genes with similar functionality.
Some commonly used clustering methods are: Partition methods
Hierarchical Agglomerative (divisive)methods Density based methods
Grid based methods Model-based methods
a) K-means clustering: K-means clustering is a well known partitioning method. In this objects are classified as belonging to one of K-groups. The results of partitioning method are a set of K clusters, each object of data set belonging to one cluster. In each cluster there may be a centroid or a cluster representative. In case where we consider real-valued data, the arithmetic mean of the attribute vectors for all objects within a cluster provides an appropriate representative; alternative types of centroid may be required in other cases.
Algorithm for K-means clustering.
i) Arbitrary select K web documents as seeds, they are the initial centroids of each cluster.
ii) Assign all other webdocuments to the closest centroid.
iii) Computer the centroid of each cluster again. Get new centroid of each cluster
iv) Repeat step2,3, until the centroid of each cluster doesn’t change. Cluster sizes:
[1] "2 3 6" Data means:
ORAL OESOPHAGUS STOMACH MELANOMA BREAST LUNGS 0.4113031 0.3987009 0.4231978 0.4465042 0.4379855 0.4593516
ORAL OESOPHAGUS STOMACH MELANOMA BREAST LUNGS 1 0.8322876 0.9218905 0.4630650 0.8140652 0.9188016 0.9224234
2 0.6442259 0.3874049 0.3135914 0.6822821 0.0966851 0.5017394 3 0.1545136 0.2299523 0.4647119 0.2060948 0.4483637 0.2838004 Within cluster sum of squares:
[1] 0.2264574 0.3397636 1.6174838 Time taken: 0.03 secs
Fig.8 k-means cluster in cancer
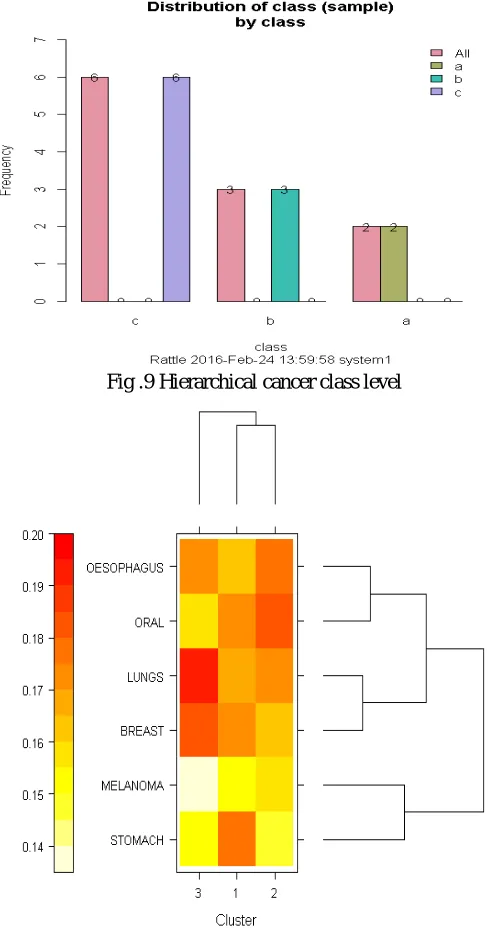
b) Hierarchical Clustering: Hierarchical methods are well known clustering technique that can be potentially very useful for various data mining tasks. A hierarchical clustering scheme produces a sequence of clustering in which each clustering is nested into the next clustering in the sequence. Since hierarchical clustering is a greedy search algorithm based on a local search, the merging decision made early in the agglomerative process are not necessarily the right ones. One possible solution to this problem is to refine a clustering produced by the agglomerative hierarchical algorithm to potentially correct the mistakes made early in the agglomerative process. Hierarchical methods are commonly used for clustering in Data Mining. A hierarchical clustering scheme produces a sequence of clustering in which each clustering is nested into the next clustering in the sequence Hierachical Cluster
Call:
hclusterpar(x = na.omit(crs$dataset[crs$sample, crs$numeric]), method = "manhattan", link = "ward", nbproc = 2) Cluster method : ward
©IJRASET: All Rights are Reserved
[image:9.612.179.424.92.559.2]696
Fig .9 Hierarchical cancer class level
Fig.10 Hierarchical cancer cluster levels TABLE I: Comparison of different classification result
CLASSIFICATION
PARTICULARS DECISION TREE RANDOM FOREST
Node 11 11
Eroor 0.45455 27.27
Split 10.01 2
Time taken 0.02 0.03
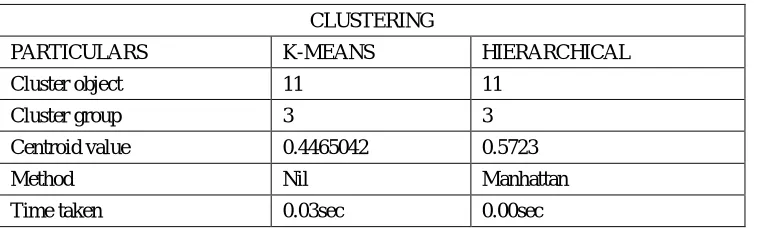
TABLE II: Comparison of different clusteringn result
CLUSTERING
PARTICULARS K-MEANS HIERARCHICAL Cluster object 11 11
Cluster group 3 3 Centroid value 0.4465042 0.5723 Method Nil Manhattan Time taken 0.03sec 0.00sec
IV. CONCLUSION
Global warming is drawbacks of produced high light rays .The skin cancer is rapid growing infection ,the cancer specialist are try to control all types of cancer in their world, mostly children and teenage are affected. At the request of the government of national teuitory of Delhi the ICMR helped them in development strategy for cancer control in Delhi this collaboration helped in identifying the requirement for training of the medical officers in cancer control activities. The cancer data sets are produced in R-mining tool and calculate the performance and evaluation of different classification and clustering algorithm in this paper.
REFERENCES
[1] Ramanath Takiar, DeenuNadayil, A.Nanadha Kumar, ”Projection of number of cancer cares in India by cancer groups” ‘Asian Pacific found of cancer prevention vol 11,2010,pp-1045 to 1049.
[2] National cancer registry program me (2008),north east population based cancer registries 2000-2015,India.
[3] Sharma.n and Om.H(2012) Framework for early detection and prevention of oral cancer using data mining International journal of advanced engineering technology,4,302-310.