5
VIII
August 2017
482
©IJRASET (UGC Approved Journal): All Rights are ReservedIntrusion Detection System using Gradient Boosted
Trees for VANETs
Priyanka Gulati1 , Kamal Gupta2
1,2 Computer Science and Engineering Department GNI, Mullana GNI, Mullana
Abstract: Vehicular Ad-hoc Network (VANETs) support intelligent transportation and helps vehicles to form a self configurable network without depending on any centralized authority. Security is a major obstacle due to decentralization of VANETs. An Intrusion Detection System (IDS) is a set of software that monitors a single or a network of computers for malicious activities (attacks) aiming at stealing or tampering data or corrupting network protocol usual routing behavior. In this paper, IDS using evolutionary optimized gradient boosted trees has been proposed to combat flooding attack in VANET. The proposed model has been compared with existing models in terms of accuracy, sensitivity, specificity, AUC, Kappa. The results obtained shows that proposed model performs better than existing models.
Keywords: Machine Learning, IDS, Security, Gradient Boosting, Evolutionary Optimization
I. INTRODUCTION
VANETs are appearing as an encouraging field in wireless technology which aims to create a mobile network in which vehicles communicate with each other in the absence of centralized architecture that helps to improve the road safety by exchanging the messages among vehicles or by providing new convenient services to the road users [6]. Security is the crucial aspect in the VANETS. In order to provide security to the system, VANET should deal with the Authentication, Availability, Non-Repudiation, Integrity, and Confidentiality. In VANETS, due to high mobility, rapidly changing network topology, real time constraint, data consistency liability, environmental impact, vehicles are not stable. So, security is still an issue in ad-hoc network. There are innumerable attacks that affect on the security of the VANET such as DoS, blackhole, Sybil wormhole attacks etc [7].
A fruitful approach to protect the network from various attacks is the implementation of Intrusion Detection System (IDS). Intrusion means to break in the system by compromising the integrity, confidentiality and availability of the resource. Intrusion Detection means to recognize the interference done by the attacker to maintain the security of the system. Intrusion Detection System is a system that checks the abnormal activities of an entity in the network. If it detect any malicious activity then alerts the system administrator.
Two key attributes that need to be identified with respect to IDS are False alarm ratio and Detection ratio. For efficient IDS, False alarm ratio should be less and detection ratio should be high.
II. RELATED WORK
Bhavsar et al. [10] proposed an intrusion detection system using support vector machine (SVM) to detect intrusion into the network. SVM consists of classification and verification method to lower the extensive training time. To achieve this goal, it has used three functions: Gaussian Kernel (Radial Basis Function), Polynomial kernel and Sigmoid kernel. Chen et al. [15] proposed a SVM model based on compressive sampling for feauture compression for network anamoly detection.
Rai et al. [16] proposed Decision Tree Split algorithm based on C4.5 decision tree. The feature selection is done using information gain and the split value is selected in such a way that makes the classifier unbiased towards most frequent values. The classifier used NSL-KDD (Network Security Laboratory Knowledge Discovery and Data Mining) dataset and accuracy achieved is compared with other existing classifiers such as Classification and Regression Tree (CART), Naïve Bayes (NB) Tree, and Alternating Decision (AD) Tree. Altwaijry et al. [8] presented a Bayesian based intrusion detection system to detect the feasible intrusions over the network. All attack records and normal records are tested using Bayesian filter and then outcomes are compared with the following algorithms: Gaussian classifier, SVM, K-means clustering etc. to increase the detection rate of R2L attacks.
483
©IJRASET (UGC Approved Journal): All Rights are ReservedPrinciple components are extracted using Generalized Hebbian Algorithm (GHA). Liang Hu et al. [14] presented a feature selection algorithm and three neural network algorithms to enhance the development of IDS. Back Propagation (BP), Radial Basis Function (RBF) and Neural Networks with Random Weights (RNN) were the three algorithms used to figure out the feasibility of the IDS combined with the feature selection algorithm.
III. MACHINE LEARNING TECHNIQUES FOR IDS
Machine learning is the branch of computer science and a principal constituent of Soft Computing which emphasizes on simulating the human thought process for forging out crucial decisions [4]. It delves into the domain of automation for prediction by analysis, self-learning and self-evolution on the context available. The most commonly used machine learning algorithms used are as follows:
A. Artificial Neural Network
these are used to model/simulate the distribution, functions or mappings among variables as modules of a dynamic system associated with a learning rule or a learning algorithm. The modules here simulate neurons in nervous system and hence ANN collectively refers to the neuron simulators and their synapsis simulating interconnections between these modules in different layers [1]. The defining aspect of an ANN is the function implemented at each neuron and the learning algorithm for the dynamic weights assigned to the interconnections among neurons.
B. Naïve Bayes
Rather than a single classifier it actually is a combination of multiple classifiers all working on the basic Naïve Bayes principle of independent features [9]. Hence each feature is assumed to be independent and autonomous contributing individually to the training data point’s probability of belonging to a particular class.
C. Support Vector Machine
It constructs a hyper plane i.e. a plane in an infinite dimension plane to classify the training data points into clearly demarcated classes [17]. The construction of an optimal decision plane for classification requires minimizing the error function. The shape of the error function becomes the foundation for further classification of these algorithms in the broad categories of linear, polynomial, sigmoid and radial SVMs.
So putting in simple terms the philosophy of SVM is to obtain an optimal hyper plane for data points which are linearly separable. Support vectors actually refer to the data points that are closest to the demarcating surface which are hence tricky to classify. The metric that alludes to the optimality of a hyper plane is the margin around the hyper plane. So the problem transitions into that of an optimization one. As established the maximum margin classifier learnt and derived from the training data would lead us to optimal hyper plane. This is achieved by transforming the maximal margin classifier as the inner product (sum of multiplication of pair values) of two given data points rather than the data points.
D. Logistic Regression
Logistic regression is a statistical method for analyzing a dataset in which there are one or more independent variables that determine an outcome which is binary i.e. 0 or 1/true or false [2]. The goal of logistic regression is to find the best fitting model to describe the relationship between the dependent variable and a set of independent (predictors) variables.
IV. PROPOSED MODEL
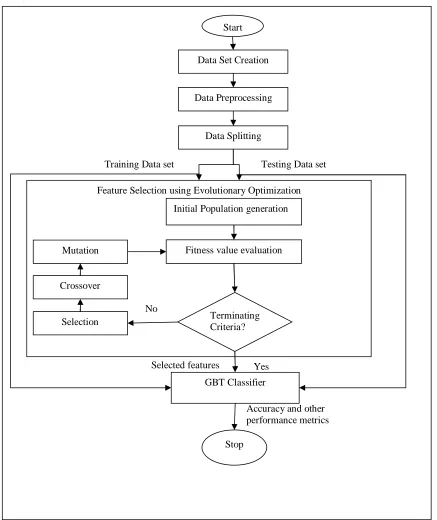
RREQ flooding attack is one of the most serious security threats in VANET environment. In this attack, a malicious node floods the network with RREQs to an unknown destination and consumes network resources due to which legitimate nodes are denied of network services [11]. The proposed model used to detect RREQ Flooding attack in AODV [12] consists of Gradient Boosted Tree (GBT) as a classifier and evolutionary optimization for feature selection. We have used NS-2 [5] for creating data set and launching RREQ Flooding attack. It consists of 5 stages: Data set creation, Data preprocessing, Feature Subset selection, Training using a classifier.
484
©IJRASET (UGC Approved Journal): All Rights are ReservedThe first stage is creation of dataset by launching the attack using tools such as Simulation of Urban Mobility (SUMO), MObility model generator for VEhicular network (MOVE) [3] and NS-2 [5]. SUMO is used for handling large road networks. MOVE allows users to rapidly generate realistic mobility models for VANETs simulations. MOVE is built on top of SUMO. SUMO creates the road maps, edges, curves and vehicle movement with the help of MOVE. The output of MOVE is a realistic mobility model and is provided as an input to NS-2. The trace file obtained after running the simulation is used further by classifying engine. The trace file is obtained for both normal AODV and AODV under DoS attack. The tracefile comprises of 999 instances, 22 attributes and is being divided into 2 classes representing normal AODV and AODV under attack.
B. Data Preprocessing
The real data gathered above might contain erroneous data or some missing value. There is a need to convert this raw data into meaningful information so data preprocessing is required. It involves removing entries that are 0 and replacing missing values to make dataset more robust and unbiased.
In this phase, the non integer values like TCP, AODV, MAC, RTR, AGT, etc are converted into integer. The columns with hexadecimal values are also converted into integers. This dataset involves attributes with different units and scales. For example, Event field has 3 values s, r and d and 1, 2 and 3 in integers, whereas time packet size ranges from 28 to 1098 bits. So Data normalization is done to make all the integer data lay in specific number range.
Consider = ( , , … . . ) as the data points, function f(x) will normalize the dataset using the following equation:
( ) =
− ( )
( )
where = Data point where 1 ≤ ≤ k, ( )= The average of all the data instances and ( ) = Sample deviation of all the data instances.
C. Feature Subset Selection using Evolutionary Optimization
It is used to reduce the number of features. The initial population is randomly chosen and feature subset selection is applied on it. The fitness value of each chromosome is calculated. We have used wrapper method for subset selection. The best set of features is retained and the least one is removed from the list which modifies the feature set. The crossover and mutation operators are applied till termination criteria is reached. The reduced feature set is then passed to GBT classifier.
D. Training GBT Classifier
GBT is an effective method for classification tasks. It combines classification and regression trees (CART) with gradient boosting. It is basically ensemble of weak prediction models such as decision trees. In this technique, a sequence of predictors (simple trees) is built iteratively where each successive tree is built for the prediction residuals of the preceding tree and final predictor is a weighted average of these predictors. At each step, we focus on adding an incremental classifier that improves the performance of the entire ensemble. Gradient boosting builds an ensemble of trees one-by-one, then the predictions of the individual trees are summed weighted by step size as below:
( ) = ( ) + ( ) + ( ) +⋯
The next decision tree tries to cover the discrepancy between the target function ( ) and the current ensemble prediction by
reconstructing the residual. Each learner estimates gradient loss and take sequence of steps to reduce residual.
( ) = ( )− ( )
485
©IJRASET (UGC Approved Journal): All Rights are ReservedFigure 1. Proposed Model
V. SIMULATION RESULTS AND DISCUSSION
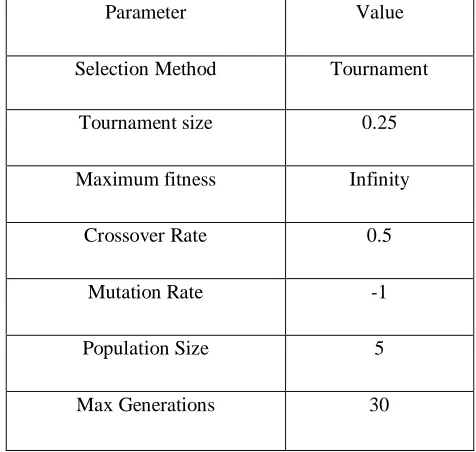
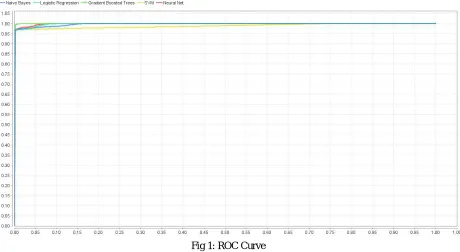
Table I shows the simulation parameters in NS-2 for creating data set. GBDT is used as a classifier and its parameters are given in Table II. The genetic algorithm has been implemented for feature sub-selection and parameters are shown in Table III. The final number of features left in the system after evolutionary optimization is 9 regular and 1 special. Receiver Operating Characteristic (ROC) curve for the proposed model and existing models on the testing dataset has been shown in Fig 3. The ROC curve is created by plotting the true positive rate against the false positive rate at various threshold settings. It is clear from the curve that GBT works well than other models.
Accuracy and other performance metrics
Yes Selected features
Feature Selection using Evolutionary Optimization Data Set Creation
Data Preprocessing
Data Splitting
Initial Population generation
Fitness value evaluation
Terminating Criteria?
GBT Classifier Selection
Crossover Mutation
No
Training Data set Testing Data set
486
©IJRASET (UGC Approved Journal): All Rights are ReservedTable I: Simulation Environment Parameters
Parameter Value
No of nodes 25
No of malicious nodes 2
Channel Type Wireless
Routing Protocol AODV
Maximum Packet Size 1000
Simulation Time 200
Antenna type Omni
Channel type Wireless
Network interface type Physical/ Wireless physical
Radio Propagation Model Two ray ground
Interface Queue Type Drop Tail
MAC Protocol IEEE 802.11
Table II: Parameters for GBT
Parameter Value
Number of trees 20
Maximum Depth 5
[image:6.612.158.453.90.342.2]Learning Rate 0.1
Table III: Parameters for Evolutionary Optimization
Parameter Value
Selection Method Tournament
Tournament size 0.25
Maximum fitness Infinity
Crossover Rate 0.5
Mutation Rate -1
Population Size 5
[image:6.612.186.424.477.703.2]487
©IJRASET (UGC Approved Journal): All Rights are ReservedFig 1: ROC Curve
[image:7.612.161.454.418.479.2]A confusion matrix obtained illustrates the accuracy of the solution to a classification problem. Given 2 classes, a confusion matrix is a 2 X 2 matrix, where C[i, j] indicates the number of tuples from dataset of class i that were assigned to class C[i, j] as shown in Table IV. The ideal solution will have only zero in non-diagonal entries. The performance metrics are calculated using the four parameters- True Positive (TP), True Negative (TN), False Positive (FP) and False Negative (FN).
Table IV. Confusion Matrix entries
Predicted value Negative Positive Actual
Value
Negative TN FP Positive FN TP
Where,
A. True positive (TP) for a particular class is the number of positive cases that were correctly identified.
B. False positive (FP) for a particular class is the number of negatives cases that were incorrectly classified as positive.
C. True negative (TN) for a particular class is the number of negatives cases that were classified correctly.
D. False negative (FN) for a particular class is the number of positives cases that were incorrectly classified as negative. The performance of proposed system is evaluated in terms of accuracy, precision and recall using the above parameters.
1) Accuracy is the proportion of the total number of predictions that were correct.
= ( + )
( + + + )
2) Specificity is the proportion of the predicted negative cases that were correctly identified.
= +
3) Sensitivity is the proportion of positive predicted samples that were correctly identified.
= +
4) Kappa is like classification accuracy but it is normalized at the baseline of random chance on the dataset.
488
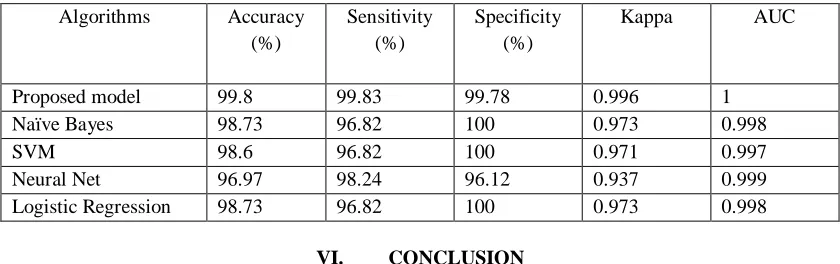
©IJRASET (UGC Approved Journal): All Rights are Reserved [image:8.612.96.516.140.272.2]The various performance metrics have been evaluated and compared with existing machine learning models. A comparative analysis of our proposed model with existing models has been shown in Table V. Our proposed shows better results especially in terms of accuracy, AUC and Kappa than existing models. The accuracy of our proposed model is 99.8% which is highest among all.
Table V: A comparison of different performance metrics of proposed model with existing models Algorithms Accuracy
(%)
Sensitivity (%)
Specificity (%)
Kappa AUC
Proposed model 99.8 99.83 99.78 0.996 1
Naïve Bayes 98.73 96.82 100 0.973 0.998
SVM 98.6 96.82 100 0.971 0.997
Neural Net 96.97 98.24 96.12 0.937 0.999
Logistic Regression 98.73 96.82 100 0.973 0.998
VI. CONCLUSION
Each node being an independent entity in VANETs can be easily jeopardized by an adversary. So security is a crucial issue. Cryptographic techniques can’t provide defense against unknown attacks so an Intrusion Detection system based on evolutionary optimized gradient boosted trees has been proposed to combat flooding attack in VANET. Our proposed model can detect multiple malicious nodes with higher accuracy (99.8%) in comparison to existing models. With evolutionary optimization, number of features is reduced to 9 making our model more efficient.
REFERENCES
[1] Mitchell, Tom M. "Artificial neural networks." Machine learning 45 (1997): 81-127.
[2] Peng, C.Y.J., Lee, K.L. and Ingersoll, G.M., 2002. An introduction to logistic regression analysis and reporting. The journal of educational research, 96(1),
pp.3-14
[3] Karnadi, F.K., Mo, Z.H. and Lan, K.C., 2007, March. Rapid generation of realistic mobility models for VANET. In Wireless communications and networking
conference, 2007. WCNC 2007. IEEE (pp. 2506-2511). IEEE
[4] Tsai, C.F., Hsu, Y.F., Lin, C.Y. and Lin, W.Y., 2009. Intrusion detection by machine learning: A review. Expert Systems with Applications, 36(10),
pp.11994-12000.
[5] Issariyakul, T. and Hossain, E., 2011. Introduction to network simulator NS2. Springer Science & Business Media
[6] Zeadally, S., Hunt, R., Chen, Y.S., Irwin, A. and Hassan, A., 2012. Vehicular ad hoc networks (VANETs): status, results, and challenges. Telecommunication
Systems, 50(4), pp.217-241
[7] Dhak A.Y., Yahya S. and Kassim M., "A Literature Survey on Security Challenges in VANETs," International Journal of Computer Theory and Engineering, vol. 4, no. 6, pp. 1007-1010, 2012
[8] H. Altwaijry, S. Algarny, "Bayesian based intrusion detection system," Journal of King Saud University – Computer and Information Sciences, vol. 24, no. 1, pp. 1-6, 2012
[9] Mukherjee, S. and Sharma, N., 2012. Intrusion detection using naive Bayes classifier with feature reduction. Procedia Technology, 4, pp.119-128
[10] Y. B. Bhavsar, K. C. Waghmare, "Intrusion Detection System Using Data Mining Technique: Support Vector Machine," International Journal of Emerging Technology and Advanced Engineering, vol. 3, no. 3, pp. 581-586, 2013
[11] Bhatia, T. and Verma, A.K., 2013. Security issues in MANET: a survey on attacks and defense mechanisms. International Journal of Advanced Research in
Computer Science and Software Engineering, 3(6), pp. 1382-1394
[12] Bhatia, T. and Verma, A.K., 2013. Performance Evaluation of AODV under Blackhole Attack. International Journal of Computer Network and Information
Security, 5(12), p.35.
[13] O. Al-Jarrah, A. Arafat, "Network Intrusion Detection System Using Neural Network Classification of Attack Behavior," Journal of Advances in Information Technology, vol. 6, no. 1, pp. 1-8, 2015.
[14] L. Hu, Z. Zhang, H. Tang, N. Xie, "An Improved Intrusion Detection Framework Based on Artificial Neural Networks," in 2015 11th International Conference on Natural Computation (ICNC), Zhangjiajie, 2015
[15] S. Chen, M. Peng, H. Xiong and X. Yu, X., 2016. SVM Intrusion Detection Model Based on Compressed Sampling. Journal of Electrical and Computer Engineering, pp. 1-6, 2016.
[16] K. Rai, M. S. Devi, and A. Guleria. "Decision Tree Based Algorithm for Intrusion Detection" International Journal of Advanced Networking and Applications, vol. 7, no. 4, pp. 2828-2834, 2016. \