R E S E A R C H
Open Access
A transcriptome-based global map of
signaling pathways in the ovarian cancer
microenvironment associated with clinical
outcome
Silke Reinartz
1†, Florian Finkernagel
2†, Till Adhikary
2, Verena Rohnalter
2, Tim Schumann
2, Yvonne Schober
3,
W. Andreas Nockher
3, Andrea Nist
4, Thorsten Stiewe
4, Julia M. Jansen
1, Uwe Wagner
1,
Sabine Müller-Brüsselbach
2and Rolf Müller
2*Abstract
Background:Soluble protein and lipid mediators play essential roles in the tumor environment, but their cellular origins, targets, and clinical relevance are only partially known. We have addressed this question for the most abundant cell types in human ovarian carcinoma ascites, namely tumor cells and tumor-associated macrophages.
Results:Transcriptome-derived datasets were adjusted for errors caused by contaminating cell types by an algorithm using expression data derived from pure cell types as references. These data were utilized to construct a network of autocrine and paracrine signaling pathways comprising 358 common and 58 patient-specific signaling mediators and their receptors. RNA sequencing based predictions were confirmed for several proteins and lipid mediators. Published expression microarray results for 1018 patients were used to establish clinical correlations for a number of components with distinct cellular origins and target cells. Clear associations with early relapse were found for STAT3-inducing cytokines, specific components of WNT and fibroblast growth factor signaling, ephrin and semaphorin axon guidance molecules, and TGFβ/BMP-triggered pathways. An association with early relapse was also observed for secretory macrophage-derived phospholipase PLA2G7, its product arachidonic acid (AA) and
signaling pathways controlled by the AA metabolites PGE2, PGI2, and LTB4. By contrast, the genes encoding norrin
and its receptor frizzled 4, both selectively expressed by cancer cells and previously not linked to tumor suppression, show a striking association with a favorable clinical course.
Conclusions:We have established a signaling network operating in the ovarian cancer microenvironment with previously unidentified pathways and have defined clinically relevant components within this network.
Keywords:Ovarian carcinoma, Tumor-associated macrophages, Tumor microenvironment, Malignancy-associated ascites, Signaling network, Arachidonic acid, IL-10, TGFβ
* Correspondence:[email protected]
Silke Reinartz and Florian Finkernagel are Joint first authors †Equal contributors
2
Institute of Molecular Biology and Tumor Research (IMT), Center for Tumor Biology and Immunology (ZTI), Philipps University, Hans-Meerwein-Str. 3, Marburg 35043, Germany
Full list of author information is available at the end of the article
Background
Ovarian carcinoma ranks fifth as the cause of death from cancer in women with >40,000 new cases annually in the European Union [1]. Ovarian cancer has a dire prognosis with an overall five-year survival rate of <25 %. The World Health Organization classification distinguishes six major entities of ovarian tumor [1]. Of these, high grade serous ovarian carcinoma is not only the most common ovarian cancer, but also the deadliest of all gynecological malignancies. Up to 95 % of these patients with advanced stage disease present with tumor masses in the abdomen beyond the pelvis and/or lymph node metastases (FIGO stage III) or organs outside the peri-toneal cavity (stage IV). These facts clearly attest to the malicious nature of this disease and identify serous ovar-ian cancer as a major health issue world-wide.
Several features contribute to the fatal nature of serous ovarian carcinoma, some of which make this cancer unique among all human tumors [2]. Tumor cells are often shed at a very early stage of the disease. Even at a stage when primary tumors are still confined to one or both of the ovaries, cancer cells can be detected in peri-toneal lavage fluid (stage IC). While blood and the lymphatic system are major routes of dissemenation in other cancers, the spread of ovarian tumor cells is driven by the peritoneal fluid. Ovarian cancer cells then adhere to and superficially invade the omentum and the serous membranes lining other peritoneal organs, giving rise to tumor foci growing into the open space of the peritoneal cavity [2]. The peritoneal microenvironment, which is formed by the ascites building up in the peritoneal cavity, is an essential determinant of metastatic disease progres-sion due to its tumor-promoting soluble factors [3], exo-somes [4], highly tumorigenic cancer cells [5], and different types of immune cells, including pro-tumorigenic tumor-associated macrophages (TAMs) [6, 7].
TAMs are blood monocyte-derived cells polarized by factors of the tumor microenvironment to adopt pheno-types that clearly deviate from classically or alterna-tively activated macrophages [8–10]. This also applies to TAMs isolated from ovarian cancer ascites [7]. TAMs are pro-tumorigenic and promote all aspects of cancer growth and progression, including tumor cell proliferation, invasion, angiogenesis, formation of me-tastasis, and immune suppression [8, 9, 11, 12]. The critical role of TAMs has been demonstrated in numer-ous mnumer-ouse models and is strongly supported by the correlation of clinical outcome with intratumoral macrophage density in different types of cancer [11], in-cluding ovarian carcinoma [13]. Consistent with these observations, the presence of CD163highTAMs in the malignancy-associated ascites showed a strong correl-ation with early relapse of serous ovarian carcinoma after first-line therapy [7].
Cytokines and growth factors released into the tumor microenvironment are pivotal to all aspects of tumor progression. Tumor growth, cancer dissemination, and immune escape are promoted by a plethora of growth factors and cytokines that are also found in ovarian cancer ascites [7, 14–16]. These factors (1) induce cell prolifera-tion, such as epidermal growth factor (EGF) family mem-bers and interleukin (IL)-6, (2) trigger angiogenesis, e.g. vascular EGF (VEGF), basic FGF, and IL-8, (3) attract im-mune cells to the tumor, in particular chemokines of the CCL and CXCL families [17], and (4) polarize these to pro-tumorigenic and immune suppressive cells, for example VEGF, IL-6, IL-10, and LIF [18]. One of the central factors promoting tumor progression is transforming growth fac-tor (TGF) β [19], which triggers epithelial-mesenchymal transition (EMT), cancer cell invasion, metastasis, and im-mune suppression. Soluble factors may also play a role in promoting stemness properties, for example, KIT ligand and R-spondins as ligands for CD117 [20] and LGR5 [21, 22], respectively. Several growth factors and cytokines also inhibit apoptosis and the efficacy of chemotherapeutic drugs, such as IL-6, IL-10, and TGFβ[23]. Finally, ascites fluid promotes its own accumulation, mainly though the action of VEGF as a vascular permeability factor [24].
A recent study evaluating publicly available genomic data has identified a number of clinical associations of signaling loops established by polypeptide ligands and their receptors in advanced ovarian cancer, including TGFβ, PDGF, VEGF, ephrin, CXCL12, and CCL chemo-kines [25]. However, since all expression data were derived from solid tumor tissue, tumor and host cell-specific con-tributions could not be analyzed, which also suggests that pathways involving host cells as major constituent were missed.
Molecules generated by the cleavage of phospholipids and present in malignant effusions represent another im-portant class of soluble cancer-promoting mediators, in particular lysophosphatitic acid (LPA) [26–31] and ara-chidonic acid (AA)-derived eicosanoids [32–34]. The lat-ter include prostanoids, hydroxyeicosatetraenoic acids (HETEs), and leukotrienes that are produced from AA by enzymatic cascades initiated either by cyclooxy-genases or lipoxycyclooxy-genases. The importance of lipid medi-ators for tumorigenesis is exemplified by LPA as a mediator of cancer cell invasion and chemoresistance [28, 31, 35] and prostaglandin E2as an immune suppres-sor and trigger of angiogenesis [36].
cancer patients have been published [37–39], these are not suitable to determine expression levels in tumor cells and specific tumor-associated host cells. We have addressed this issue by determining the transcriptomes for the major cell types of serous ovarian carcinoma, i.e. tumor cells and TAMs, purified from the ascites of pa-tients. Ascites-associated cancer cells occur as single cells or multicellular spheroids and are likely to be re-sponsible for peritoneal dissemination and to contribute to relapse of the disease [2]. In spite of their clinical rele-vance, genome-wide studies have not been performed with ascites-associated cells from ovarian cancer.
In the present study, we determined the transcriptome for tumor cells and TAMs from ovarian cancer ascites and used these data to construct a network comprising cyto-kines, growth factors, lipid mediators, and their receptors, which we confirmed for several components at the level of the respective proteins or lipids. These data defined a multitude of specific signaling pathways between tumor cells and TAMs as well as cell-type restricted, autocrine mechanisms. Furthermore, by establishing correlations with disease progression, we provide clear evidence for the biological relevance of soluble mediators in the ovar-ian cancer microenvironment. Thus, our data identified a highly significant link to disease recurrence not only for several cytokines and AA, but also a striking synergistic association between these proteins and AA. These find-ings underscore the biological relevance of functional in-teractions in the ovarian cancer microenvironment.
Results
Characterization of patient samples
Tumor cells and/or TAMs were isolated from the ascites of 28 patients with high grade serous ovarian carcinoma and one patient with serous borderline tumor (low grade carcinoma) (Additional file 4: Table S1). If feasible, tumor cell spheroids from the same patients were frac-tionated according to size (single cells: “sc”; small: <30
μm, “s”; medium: 30–40 μm, “m”; large: >40 μm, “L”). Surprisingly, small and large spheroids from the same patients frequently showed clear genetic and biological differences (Additional file 4: Table S2). For instance, small spheroids usually comprised pseudo-diploid cells, rapidly adhered to culture dishes in the presence of au-tologous ascites and were chemosensitive, whereas large spheroids were largely aneuploid, persisted as floating spheres in culture and were completely chemoresistant. Therefore, both small and large spheroids were included in all subsequent studies and analyzed separately.
Adjustment of RNA sequencing data for contaminating cell types
A central goal of the present study was an RNA sequen-cing (RNA-Seq) based comparison of the expression of
signaling components of tumor cells and TAMs. We fo-cused our study on primary, non-cultured cells in order to obtain a faithful picture of the signaling network op-erating in vivo. However, the presence of variable amounts (0–50 %) of TAMs in isolated tumor cell frac-tions and vice versa may lead to incorrect conclusions in particular for genes that show a differential, cell type-specific expression. The impact of such“contaminations” on gene expression profiles is a well-known problem and has consequently been addressed by numerous pub-lished algorithms [40–50]. However, none of these fulfills all the criteria required by our specific conditions, as ex-plained in detail in Additional file 1.
A particularly relevant aspect in this context is the mixed-polarization phenotype of ovarian cancer ascites-associated TAMs, which share only small subsets of upregulated genes with M1 and M2 macrophages (Additional file 2: Figure S1). This precludes the use of literature data obtained with canonically activated macrophages as, for example, in CIBERSORT [48]. Likewise, the transcriptome of tumor cells from ovarian cancer ascites has not been determined yet. Therefore, ap-propriate reference data for ascites-derived tumor cells and TAMs were not available prior the present study. Fi-nally, most published algorithms generate estimates of the fraction of contaminating cell types, but do not adjust the TPM values in RNA-Seq datasets.
To establish a bioinformatic tool to adjust our data-sets, we used a simple but highly effective approach. First, pure reference samples representing the cell type of interest (“target”) and the contaminating cell type are selected, the purity of which was confirmed by flow cytometry or other methods. RNA-Seq data for these references samples are then used to select a set of con-tamination marker genes, suitable for estimating the extent of contamination. Finally, the target dataset is ad-justed by a linear model. A detailed description of our algorithms is found in Additional file 1. For testing our method we simulated mixtures from published RNA-Seq datasets, which showed a clear improvement, as exem-plified in Fig. 1a for mixtures of purified immune cells (RNA-Seq data from GSE60424 [51]) or different tissues (Additional file 1). Furthermore, none of the previ-ously described algorithms matched this performance (Additional file 1).
contaminated TAM samples (TAM66s: 49.4 % tumor cells and TAM70: 24.9 %; striped bars in Fig. 1c). These three samples were excluded from all subsequent experiments.
These data were used to adjust the RNA-Seq data for cross-contaminating tumor cells, TAMs, and TATs. Ad-justment was successful, as exemplified in Fig. 1d and e for tumor cells. While the macrophage marker gene
CD163 was reduced, the epithelial cell marker gene
PAX8was not. The observed increase inPAX8is due to the fact that TPM values represent a relative measure, thus resulting in a redistribution from reduced to non-reduced genes.
These adjusted RNA-Seq data for 20 tumor cell and 16 TAM samples (Additional file 3: Dataset S1) were an-alyzed for expression of two classes of mediators and their receptors: (1) cytokines and polypeptide growth factors, collectively referred to as protein mediators in the following; and (2) phospholipid breakdown products and eicosanoids functioning as lipid mediators, as de-scribed in detail below.
Common expression of protein mediators and their receptors by tumor cells and TAMs
We first established datasets of 791 genes encoding pro-tein mediators and their receptors based on literature and database-derived data, in total 502 cytokine and growth factor genes (Additional file 3: Dataset S2) and 289 receptor genes (Additional file 3: Dataset S4). Genes with TPM values≥3 in at least 65 % of all tumor cell or TAM samples were considered expressed and part of a common signaling network. Using these criteria, we iden-tified 159 cytokine and 173 receptor genes to be expressed in tumor cells and/or TAMs (Fig. 2a, b; Additional file 3: Dataset S4 and S5). Genes were defined as cell type-selective if expression levels between tumor cells and TAMs differed at least threefold (thresholds indicated by the shaded areas in Fig. 2) and the individual TPM values determined for one cell type were either larger or smaller than the values for the other cell type, allowing maximum
Fig. 1Adjustment RNA-Seq data based on RNA-Seq mixture modeling.
[image:4.595.58.291.83.647.2]one outlier (Additional file 3: Datasets S4, S5: column“no overlap”). These datasets were further split into groups showing low (green bars in Fig. 2a, b), median (blue), or high (red) expression levels according to the observed TPM values.
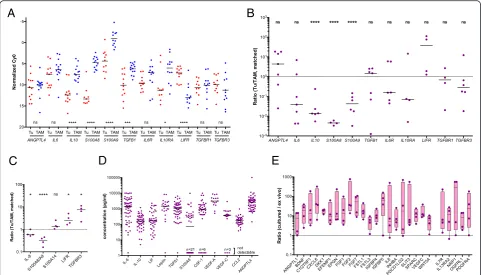
Differences of more than 1000-fold were observed with respect to the expression levels of different genes as well as the cell type selectivity of individual genes. These results were confirmed by RT-qPCR using a larger num-ber of patient-derived samples for all instances tested, including a statistically highly significant preferential ex-pression of IL10,TGFB1, S100A8, S100A9, and IL10RA by TAMs andLIFRby tumor cells (Fig. 3a). The analysis of matched tumor cell and TAM samples from the same patients are in agreement with these conclusions with the exception ofTGFB1(Fig. 3b).
We next determined the levels of protein expression for several examples by flow cytometry of non-separated ascites samples and confirmed the preferential expres-sion of S100A8/A9 and IL-8 in TAMs, and of LIFR and TGFBR3 in tumor cells (Fig. 3c and Additional file 2: Figure S2). Finally, we measured the levels of a number of protein mediators in the ascites of up to 40 serous ovarian cancer patients (Additional file 4: Table S3) and found readily detectable levels for all mediators shown in Fig. 3d, whereas IL4, IL12, IL13, and GM-CSF were not detectable, consistent with the RNA-Seq and RT-qPCR data (Fig. 2a and 3a). However, in a few cases, as-cites levels were unexpectedly high in view of the low expression of the corresponding mRNAs in tumor cells and TAMs, e.g. IL-6 and VEGF-C (Fig. 2; Additional file 3: Datasets S3 and S5). We therefore investigated
[image:5.595.59.540.87.487.2]whether this apparent discrepancy could be due to dif-ferences in expression levels in unattached tumor cells in suspension, as in spheroids, and in attached tumor cells. To address this question, we performed RNA-Seq analyses for four matched pairs of uncultured and cul-tured spheroids. The latter were kept in serum-free medium supplemented with autologous ascites for 6 days, under which conditions the cells partly adhere to the plas-tic surface. The results clearly show that a small number of cytokine genes were indeed induced under these con-ditions, includingIL6andVEGFC(Fig. 3e), while other ones, such asIL10andLIFwere not. It is therefore pos-sible that adherent tumor cells and solid tumor masses rather than floating cells are the major source of some of the ascites-associated protein mediators.
Delineation of a common signaling network of protein mediators established by tumor cells and TAMs
Based on these data, we derived a model of a signaling network involving ovarian cancer cells and TAMs (Fig. 4). The predicted cellular origins and targets of
cytokines and growth factors are also summarized in Additional file 2: Figure S3. In the following sections, we will describe the most prominent signaling pathways identified by our analyses.
(i) The STAT3-inducing cytokines IL-10, IL-6, and LIF were identified as part of the signaling network established in the present study (Fig.4a).IL10and the gene encoding its receptorIL10Rwere expressed mainly by TAMs,LIFandLIFRby tumor cells,IL6 and the genes for IL6 receptor subunitsIL6Rand IL6STby both cell types.
(ii)TGFB1, mainly expressed by TAMs, codes for the major ligands of the TGFβnetwork, which also comprises tumor cell-derivedTGFB2andBMP7 (encoding bone morphogenetic protein 7) as well as BMP1expressed by both cell types (Fig.4b). These ligands target both cell types, as suggested by the expression patterns of theTGFBRandBMPR2genes. (iii)WNT7Ais the most strongly expressed WNT gene
preferentially expressed by tumor cells (Fig.4c).
A
B
C
D
E
[image:6.595.57.539.88.363.2]Other ligands of the network includeWNT2B, WNT5A, andWNT9A, differentially expressed by tumor cells and TAMs. These ligands include inducers of both canonical and non-canonical WNT signaling [52]. The canonical pathway depends on both frizzled receptors (FZD) and LRP coreceptors, whereas non-canonical signaling does not require LRPs. As multiple LRP genes are expressed by tumor cells and TAMs (Fig.4c), canonical WNT signaling would be functional in both cell types.
(iv) MultipleS100genes are highly expressed in tumor cells and/or TAMs, includingS100A8andS100A9 (Fig.4d). S100A8 and S100A9 proteins interact with
surface receptors either as monomers with advanced glycation end products receptor RAGE (AGER) and TLR4 or bind as heterodimers to different scavenger receptors [53], all of which are expressed by TAMs (MSR1,SCARA/B, CD36). Taken together with the particular high expression of both genes in TAMs, these findings point to a pivotal role for TAMs in generating and processing S100A8/A9-associated signals, which also applies to S100A12. Tumor cells express scavenger receptor genes, but notAGERand TLR4at significant levels, suggesting that these cells are primarily targeted by S100A8/A9 heterodimers. On the other hand, tumor cells but not TAMs
A C
B E
D F
H
G
I
[image:7.595.56.543.88.489.2]express ERB2, encoding a receptor for S100A4, suggesting a tumor-selective effect. In contrast, multiple S100 members of varying cellular origins seem to target preferentially TAMs, as suggested by the lack of RAGE expression by tumor cells.
(v)Both tumor cells and TAMs express multiple semaphorins and their receptors (plexins and neuropilins), thereby establishing autocrine as well as paracrine signaling mechanisms (Fig.4e). While SEMA3F,5A,6A, and6Dexpression is clearly higher in tumor cells, the opposite is true forSEMA 4Aand6B. The semaphorin receptor genes
PLXNA1,PLXNA3,NRP1, andNRP2are expressed by both cell types, whereasPLXNB1andPLXND1 expression is selective for tumor cells and TAMs, respectively.
(vi) Ephrins are also part of the signaling network, with tumor cells playing a major role (Fig.4f). Thus, tumor cells are the main origin of six different ephrin family members, compared to one subtype expressed by TAMs. Likewise, A-type receptor ex-pression is
restricted to tumor cells and B-type receptor expression is considerably higher in, or selective for, tumor cells, the latter exemplified byEPHB3andEPHB4. (vii)TAMs play a major role both as producers and
targets of multiple chemokines of theCCLfamily (Figs.2aand4g). Thus, TAMs preferentially express multipleCCLgenes, withCCL2,CCL3, andCCL4 being the most strongly expressed ones. Moreover, significant expression of receptor genes for these cytokines (CCR1,CCR2,CCR5) was detected only in TAMs. In contrast, severalCXCLtype chemokine genes are expressed by both cell types, however, significant expression of genes coding for their cognate receptor genes was only detectable for CXCR4in both cell types, consistent with its description as an independent predictor of a poor clinical outcome of ovarian cancer [54].
(viii)Our study also predict a number of other pathways known to play important roles in tumor progression (Figs.2and4h, i). These include: (1) stimulation of the MET receptor on tumor cells by TAM-produced HGF; (2) the interaction of amphiregulin (AREG) produced by both cell types with ERB2, 3, and 4 re-ceptors on tumor cells; (3) the activation of NOTCH receptors on both cell types by JAG1/2
ligands, mainly produced by tumor cells; (4) PDGF signaling by all different family members via PDGFR-A on both cell types; (5) IGF1/2 signaling particularly through IGFR2; and (6) the interaction of angiopoietin-like 4 (ANGPTL4) with integrinβ1 (ITGB1).
Expression of signaling components in tumor cells from subsets of patients
A number of genes encoding protein mediators were uniformly expressed by tumor cells and/or TAMs (e.g.
IL8, KITLG, LEP), but median expression of the corre-sponding receptor genes was extremely low in both cell types (Figs. 2 and 4; Additional file 3: Datasets S2–S5). Likewise, several receptor genes (e.g.IL4R,INFAR/INFGR,
PTCH/SMO) were consistently expressed by tumor cells and/or TAMs, but ligand expression was not detectable. This may be due to the expression of the“missing”ligands and receptors by other host-derived cells or by tumor cell subsets not present in ascites. On the other hand, some of these genes may not be part of the common network due to a restricted expression in smaller subsets of patients. Such genes may be of particular interest, since their ex-pression could be related to the aggressiveness of the dis-ease and thus to its clinical outcome.
We therefore searched for genes not found in the common network but potentially complementing this in a small subfraction of patients. These genes had to fulfill two conditions: (1) TPM >3 in n ≥2 tumor cell or TAM samples (but below the 65 % quantile used in Fig. 2); and (2) coding for proteins representing ligands or re-ceptors for the pathways constructed in Fig. 4. Genes identified by this approach in tumor cells (n = 35; Table 1) and TAMs (n = 14; Additional file 4: Table S4) may indeed be of high relevance, as they code for com-ponents of chemokine, TGFβ/BMP, FGF, ephrin, sema-phoring, and WNT pathways. We also found the gene coding for norrin (NDP), a frizzled 4 ligand unrelated to the WNT family [55], to be expressed in tumor cells from a subset of patients (Table 1).
Identification of a common transcriptome-based signaling network of lipid mediators between tumor cells and TAMs
Table 1Patient-specific expression of cytokine and receptor genes by tumor cells complementing the signaling networks constructed in Figs. 4 and 6
Gene Description Min. TPM Max. TPM
Cytokines
BMP8B Bone morphogenetic protein 8b 0.32 32.17
CXCL6 Chemokine (C-X-C motif) ligand 6 0.00 7.74
CXCL14 Chemokine (C-X-C motif) ligand 14 0.00 5.74
DKK1 Dickkopf WNT signaling pathway inhibitor 1 0.00 7.49
EFNA3 Ephrin-A3 0.95 16.74
EGF Epidermal growth factor 0.09 10.16
FGF2 Fibroblast growth factor 2 (basic) 0.02 29.35
FGF9 Fibroblast growth factor 9 0.08 15.31
FGF11 Fibroblast growth factor 11 0.48 6.17
FGF13 Fibroblast growth factor 13 0.08 9.04
FGFBP1 Fibroblast growth factor binding protein 1 0.00 28.97
KITLG KIT ligand 0.04 7.48
NDP Norrin (Norrie disease pseudoglioma) 0.00 5.44
NRG1 Neuregulin 1 0.02 5.23
NRG2 Neuregulin 2 0.04 4.59
NRG3 Neuregulin 3 0.00 13.39
PDGFD Platelet derived growth factor D 0.29 6.58
RSPO3 R-spondin 3 0.02 8.90
S100A7 S100 calcium binding protein A7 0.00 4.03
S100P S100 calcium binding protein P 0.00 12.00
SEMA3D Semaphorin 3D 0.00 6.07
SEMA3E Semaphorin 3E 0.13 93.32
SEMA4G Semaphorin 4G 0.16 6.74
SEMA5B Semaphorin 5B 0.03 19.94
SEMA6C Semaphorin 6C 0.68 4.76
SEMA7A Semaphorin 7A 0.26 9.55
SFRP1 Secreted frizzled-related protein 1 0.00 527.58
TGFB3 Transforming growth factor, beta 3 0.07 4.51
Cytokine receptors
AGER Advanced glycosylation end product receptor 0.30 5.01
EPHA6 EPH receptor A6 0.13 25.52
FGFR4 Fibroblast growth factor receptor 4 0.33 3.76
FZD2 Frizzled family receptor 2 0.22 6.18
FZD10 Frizzled family receptor 10 0.00 7.95
IL10RA Interleukin 10 receptor, alpha 0.00 5.91
Lipid mediators
ALOX15B Arachidonate 15-lipoxygenase, type B 0.06 8.03
Lipid receptors
LTB4R2 Leukotriene B4 receptor 2 1.11 3.78
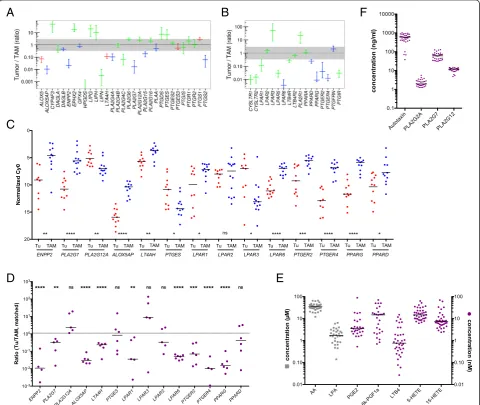
The RNA-Seq data summarized in Fig. 5a and Additional file 3: Datasets S7 and S9 identified 31 genes involved in the enzymatic generation of lipid mediators and expressed in ovarian cancer cells and/or TAMs. Figure 5b shows the data for expression of the corresponding receptor genes (n = 17). A number of key observations were confirmed by RT-qPCR analysis of a larger number of clinical samples (Fig. 5c, d).
We also investigated whether genes expressed at higher levels in tumor cells or TAMs only from a small subfrac-tion (n≥2) of patients participate might also participate in
lipid-mediated signaling pathways. This analysis identified three genes expressed in tumor cells, i.e. ALOX15B, the leukotriene B4receptor geneLTB4R2and the PGE2 recep-tor genePTGER3(Table 1).
These findings point to a network of lipid mediators established by both tumor cells and TAMs, involving several distinct groups of signaling molecules, as described below.
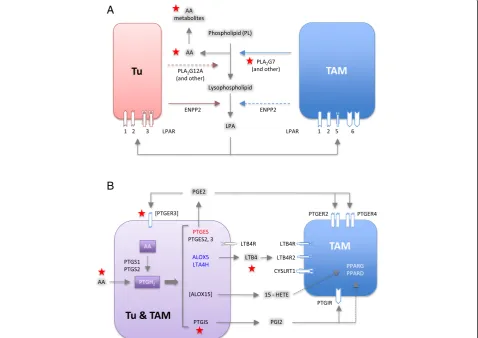
(i) The first network is based on products of phospholipid hydrolysis that are generated by
A
C
D
E
B
F
[image:10.595.58.539.236.641.2]specific phospholipases (Figs.5and6a). This conclusion is consistent with the presence of high levels of LPA, AA, specific A2-type phospholipases (in particular PLA2G7), and autotaxin in ascites
(Fig.5f). TAMs seem to play an essential role in this context, since they expressPLA2G7andENPP2at higher levels than tumor cells (Fig.5a, c). Importantly, the protein levels of 3 phospolipases (PLA2G2,
PLA2G7, and PLA2G12A) measured in ascites fluid
(Fig.5f) are consistent with mRNA expression levels in tumor cells and TAMs (Fig.5a; Additional file3: Dataset S6). LPA in ascites apparently targets tumor cells and TAMs via specific receptors, sinceLPAR1 andLPAR2are expressed at similar levels by both cell types,LPAR3is selective for tumor cells,LPAR5 andLPAR6for TAMs (Fig.5b–d). AA is taken up by tumor and host cells [56], where it can regulate
signaling pathways, either directly or after metabolic conversion.
(ii)The second network is established by prostanoids (Fig.6b), in particular prostanglandin E2(PGE2) and
PGI2(prostacyclin), both found at substantial levels
in ascites (Fig.5e; 6k-PGF1a is the stable degradation product of PGI2), as previously described [56]. Most
genes encoding the enzymes required for their synthesis (cyclooxygenases and prostaglandin synthases) are expressed at similar levels by both cells types (PTGS1,PTGES2/3,PTGIS; Fig.5a, c, d), whereasPTGS2is selective for TAMs. A major target of their products seem to be TAMs, which express considerable higher levels of the PGE2and
PGI2receptor genesPTGER2,PTGER4, andPTGIR
(Fig.5b, c) with the exception ofPTGER3expressed only by a small subset of tumor cells (Table1). In
A
B
[image:11.595.60.539.311.649.2]addition, TAMs also show a higher expression of PPARD(Fig.5b–d), encoding the nuclear receptor PPARβ/δ, a possible target for PGI2[57]. Figure6b
shows a schematic representation of these results. (iii) Products of the lipoxygenase pathway, i.e. 5-HETE,
15-HETE and leukotriene A4(LTA4) represent the
third network (Fig.6b). These AA metabolites are present in ascites at readily detectable concentrations (Fig.5e; LTB4is a stable metabolite of the unstable
LTA4). This is consistent with the expression of the
corresponding lipoxygenase (ALOX5), 5-lipoxygenase activating protein (ALOX5AP), and leukotriene synthase (LTA4H) genes (Fig.5a, c) in TAMs. In contrast, TAMs also preferentially express the LTB4
surface receptor genesLTB4R,LTB4R2, and CYSLRT1/2. 15-HETE has been described as a ligand for the nuclear receptors PPARγ[58] and PPARβ/δ[59], which are both expressed at higher levels in TAMs (Fig.5b–d). The gene coding for the presumptive 5-HETE receptorOXER1[60] is expressed at very low levels in both cell types, if at all (Additional file3: Dataset S8), suggesting that 5-HETE is more likely to act as a precursor of LTA4
in these cells.
Association of mediator concentrations with clinical outcome
We next asked whether mediators in the tumor micro-environment are associated with the clinical outcome of high-grade serous ovarian carcinoma. We therefore assessed potential associations of the ascites levels of cy-tokines and lipids prior to first-line therapy with RFS by Kaplan–Meier analysis (see Additional file 4: Table S3 for patient-specific clinical features). The logrank p values depicted in Fig. 7a demonstrate a clear association of the STAT3-inducing cytokines IL-10, IL-6, and LIF with early relapse (Fig. 7a–c), with IL-10 being the strongest indicator of a poor outcome (p<0.0001; logrank hazard ra-tio [HR] = 4.54; 95 % confidence interval [CI] = 4.56–40.5; median survival 12.0 versus 26.0 months), which is in agreement with a previous study of a smaller cohort of patients [7]. The present study identified inverse associ-ations with RFS for four additional mediators, i.e. TGFβ1, PLA2G7, AA, and its metabolite LTB4(Fig. 7a, d–g). In contrast, PLA2G12A, autotaxin, and the PLA2/ autotaxin product LPA did not show any correlation (Fig. 7a). Likewise, the AA metabolites PGE2, PGI2, 5-HETE, and 15-5-HETE, also components of the lipid sig-naling network identified above, were not linked to RFS. The relevance of these cytokines and AA as indicators of an adverse clinical outcome became particularly evi-dent when we determined the RFS for combinations of these mediators. Thus, patients with a high level of ei-ther IL-10 and AA, IL-6 and AA, or TGFβ and AA
showed a clearly worse outcome compared to those with a high concentration for only one mediator (red versus gray curves in Fig. 8a–c; p= 0.016 for IL-10; p <0.0001 for IL-6; p= 0.0002 for TGFβ). For IL-10, a similar dif-ference was observed between patients showing a high concentration for either IL-10 or AA versus those with low levels of both mediators (Fig. 8a;p= 0.0045). A simi-lar analysis for the other two cytokines was not possible due to an insufficient number of cases in the“both low” group. A striking association was observed when patients were compared with high IL-10 and high AA levels to those with low concentrations of both mediators (Fig. 8a;
p <0.0001; logrank HR = 9.50; 95 % CI = 4.38–47.3; me-dian survival 12.0 versus >34 months).
Pearson analysis revealed low correlation coefficients (r) when cytokine levels were compared to lipid concentra-tions (Fig. 8d), indicating that the observed clinical associa-tions are not simply a consequence of their co-synthesis. Likewise, the concentrations of AA did not correlate with any of the AA metabolites tested. In contrast, IL-6 and LIF levels were highly correlated (R = 0.87), pointing to com-mon regulatory pathways.
Association of gene expression levels with clinical outcome
Finally, we sought to establish clinical correlations with components of the common signaling network estab-lished above (Fig. 4). Toward this end, we made use of published microarray results for 1018 high-grade serous ovarian cancer patients with documented RFS [38]. The samples used for these analyses were derived from solid tumor masses and therefore contained variable amounts of host-derived cells, including TAMs, as confirmed by the large range of expression values observed for macro-phage marker genes across this cohort. Kaplan–Meier analysis for these genes actually showed a clear association of RFS with the expression of these genes (Additional file 2: Figure S4), presumably reflecting the known ad-verse effect of TAM infiltration on the clinical outcome. In addition, this scenario means that genes not primarily expressed in tumor cells cannot be faithfully analyzed, since it is not possible to separate effects of gene expres-sion from host cell “contamination” in the sample and the algorithm developed in the present study for RNA-Seq cannot be applied to microarrays.
We therefore decided to focus our survival analysis on genes expressed at a higher level in tumor cells relative to TAMs (i.e. more than twofold in Fig. 2). We identified multiple mediator and receptor genes that are clearly (p<0.01) associated with a shorter RFS (red in Fig. 9a, b), consistent with their established or suspected functions in tumor progression. These include the cytokine genes
well asNPR1and3(Fig. 9a, b). We also found a surpris-ing association of a favorable clinical outcome with WNT receptor frizzled 4 (FZD4) gene expression (Fig. 9a). We performed an analogous survival analysis for genes associated with lipid signaling and expressed at higher levels by tumor cells relative to TAMs (right-most genes in Fig. 9a, b), based on the data in Fig. 5a and b. A particularly strong association with an adverse clinical outcome was observed for PTGIS (p= 0.0005), which codes for prostaglandin I2(prostacyclin) synthase (Fig. 6b).
Finally, we performed Kaplan–Meier analyses (Fig. 9d–g) of genes expressed only in small subgroups of our patients (Table 1). A very strong adverse effect on RFS (p= 0.0001) was seen withTGFB3(Fig. 9c, d), in line with the cen-tral role of the associated signaling pathways in cancer, and with PTGER3 (Fig. 9c, e; p <0.0001), encoding a prostaglandin E2receptor (Fig. 6b). Strong associations with poor RFS (p<0.001) were also seen with PDGFD and SEMA6C. However, the most intriguing finding was the identification ofNDPas a powerful indicator of a favorable clinical course (p <0.0001; Fig. 9c, f ). NDP
A
B
C
E
F
D
G
Fig. 7Association of RFS with the levels of cytokines and lipid mediators in ovarian carcinoma ascites.aSummary of RFS analyses showing the
pvalues determined by Mantel-Cox log rank test. Patients were dichotomized into high and low expressing groups according to the following quantiles (best-fit) and number or patients: IL-10, Q = 0.66 (n = 36); IL-6, Q = 0.5 (n = 39); TGFβ1, Q = 0.25 (n = 39); AA, Q = 0.25 (n = 38); LTB4,
Q = 0.25 (n = 38); PLA2G7, Q = 0.33 (n = 33). Significant instances with a HR >1 are shown inred;grey barsindicate lack of significant associations.
[image:13.595.57.540.87.510.2]codes for norrin, which interacts with the receptor frizzled 4 [55, 61] and TSPAN12, a signal-amplifying component of the norrin–frizzled 4 complex [55]. This presumably explains the strong association of FZD4 with RFS (p= 0.0004; Fig. 9g) described above. Further-more,TSPAN12 was also inversely associated with RFS (p= 0.0343; Fig. 9h). Taken together, these findings provide strong evidence for novel tumor suppressor function of norrin–frizzled 4–TSPAN12 signaling in ovarian cancer. Discussion
We have defined a tumor cell and macrophage-driven signaling network operating within the environment of ovarian cancer-associated carcinomatosis involving inter-leukins, chemokines, members of the TGFβ, WNT, S100, semaphorin and ephrin families, the phospholipid breakdown products LPA, and AA as well as AA metab-olites. This network is composed of mostly common, but also patient-specific mediators and receptors and in-cludes pathways previously not identified in the context of ovarian cancer or intercellular signaling in the tumor microenvironment (Figs. 4 and 6). We will discuss these pathways in the following sections, in particular with re-spect to their association with disease progression after first-line therapy.
STAT3-inducing cytokines
In agreement with the established function of deregu-lated STAT3 in ovarian cancer [62], IL-10, IL-6, and LIF were confirmed as components of the signaling network established by tumor cells and TAMs (Figs. 3–5). Their cellular origins and target cells clearly support a pivotal role for TAMs within this network, since these cells are the main producers of IL-10, a major source of IL-6 and the predominant target of IL-10, which presumably plays an important role in their protumorigenic conversion. Expression of LIF and its receptor are higher in tumor cells, pointing to a function for this cytokine beyond its proposed function in TAM polarization [18]. The pathways triggered by these cytokines are also directly relevant to progression of the disease as shown by the in-verse association of their ascites levels (Fig. 7) with RFS, consistent with previous studies [7, 63, 64]. Taken to-gether, these data clearly confirm a critical role for cytokine-mediated STAT3 deregulation in ovarian cancer by exerting pro-tumorigenic effects on both tumor cells and macrophages and its potential as a drug target [65].
TGFβfamily
Multiple TGFβfamily members have previously been as-sociated with ovarian cancer [19, 25, 66]. In agreement
A
B
C
D
[image:14.595.57.538.88.369.2]with this established knowledge, we identified several components of this signaling system as important con-stituents of the ovarian cancer microenvironment, with both tumor cells and TAMs as essential contributors (Fig. 4b). This conclusion is strongly supported by the observed clinical correlations. Thus, the ascites concen-tration of TGFβ1, mainly produced by TAMs, was asso-ciated with early relapse (Fig. 7). A similar adverse link was observed between RFS and the expression ofTGFB2 and TGFB3 genes by tumor cells, with the latter repre-senting one of the strongest indicators of a poor clinical outcome (Fig. 9c, d). These observations are fully com-patible with the known functions of TGFβ ligands in tumor progression [67] and immune suppression [68], as well as the adverse effect of TGFBR2 and phosphory-lated SMAD2/3 on survival [66]. Previous studies have also associated BMP2 and BMP4 with ovarian cancer, both of which are expressed at extremely low levels in tumor cells and TAMs (Additional file 3: Dataset S2), which may be explained by the previous identification of
ovarian cancer-associated mesenchymal stem cells as a major source of these cytokines [69].
Frizzled-mediated signaling
WNT signaling is another major signaling mechanism identified in the present study (Fig. 4c). Seven genes en-coding inducers of canonical and/or non-canonical WNT signaling [52], most of which were found to be preferentially expressed by tumor cells. Non-canonical WNT signaling is induced by WNT interaction with FZD without involvement of LRP coreceptors and trig-gers a calcineurin-NFAT pathway. The expression of at least seven FZD genes strongly suggests that the non-canonical pathway is operational. The non-canonical pathway depends on both FZD and LRP proteins and stimulates
β-catenin signaling. Nine LRP genes are expressed by tumor cells and/or TAMs (Fig. 4c), suggesting that the canonical pathway is functional in both cell types and utilizes cell type-specific receptors. Importantly, we found a strong inverse association ofWNT11expression
A
D
E
B
C
F
G
H
Fig. 9Association of RFS with the expression of genes coding cytokines, growth factors, and lipid mediators or their receptors. Panels (a)–(c) represent summaries of RFS analyses for 1018 serous ovarian carcinoma patients depicting the results of logrank P tests and the directions of the respective hazard ratio (HR), using the KM plotter database [38].a,bSurvival analysis for genes in Fig. 2 with an expression ratio (tumor cell/TAM) >0.3. Genes missing from the microarray datasets used by KM Plotter were not included in panels (a)–(c). Significant instances (for“JetSet best probe”) are shown inred(HR >1) orgreen(HR <1);gray barsindicate lack of significant associations (p≥0.5) orp> Benjamini-Hochberg critical value for FDR = 0.10. Significance was determines as in Fig. 8.cSurvival analysis as before, but for genes expressed only in small subgroups of patients (see Table 1 and Additional file 3: Dataset S1 ).d–hKaplan–Meier plots analyzing the RFS of patients with high or low levels ofTGFB3,
[image:15.595.58.543.87.394.2]with RFS (Fig. 9a), and also confirmed the previously de-scribed [70] correlation of WNT7A expression with a poor clinical outcome (Fig. 9a).
R-spondins (RSPO) and their receptor LGR5 are re-quired for optimal canonical WNT signaling [22], but expression was insignificant in all samples (LGR5; Add-itional file 3: Dataset S3) or was found in tumor cells from a subset of patients only (RSPO genes; Table 1). Since LGR5 has been identified as a stem-cell specific gene in ovarian epithelial cells in mice [21], this pathway may be restricted to tumor cells with stem-like proper-ties, although the role of LGR5 in human ovarian epithe-lial cells is unclear.
We also found tumor cell selective expression of the
NDP,FZD4, andTSPAN12genes (Fig. 4c, f, g), encoding norrin, its receptor frizzled 4, and a norrin signal-amplifying component of the receptor complex, respect-ively [55], which were linked to colon cancer angiogen-esis in a recent study [61]. Intriguingly, we identified
NDP, FZD4, and TSPAN12 to be associated with a de-layed tumor progression, thus pointing to a novel tumor suppressor function of this signaling pathway in ovarian cancer. This finding is puzzling, since norrin shares with canonical WNT ligands the ability to induce β-catenin, generally considered a pro-tumorigenic pathway. In view of the currently very limited knowledge on norrin-mediated signaling, the mechanism underlying a putative function in tumor suppression remains elusive and may involve hitherto unidentified signal transduction events.
S100 family
S100 proteins play essential roles in tumor growth and progression, chemoresistance, and immune modulation [53]. Several S100 members are secreted or otherwise re-leased in the extracellular space and interact with sur-face receptors, including the advanced glycation end products receptor RAGE (AGER), scavenger receptors (MSR1,SCARA/Bgene products,CD36), EGF family re-ceptors and toll-like receptor 4 (TLR4), and stimulate multiple signaling transduction pathways, including NFκB and MAP kinases [53]. Our data show that several
S100 genes, i.e.S100A4,S100A6, S100A10, S100A8, and
S100A9, are expressed at very high levels in both tumor cells and TAMs (Fig. 4d). Furthermore, multiple recep-tors interacting with different S100 proteins or S100A8/ A9 heterodimers are expressed by both tumor cells and TAMs (SCARA/B, CD36), preferentially by TAMs (AGER,MSR1, TLR4) or by tumor cells (ERBB2), point-ing to extensive functional interactions between both cell types. Surprisingly, none of the S100 genes showed an association with early relapse (Fig. 9b), which is in line with the lack of literature data supporting a role for S100 proteins in the clinical progression of ovarian cancer.
Semaphorins and ephrins
Semaphorins and ephrins, originally identified as axon guidance molecules, also have essential physiological functions during organ development, angiogenesis, and immune regulation [71–73]. More recently, their in-volvement in cancer cell migration, invasion, and metas-tasis has been uncovered, but is currently only partially understood. Activation of plexins by semaphorins results in the transactivation of oncogenic receptor tyrosine ki-nases, including MET, ERBB2, and KDR [73, 74]. Indi-vidual family members can be associated with either stimulatory or inhibitory effects on tumorigenesis and angiogenesis. For instance, a potential role in suppres-sion of malignant melanoma has been described for
PLXNB1[75], while cooperation with ERBB2 and a pro-metastatic role was reported for breast cancer cells [76]. We have identified multiple genes encoding components of both semaphorin and ephrin signaling in both tumor cells and TAMs, i.e. 13 semaphorins and at least six cog-nate receptors, as well as six ephrin members and seven receptors. These findings point to a complex signaling network established by tumor cells and TAMs (Fig. 4e), involving both autocrine and paracrine signaling mecha-nisms, as well as cell type-selective expression of ligands and receptors. Five of these genes,SEMA3C,3 F,5A,6A and in particular 6C, are associated with early relapse (Fig. 9a and c). Likewise, four ephrin receptor genes (EPHA1, EPHA4, EPHB2, EPHB4) showed an adverse clinical association (Fig. 9b). Our findings therefore strongly support a tumor-promoting role for axon guid-ance ligands and their receptor in ovarian cguid-ancer. As these are expressed by tumor cells as well as TAMs, it is likely that both cell types play a role in this context.
Chemokines
Phospholipid breakdown products
Tumor cell and TAMs express multiple genes for se-creted phospholipases, with PLA2G7, preferentially expressed by TAMs, as the major subtype (Fig. 5a). Intri-guingly, PLA2G7 ascites levels are associated with a short RFS (Fig. 7a, e), indicating a clinical relevance for the phospholipid breakdown products. These include LPA, generated from lysophospholipids by autotaxin, and PUFAs. Our survival analyses did not show any sig-nificant correlation of LPA or autotaxin levels in ascites with the clinical outcome (Fig. 7a). However, the former result must be considered with some caution, since LPA represents a mixture of several compounds with differ-ent fatty acids in the sn1 position. It has been shown that different LPA species can exert different biological effects, which may be obscured when these are collectively quantified. Furthermore, according to the manufacturer, the antibody used for this analysis (ELISA) recognizes the minor forms (e.g. linolenic 18:3 LPA) with a higher affinity compared to the more common LPA species (e.g. oleic 18:1 LPA). The relevance of LPA as a potential indicator of early ovarian cancer relapse has therefore to be re-evaluated in future studies using methods that are able to discriminate different LPA species.
On the other hand, a clear inverse association with RFS was observed for AA (Figs. 4, 7a, f ). The clinical relevance of AA is strongly supported by our finding that the adverse effect of cytokines, like IL-6, IL-10, and TGFβ were enhanced by the simultaneous presence of high AA levels, pointing to a hitherto unknown cooper-ation in causing therapy failure and disease progression. Importantly, AA concentrations did not show any sig-nificant correlation with IL-6, IL-10, or TGFβ(Fig. 8d), excluding the possibility that the observed clinical corre-lations are due to a common mechanism regulating the synthesis of these mediators.
Arachidonic acid metabolites
AA is metabolized to a number of highly bioactive eicos-anoid derivatives, in particular cyclooxygenase-derived prostanoids and lipoxygenase-derived HETEs and leuko-trienes. In ovarian cancer, several components of these pathways are present in ascites, and the required en-zymes are expressed by both tumor cells and TAMs (Fig. 6b). These mediators seem to act primarily on TAMs, including PGE2, PGI2, and 15-HETE, as judged by the expression of their cognate receptors. An excep-tion was LTB4with receptors on both cell types. A clin-ical relevance of these mediators is suggested by the observed inverse associations of RFS with the ascites levels of LTB4(Figs. 4, 7a, g) and the expression of the
PTGISandPTGER3genes (Figs. 4, 9b, e), encoding PGI2 synthase and a PGE2 receptor, respectively (Fig. 6b). These findings could, at least in part, explain the adverse
effect of AA on survival, i.e. by serving as a precursor of pro-tumorigenic metabolites.
It can, however, not be excluded that non-metabolized AA contributes to this effect. We have recently shown that PPARβ/δ, which is expressed preferentially in TAMs (Fig. 2b), is deregulated by PUFA ligands in ovarian can-cer ascites [56]. It is, however, very unlikely that PPARβ/
δmediates the adverse effect of AA on RFS, because the major ascites-associated PUFA with strong agonistic ef-fect on PPARβ/δ is linoleic acid [56], which, in turn, is not linked to survival at all (Fig. 7a). Even though other targets for non-metabolized AA have been identified [79–82], AA-triggered signaling is poorly understood, making it difficult to speculate on the molecular mech-anism underlying the clinical effect discovered in the present study.
Conclusions
In spite of the clearly documented pivotal role of the tumor microenvironment in tumor growth, progression, and immune escape, the reciprocal interactions of tumor and host cells through soluble mediators are only par-tially understood. In the present study we have estab-lished a global RNA-Seq based strategy to address this problem using tumor cells and TAMs from ovarian car-cinoma ascites. As a first step, we developed an algo-rithm to adjust sequencing data for the presence of contaminating cells in the samples analyzed, i.e. macro-phages in tumor cell fractions or vice versa. After optimization on training datasets the algorithm was suc-cessfully applied to the ovarian cancer samples used in the present study, indicating that the method should be generally applicable to tackle the problem of contamin-ating cells in RNA-Seq samples.
Third, it is unknown how ascites-associated tumor and host cells differ from their counterparts in solid tumor masses. Purification of cells from metastases of the same patients could be used to address this question, and also to analyze the contribution of host-derived cell types re-stricted to solid tumor tissue.
Methods
Patient samples
Ascites was collected from patients with high grade ser-ous ovarian carcinoma undergoing primary surgery at the University Hospital in Marburg. Written informed consent for the use of ascites for research purposes and publication of the results obtained from this research was obtained from all patients prior to surgery according to the protocols approved by the ethics committee of Marburg University (Az 205/10). Patient characteristics are presented in Additional file 4: Tables S1 and S3. Clinical courses were evaluated by RECIST criteria [83] in patients with measurable disease or profiles of serum CA125 levels [84], according to the recommendations by the Gynecologic Cancer InterGroup (GCIG). Only patients with observations periods ≥12 months after first-line sur-gery were included in the survival analysis. All experimental methods comply with the Helsinki Declaration.
Isolation of TAMs from ovarian cancer ascites
Mononuclear cells were isolated from ascites by Lympho-cyte Separation Medium 1077 (PromoCell) density gradi-ent cgradi-entrifugation and further purified by magnetic cell sorting (MACS) using CD14 microbeads (Miltenyi Bio-tech). TAMs were directly analyzed by FACS as described below or lysed in PeqGold (Peqlab) for RNA preparation.
Tumor cell/spheroid isolation from ascites
Mononuclear cells were isolated from ascites by Lympho-cyte Separation Medium 1077 (PromoCell) density gradient centrifugation. Tumor spheroids were separated by filtra-tion using 30 μm and 40μm cell strainer (Miltenyi Bio-tech) resulting in either spheroids of medium size (30–40
μm =“m”) or large size (>40 μm =“L”). Small tumor spheroids (<30μm =“s”) and tumor single cells (sc) were further purified by depletion of peritoneal leucocytes using CD45 microbeads and magnetic cell sorting (MACS) (Mil-tenyi Biotech). Purified tumor cells were lysed in PeqGold (Peqlab) for RNA preparation, analyzed by flow cytometry, or cultured for testing of chemoresistance. The purity of tumor spheroids/cells was >90 % EpCAM+ cells, except for sample OC84s (>85 %, Additional file 4: Table S2).
Characterization of tumor cells/spheroids by flow cytometry
Prior to FACS staining, tumor spheroids were dissoci-ated into single cells by trypsination for 10 min at 37 °C,
followed by vortexing for 10 s. To analyze cell cycle dis-tribution, tumor single cells were fixed in 70 % ice-cold ethanol, washed with PBS + 2 % FCS, and treated with 100 μL RNAse (1 mg/mL) at 37 °C for 20 min. Cells were stained with 10 μL propidium iodide (1 mg/mL) for 30 min. FACS analysis was performed on a FACS Canto II instrument using Diva Software (BD Biosci-ences). Proliferation was analyzed by FACS after staining tumor single cells with anti-Ki67 PEVio770, anti-CD45 FITC, and anti-EpCAM PE antibodies (all Miltenyi Biotech).
Flow cytometry analysis of ascites-associated cells
Gene expression profiles generated from RNA-Seq data-sets were verified in TAMs and tumor cells by FACS analysis. Mononuclear cells from patients’ ascites were simultaneously stained with Vioblue-labeled anti-human EpCAM (Miltenyi Biotech) as tumor marker and FITC-labeled CD14 (Miltenyi Biotech), PE-FITC-labeled anti-CD163 (eBioscience), or APC-labeled anti-CD206 (Biozol) as TAM marker. In addition, FITC-labeled anti-TGFbeta RIII and PE-labeled anti-LIF-R (all R&D Systems) were used for surface staining. Intracellular staining of perme-abilized cells was performed with APC-labeled anti-IL-8 (eBioscience), FITC-labeled anti-S100A8/A9 (Life Tech-nologies) and FITC-labeled anti-S100A14 (antibodies-online) as described previously [7]. Isotype control antibodies were purchased from BD Biosciences, Mil-tenyi Biotech, and eBioscience. Cells were analyzed by flow cytometry and results were calculated as percent-age of positive cells and mean fluorescence intensities (MFI).
In vitro testing of chemoresistance
Tumor spheroids or single cells from patients were cultured in M199 media (Life Technologies) plus 10 % autologous, cell-free ascites with or without 10 μM car-boplatin (Sigma Aldrich) and 10 nM paclitaxel (Adipo-Gen) at 37 °C, 5 % CO2 (approximately 2.5–5 × 10⁵ cells/mL). After 6 days, the 3-[4,5-dimethylthiazol-2-yl]-2,5-diphenyl tetrazoliumbromid (MTT) assay was per-formed to assess cell viability as described previously [85]. The percentage of chemoresistant tumor cells in the carboplatin/paclitaxel treated culture was calculated relative to cells treated with solvent control (DMSO).
Analysis of soluble mediators in cell-free ascites
from RayBiotech and LPA by ELISA kit from Echelon. The phospholipase A2, Group XIIA (PLA2G12A) ELISA Kit was from antibodies-online, the PLA2G2A ELISA kit from Biozol, and the ENPP-2/Autotaxin, CSF-1, S100A8, and PLA2G7 ELISAs from R&D Systems.
Quantification of lipids by liquid chromatography -tandem mass spectrometry (LC-MS/MS)
Ascites samples (1 mL) were spiked with 100μL deuter-ated internal standard and extracted using solid reverse phase extraction columns (Strata-X 33, Phenomenex). Fatty acids derivatives were eluted into 1.0 mL of metha-nol, lyophilized, and resuspended in 100 mL of water/ acetonitrile/formic acid (70:30:0.02, v/v/v; solvent A) and analyzed by LC-MS/MS on an Agilent 1290 separation system. Samples were separated on a Synergi reverse-phase C18 column (2.1 × 250 mm; Phenomenex) using a gradient as follows: flow rate = 0.3μL/min, 1 min (aceto-nitrile/isopropyl alcohol, 50:50, v/v; solvent B), 3 min (25 % solvent B), 11 min (45 % solvent B), 13 min (60 % solvent B), 18 min (75 % solvent B), 18.5 min (90 % solv-ent B), 20 min (90 % solvsolv-ent B), 21 min (0 % solvsolv-ent). The separation system was coupled to an electrospray interface of a QTrap 5500 mass spectrometer (AB Sciex). Compounds were detected in scheduled multiple reaction monitoring mode. For quantification a 12-point calibration curve for each analyte was used. Data analysis was performed using Analyst (v1.6.1) and MultiQuant (v2.1.1) (AB Sciex).
RT-qPCR and RNA-Seq
cDNA isolation and qPCR analyses were performed as described [86], using L27 for normalization and evalu-ated by the Cy0 method [87]. Primer sequences are listed in Additional file 4: Table S5. RNA-Seq was carried out on an Illumina HiSeq 1500 as described [85]. Sum-marized read counts are shown in Additional file 3: Dataset S1. Genome assembly and gene model data were retrieved from Ensembl revision 74.
Sequencing data availability
Sequencing data were deposited at EBI ArrayExpress (accession numbers E-MTAB-3167 and E-MTAB-4162).
Bioinformatic analysis of RNA-Seq data
RNA-Seq data were aligned to Ensembl v74 using STAR (version STAR_2.4.1a) [88]. Gene read counts were established as read count within merged exons of pro-tein coding transcripts (for genes with a propro-tein gene product) or within merged exons of all transcripts (for non-coding genes). TPM (transcripts per million) were calculated based on the total gene read counts and length of merged exons. Genes were considered expressed if they had a minimum TPM of 3. All genomic
sequence and gene annotation data were retrieved from Ensembl release 74, genome assembly hg19. Our full analysis scripts and computational pipeline are available upon request.
Adjustment of RNA-Seq data for contaminating cells
The development and testing of our algorithm, including benchmarking against other published algorithms, are described in detail in Additional files 1 and 5.
Simulations for Fig. 1a were performed 12,000 times on data retrieved from GSE60424 [51]. The dataset con-sists of highly purified immune cells from patients with various autoimmune diseases. Samples annotated“whole blood” and sample lib264 were excluded, as the latter showed monocyte contamination. Mixtures were calcu-lated by resampling the larger sample to the size of the smaller one and mixing at a chosen percentage. Refer-ence expressions were calculated from all non-mixed samples of the respective tissues. Contamination estima-tion and correcestima-tion was performed as described in detail in Additional file 1.
OC66s, TAM72, and TAT31 were used as reference samples for pure tumor cell, TAM, and TAT popula-tions, respectively (see Fig. 1b, c). The automated pro-cedure selected the following marker genes for adjusting tumor cell datasets:
TAM marker genes:AIF1,C1QB,C1QC,CCR1,CD36, CMKLR1,CR1,FCGR2A,FCGR3B,FPR3,ITGAM, MARCO,MPEG1,MRC1L1,STAB1,TLR4,VCAN. TAT marker genes:ATP2A3,C16orf54,CCR4,CCR7, CD2,CD247,CD3E,CD96,GZMK,IL2RB,IL2RG, KCNA3,LEF1,NKG7,PRF1,RHOH,ZNF831.
For adjusting TAM datasets the following marker genes were selected:
Tumor cell marker genes:ASS1,CDH1,CLDN4, CT45A1,CT45A3,CT45A4,CT45A5,DSP,EPCAM, ESRP1,IGFBP3,KRT7,LRP6,MEIS1,PRAME,SLPI, VTCN1.
TAT marker genes:ATP2A3,CAMK4,CCR4,CD8A, CD8B,CST7,KCNA3,KLF12,LCK,LIME1,MT1X, NKG7,PRF1,RHOH,RLTPR,TCF7,TGFBR3.
The source code for implementing our algorithm and the simulations described in the present study are in-cluded as Additional file 6 and deposited at GitHib (https://github.com/IMTMarburg/rnaseqmixture) and Zonodo (doi:10.5281/zenodo.48872).
Statistical analysis of experimental data
Comparative data were statistically analyzed by Student’s
Prism 6.0. Results were expressed as follows: *p <0.05; **p<0.01; ***p<0.001; ****p<0.0001. CIs were calculated using the bootstrap method.
Survival-associated gene expression analysis
Associations between gene expression and relapse-free survival of ovarian cancer patients were analyzed using the web based tool“KM Plotter”[38] (http://kmplot.com) with the following settings:“auto select best cutoff,”probe set option:“JetSet best probe,” histology: serous, datasets: all; other settings: default). The 2015 version of KM Plotter used contains the following 13 datasets: GSE14764 (n = 80), GSE15622 (n = 36), GSE18520 (n = 63), GSE19829 (n = 28), GSE23554 (n = 28), GSE26193 (n = 107), GSE26712 (n = 195), GSE27651 (n = 49), GSE30161 (n = 58), GSE3149 (n = 116), GSE51373 (n = 28), GSE9891 (n = 285), TCGA (n = 565). The GraphPad Prism software was used to analyze associations of soluble mediator concentrations in ascites fluid with RFS (Kaplan-Meier plots, logrank p values, logrank HR, and median survival times). Multiple hypothesis testing was accounted for out by controlling the FDR using the Benjamini-Hochberg method.
Additional files
Additional file 1:Description and optimization of the algorithm and benchmarking against published methods. (PDF 5117 kb)
Additional file 2:Supplementary Figures S1–S4. (PDF 946 kb)
Additional file 3:Datasets S1–S7. (XLS 26437 kb)
Additional file 4:Supplementary Table S1–S5. (XLS 48 kb)
Additional file 5:Source code. (TXT 9 kb)
Additional file 6:Assembly of gene sets. (PDF 200 kb)
Abbreviations
AA:arachidonic acid; ChIP: chromatin immunoprecipitation; CI: confidence interval; ELISA: enzyme-linked immunosorbent assay; FDR: false discovery rate; HR: hazard ratio; LPA: lysophosphatitic acid; LC-MS/MS: liquid chromatography - tandem mass spectrometry; LT: leukotriene; MAE: mean absolute error; PG: prostaglandin; PUFA: polyunsaturated fatty acid; RNA-Seq: RNA sequencing; RFS: relapse-free survival; TAM: tumor-associated macrophage; TAT: tumor-associated lymphocyte; TPM: transcripts per million.
Acknowledgements
We are grateful to Dr. Marco Memberger for useful discussions of bioinformatic analyses, to N. Dinesh and R. Yerabolu for help with RT-qPCR experiments, and to T. Plaum, A. Allmeroth, and M. Alt for expert technical assistance. This work was supported by grants from the Wilhelm Sander-Stiftung (2011.082.2) to SM-B, SR, and UW and from UKGM to SR, TA, VR, and UW.
Authors’contributions
SR prepared and characterized all tumor cell and TAM samples and performed the FACS and ELISA-based analyses; FF performed bioinformatics analysis; VR and TSch carried out RNA isolation and RT-qPCR analyses; TA constructed RNA-Seq libraries and performed quality control experiments; YS and WAN carried out LC-MS/MS analyses; AN and TSt established NGS methodologies and acquired the RNA-Seq data; JMJ and UW provided clinical samples and analyzed clinical data; SR, SMB, and RM conceived the study, oversaw the project, and wrote the paper. All authors read and approved the final manuscript.
Competing interests
The authors declare that they have no competing interests.
Author details
1Clinic for Gynecology, Gynecological Oncology and Gynecological Endocrinology, Center for Tumor Biology and Immunology (ZTI), Philipps University, Marburg, Germany.2Institute of Molecular Biology and Tumor Research (IMT), Center for Tumor Biology and Immunology (ZTI), Philipps University, Hans-Meerwein-Str. 3, Marburg 35043, Germany.3Metabolomics Core Facility and Institute of Laboratory Medicine and Pathobiochemistry, Center for Tumor Biology and Immunology (ZTI), Philipps University, Marburg, Germany.4Genomics Core Facility, Center for Tumor Biology and Immunology (ZTI), Philipps University, Marburg, Germany.
Received: 17 December 2015 Accepted: 15 April 2016
References
1. Colombo N, Peiretti M, Parma G, Lapresa M, Mancari R, Carinelli S, Sessa C, Castiglione M, Group EGW. Newly diagnosed and relapsed epithelial ovarian carcinoma: ESMO Clinical Practice Guidelines for diagnosis, treatment and follow-up. Ann Oncol. 2010;21 Suppl 5:v23–30.
2. Lengyel E. Ovarian cancer development and metastasis. Am J Pathol. 2010;177:1053–64.
3. Kulbe H, Chakravarty P, Leinster DA, Charles KA, Kwong J, Thompson RG, Coward JI, Schioppa T, Robinson SC, Gallagher WM, et al. A dynamic inflammatory cytokine network in the human ovarian cancer microenvironment. Cancer Res. 2012;72:66–75.
4. Peng P, Yan Y, Keng S. Exosomes in the ascites of ovarian cancer patients: origin and effects on anti-tumor immunity. Oncol Rep. 2011;25:749–62. 5. Latifi A, Luwor RB, Bilandzic M, Nazaretian S, Stenvers K, Pyman J, Zhu H,
Thompson EW, Quinn MA, Findlay JK, Ahmed N. Isolation and characterization of tumor cells from the ascites of ovarian cancer patients: molecular phenotype of chemoresistant ovarian tumors. PLoS One. 2012;7:e46858. 6. Takaishi K, Komohara Y, Tashiro H, Ohtake H, Nakagawa T, Katabuchi H,
Takeya M. Involvement of M2-polarized macrophages in the ascites from advanced epithelial ovarian carcinoma in tumor progression via Stat3 activation. Cancer Sci. 2010;101:2128–36.
7. Reinartz S, Schumann T, Finkernagel F, Wortmann A, Jansen JM, Meissner W, Krause M, Schworer AM, Wagner U, Muller-Brusselbach S, Muller R. Mixed-polarization phenotype of ascites-associated macrophages in human ovarian carcinoma: Correlation of CD163 expression, cytokine levels and early relapse. Int J Cancer. 2014;134:32–42.
8. Qian BZ, Pollard JW. Macrophage diversity enhances tumor progression and metastasis. Cell. 2010;141:39–51.
9. Gabrilovich DI, Ostrand-Rosenberg S, Bronte V. Coordinated regulation of myeloid cells by tumours. Nat Rev Immunol. 2012;12:253–68.
10. Sica A, Mantovani A. Macrophage plasticity and polarization: in vivo veritas. J Clin Invest. 2012;122:787–95.
11. Condeelis J, Pollard JW. Macrophages: obligate partners for tumor cell migration, invasion, and metastasis. Cell. 2006;124:263–6.
12. Sica A, Bronte V. Altered macrophage differentiation and immune dysfunction in tumor development. J Clin Invest. 2007;117:1155–66. 13. Kawamura K, Komohara Y, Takaishi K, Katabuchi H, Takeya M. Detection of
M2 macrophages and colony-stimulating factor 1 expression in serous and mucinous ovarian epithelial tumors. Pathol Int. 2009;59:300–5.
14. Mills GB, May C, Hill M, Campbell S, Shaw P, Marks A. Ascitic fluid from human ovarian cancer patients contains growth factors necessary for intraperitoneal growth of human ovarian adenocarcinoma cells. J Clin Invest. 1990;86:851–5.
15. Lane D, Matte I, Rancourt C, Piche A. Prognostic significance of IL-6 and IL-8 ascites levels in ovarian cancer patients. BMC Cancer. 2011;11:210. 16. Matte I, Lane D, Laplante C, Rancourt C, Piche A. Profiling of cytokines in
human epithelial ovarian cancer ascites. Am J Cancer Res. 2012;2:566–80. 17. Mishra P, Banerjee D, Ben-Baruch A. Chemokines at the crossroads of
tumor-fibroblast interactions that promote malignancy. J Leukoc Biol. 2011;89:31–9.
![Fig. 1 Adjustment RNA-Seq data based on RNA-Seq mixture modeling.a Simulation results from in-silico mixture of different purified immunecells with purified monocytes from dataset GSE60424 [51]](https://thumb-us.123doks.com/thumbv2/123dok_us/8603486.865372/4.595.58.291.83.647/adjustment-modeling-simulation-different-purified-immunecells-purified-monocytes.webp)