M E T H O D
Open Access
CHiCAGO: robust detection of DNA looping
interactions in Capture Hi-C data
Jonathan Cairns
1†, Paula Freire-Pritchett
1†, Steven W. Wingett
1,2, Csilla Várnai
1, Andrew Dimond
1, Vincent Plagnol
3,
Daniel Zerbino
4, Stefan Schoenfelder
1, Biola-Maria Javierre
1, Cameron Osborne
5, Peter Fraser
1and Mikhail Spivakov
1*Abstract
Capture Hi-C (CHi-C) is a method for profiling chromosomal interactions involving targeted regions of interest, such as gene promoters, globally and at high resolution. Signal detection in CHi-C data involves a number of statistical challenges that are not observed when using other Hi-C-like techniques. We present a background model and algorithms for normalisation and multiple testing that are specifically adapted to CHi-C experiments. We implement these procedures in CHiCAGO (http://regulatorygenomicsgroup.org/chicago), an open-source package for robust interaction detection in CHi-C. We validate CHiCAGO by showing that promoter-interacting regions detected with this method are enriched for regulatory features and disease-associated SNPs.
Keywords:Gene regulation, Nuclear organisation, Promoter-enhancer interactions, Capture Hi-C, Convolution background model,Pvalue weighting
Background
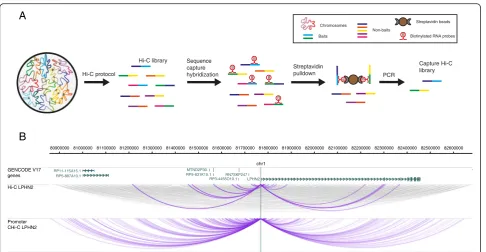
Chromosome conformation capture (3C) technology has revolutionised the analysis of nuclear organisation, lead-ing to important insights into gene regulation [1]. While the original 3C protocol tested interactions between a single pair of candidate regions (“one vs one”), subse-quent efforts focused on increasing the throughput of this technology (4C, “one vs all”; 5C, “many vs many”), culminating in the development of Hi-C, a method that interrogated the whole nuclear interactome (“all vs all”) [1, 2]. The extremely large number of possible pairwise interactions in Hi-C samples, however, imposes limita-tions on the realistically achievable sequencing depth at individual interactions, leading to reduced sensitivity. The recently developed Capture Hi-C (CHi-C) technol-ogy uses sequence capture to enrich Hi-C material for multiple genomic regions of interest (hereafter referred to as “baits”), making it possible to profile the global interaction profiles of many thousands of regions globally (“many vs all”) and at a high resolution (Fig. 1) [3–7].
CHi-C data possess statistical properties that set them apart from other 3C/4C/Hi-C-like methods. First, in contrast to traditional Hi-C or 5C, baits in CHi-C com-prise a subset of restriction fragments, while any frag-ment in the genome can be detected on the“other end” of an interaction. This asymmetry of CHi-C interaction matrices is not accounted for by the normalisation pro-cedures developed for traditional Hi-C and 5C [8–10]. Secondly, CHi-C baits, but not other ends, have a further source of bias associated with uneven capture efficiency. In addition, the need for detecting interactions globally and at a single-fragment resolution creates specific mul-tiple testing challenges that are less pronounced with binned Hi-C data or the more focused 4C and 5C assays, which involve fewer interaction tests. Finally, CHi-C designs such as Promoter CHi-C and HiCap [3–5, 11] involve large numbers (many thousands) of spatially dispersed baits. This presents the opportunity to in-crease the robustness of signal detection by sharing information across baits. Such sharing is impossible in the analysis of 4C data that focuses on only a sin-gle bait and is of limited use in 4C-seq containing a small number of baits [12–14].
These distinct features of CHi-C data have prompted us to develop a bespoke statistical model and a * Correspondence:[email protected]
†Equal contributors
1Nuclear Dynamics Programme, Babraham Institute, Cambridge, UK Full list of author information is available at the end of the article
background correction procedure for detecting signifi-cant interactions in CHi-C data at a single restriction fragment resolution. The algorithm, termed CHiCAGO (“Capture Hi-C Analysis of Genomic Organisation”), is presented here and implemented as an open-source R package. CHiCAGO features a novel background correction procedure and a two-component convolu-tion background model accounting for both real, but expected, interactions as well as assay and sequencing artefacts. In addition, CHiCAGO implements a weighted false discovery control procedure that builds on the theoretical foundations of Genovese et al. [15]. This procedure specifically accommodates the fact that increasingly larger numbers of tests are performed at regions where progressively smaller numbers of interac-tions are expected.
We demonstrate the efficacy of CHiCAGO on two datasets: one from the human lymphoblastoid cell line GM12878 [3] (see Fig. 2 for examples) and another from mouse embryonic stem cells (mESCs) [4]. We further show that CHiCAGO-detected interactions are enriched for regulatory regions and relevant disease-associated single-nucleotide polymorphisms (SNPs).
Results
Methodological foundations of CHiCAGO
A convolution background model for Hi-C data
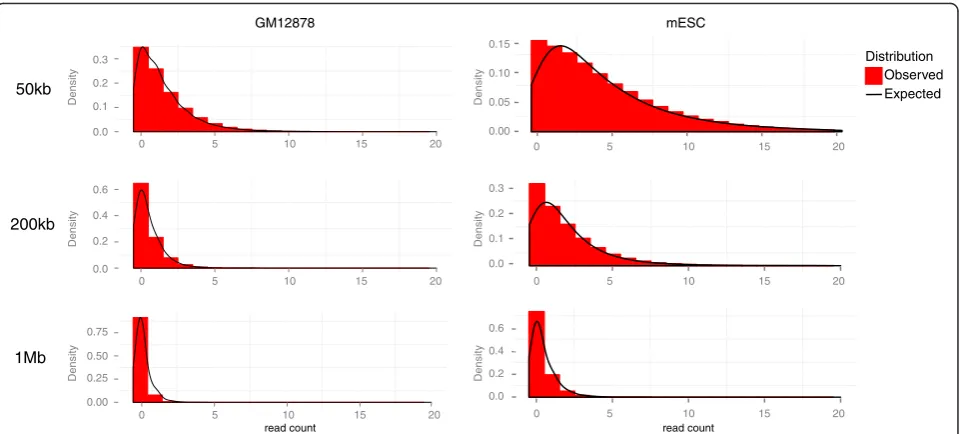
The background levels in CHi-C decrease as the genomic distance between the bait and other end increases (Fig. 3), as in other 3C/Hi-C-like methods [6–10, 12, 13, 16, 17]. It is generally accepted that this effect reflects the reduction in the frequency of random collisions between genomic fragments owing to constrained Brownian motion of chro-matin, in a manner consistent with molecular dynamics simulations [18]. We model the read counts arising from these“Brownian collisions”as a negative binomial random variable whose expected levels are a function of genomic distance, with further adjustment for bias resulting from the properties of individual fragments.
In addition to Brownian collisions, background in CHi-C is generated by assay artefacts, such as sequen-cing errors. We model this“technical noise”component as a Poisson random variable whose mean depends on the properties of interacting fragments but is independent of genomic distance between them.
We further assume that these two sources of back-ground counts are independent. Therefore, the combined 80900000 81000000 81100000 81200000 81300000 81400000 81500000 8160000081700000 81800000 81900000 82000000 82100000 8220000082300000 82400000 82500000 82600000
LPHN2
chr1 GENCODE V17
genes
Hi-C LPHN2
RP5-887A10.1
RP11-115A15.1 MTND2P30
RP5-831K15.1 RP3-4455O10.1
RN7SKP247
Hi-C protocol
Sequence capture hybridization
B B
B B
B
Streptavidin pulldown
B B PCR
Hi-C library Capture Hi-C
library
A
B
Chromosomes Baits
Non-baits
B Biotinylated RNA probes
Streptavidin beads
Promoter CHi-C LPHN2
Fig. 1The outline of Capture Hi-C.aOutline of the CHi-C protocol. A Hi-C library is hybridized to a capture system that consists of biotinylated
[image:2.595.57.544.85.337.2]background distribution can be obtained as a convolution of negative binomial (Brownian collisions) and Poisson (technical noise) distributions that is known as the Delaporte distribution.
We first construct this null distribution from the data in a robust way, based on all possible fragment pairs (in-cluding those that have zero observed read counts). We then find the pairs with counts that greatly exceed the expected background level (Fig. 2; as described in the next section). The full mathematical specification of the algorithm is given in Additional file 1.
Background estimation in asymmetrical interaction matrices A practical advantage of the two-component background model is that the Brownian and technical normalisation factors can be estimated on separate subsets of data, each of which predominantly represents only one back-ground component.
The dependence of background levels on the distance between fragments is particularly apparent at relatively short genomic distances (up to ~1–2 Mb), where the read counts considerably exceed those observed at longer ranges and for trans-chromosomal interactions. Thus,
A
B
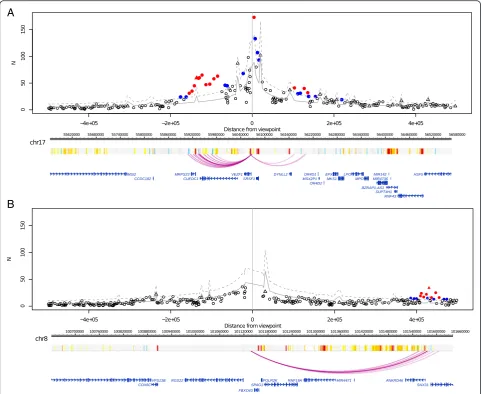
Fig. 2Examples of interactions called by CHiCAGO.Top panels: plots showing the read counts from bait-other end pairs within 500 kb (upstream
and downstream) of two baits, containing the promoters ofaVEZF1andbRGS22in GM12878 cells. Significant interactions detected by CHiCAGO (score≥5) are shown inred, and sub-threshold interactions (3≤score < 5) are shown inblue. Trianglesindicate bait-to-bait interactions.Grey lines
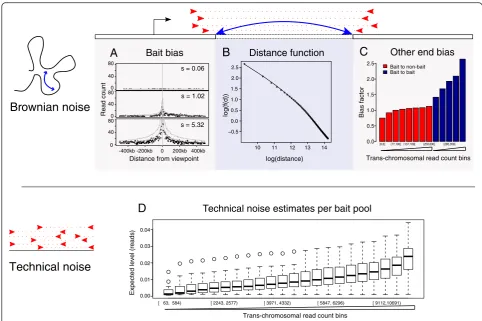
[image:3.595.57.540.88.482.2]within this range, counts arising from Brownian collisions largely dominate over technical noise and, hence, the Brownian component can be estimated while ignoring the technical noise. By borrowing information across all inter-actions in this distance range, we can infer Brownian com-ponent parameters precisely (Fig. 4; Additional file 2: Figure S1). We follow Imakaev et al. [8] in assuming that fragment-level biases have a multiplicative effect on the expected read counts for each fragment pair. However, we estimate “bait-specific” and “other end-specific” bias factors differently, accounting for the asymmetry of CHi-C interaction matrices.
The bait-specific factors reflect the technical biases of both Hi-C and sequence capture, as well as local effects such as chromatin accessibility. We estimate these factors in a way that is robust to the presence of a small fraction of interactions in the data. Figure 4a provides examples of three baits with very diverse bias factors, illustrating that local read enrichment correlates with the bias factor.
Estimating other end-specific bias factors poses a chal-lenge, as the majority of interactions are removed at the capture stage that enriches for only a small subset of inter-actions with baits. We assume that the overall fragment-level read count corresponding to trans-chromosomal pairs primarily reflects the general “noisiness” of a frag-ment (a similar approach has been taken independently in Dryden et al. [6]). While we do not preclude the presence of individual trans-chromosomal interaction signals, our reasoning that the overall per-fragment levels of trans -chromosomal pairs are dominated by noise is supported by evidence from Hi-C and random ligation control data
(Additional file 2: Figure S2). We therefore pool fragments according to this property and estimate bias factors for each pool. As expected, bias factors are higher for fragments associated with higher numbers of trans -chromosomal read pairs (Fig. 4c). Similarly, baits de-tected at the “other ends” of bait-to-bait pairs had higher background levels than non-baits, as expected given the preferential recovery of“double-baited”ligation products at the capture stage.
In parallel, we compute the dependence between the Brownian background component and linear chromo-somal distance (plotted in Fig. 4b for GM12878 CHi-C data). It can be seen that this dependence approximately follows a piecewise power law, consistent with previous studies on the subject, both theoretical and experimental [18, 19]. We further show by cross-validation that the estimate of this dependence is stable (Additional file 2: Figure S3) and, therefore, unlikely to be influenced by bait-specific or interaction-specific signals.
To estimate the magnitude of technical noise, we again use the per-fragment totaltrans-chromosomal read pairs (see“Methods”). In doing so, we assume that the contri-bution of true signals from specific trans-chromosomal looping interactions, as well as from Brownian collisions between chromosomes to the total trans-chromosomal counts, is negligible for the reasons outlined above (Additional file 2: Figure S2). Indeed, as we see in Fig. 4d, the expected level of technical noise is typically a small fraction of a count.
The estimated parameters of both background compo-nents are then combined into the Delaporte distribution.
Distribution
Expected Observed
50kb
200kb
1Mb
read count
0.00 0.05 0.10 0.15
0.0 0.1 0.2 0.3
0.0 0.2 0.4 0.6
Density
Density
Density
0.0 0.1 0.2 0.3
0.0 0.2 0.4 0.6
0.00 0.25 0.50 0.75
read count
Density
Density
Density
0 5 10 15 20
0 5 10 15 20
0 5 10 15 20 0 5 10 15 20
0 5 10 15 20
0 5 10 15 20
GM12878 mESC
Fig. 3Read count distributions in typical CHi-C experiments and fit to the CHiCAGO background model. Histograms showing read count distributions
[image:4.595.59.540.87.304.2]In Additional file 2: Figure S4 we show evidence that CHiCAGO’s parameter estimation procedures are robust in the presence of undersampling; the implications of undersampling in CHi-C data are further examined in the “Discussion”. After appropriate normalisation and bias correction, we detect fragment pairs showing read coverage higher than expected under the Delaporte assumptions with a one-tailed hypothesis test.
Weighted multiple testing correction for Capture Hi-C For a typical mammalian genome, we test billions of hypotheses—one for each possible bait-other end pair. As a result, the p values must be corrected to account for multiple testing. Standard multiple testing proce-dures assume that interactions are equally likely at all distances. In CHi-C data, however, we perform far more tests to verify the significance of interactions at large distances, where we would expect considerably fewer true interaction events. Consistent with this, the use of a single p value threshold leads to results that
consist mostly of erroneous distal andtrans-chromosomal counts (Fig. 5b, c).
To address this issue, the long-range and trans -chromosomal interaction tests need to be more stringent than the short-range ones. We achieve this with an ap-proach based onpvalue weighting [15, 20]. This proced-ure permits a smooth change of behaviour with distance, thereby bypassing the need to choose a hard distance threshold. Briefly, we assign each fragment pair a weight, estimating how probable it is that the fragments interact. The weights are then used to adjust the p values (see Additional file 1 for full specification). P value weighting can be seen as a simplified version of the empirical Bayesian treatment, with weights related to prior probabilities. One practical advantage of this method for our framework is that it avoids the need to make specific assumptions about the read count distribution of true interactions, which would be required for computing Bayes factors.
The optimal choice of weights depends on the relative abundance of true positives at each bait–other end
Bait bias Distance function Other end bias
10
-400kb -200kb 0 200kb 400kb 11 12 13 14
−0.5 0.0 0.5 1.0 1.5 2.0 2.5
0.0 0.5 1.0 1.5 2.0 2.5
log(distance)
log(f(d))
Read count
Trans-chromosomal read count bins
Trans-chromosomal read count bins
Bias f
act
or
Technical noise estimates per bait pool 80
40
80
40
0 0 0 80
40
s = 0.06
s = 1.02
s = 5.32
Distance from viewpoint
Brownian noise
Technical noise
A
B
C
D
0.00 0.01 0.02 0.03 0.04
Expected level (reads)
Bait to non-bait Bait to bait
(285,358]
[ 63, 584)
[0,8] (77,108] (137,169] (258,830]
[ 2243, 2577) [ 3971, 4332) [ 5847, 6296) [ 9112,10691)
Fig. 4Sources of background counts and bias accounted for by the CHiCAGO model, illustrated with GM12878 data.a–cDifferent factors that
[image:5.595.55.538.86.407.2]distance. We estimate this abundance by assessing repro-ducibility across samples and fitting a bounded logistic curve to the observed reproducibility levels at different dis-tances. Generally similar weight profiles were obtained in GM12878 cells and mESCs, and swapping them between these two datasets yielded highly correlated score profiles (Fig. 5a; Additional file 2: Figure S5). This is consistent with our expectation that weights are largely independent of
specific cell type and organism given comparable genome sizes, as they predominantly reflect the overall distance dis-tribution of true interactions. Emerging multi-replicate CHi-C datasets will further refine our weight estimates and enable a more comprehensive assessment of their depend-ence on the particulars of the model system.
We illustrate the impact of the weighting procedure on GM12878 and mESC CHi-C data by comparing the
A
B
D
C
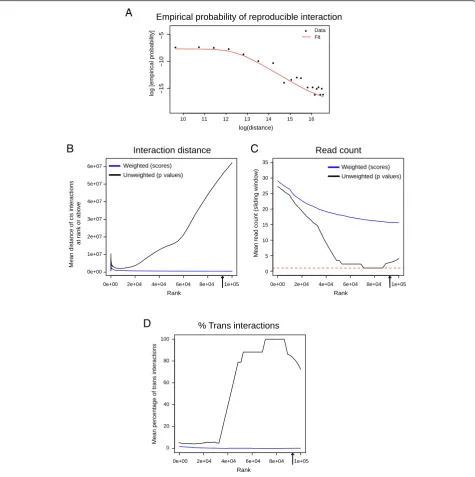
Fig. 5CHiCAGO multiple testing approach schematic.aEmpirical probability of reproducible interaction (used to generate weight profiles) as a
[image:6.595.61.537.88.566.2]properties of the 100,000 top-scoring interactions, called either with or without weighting. The reproducibility of interaction calls decreases with bait–other end distance (Fig. 5a; Additional file 2: Figure S5a). As a result, the “weighted” significant interactions generally span a much shorter range than the unweighted ones (Fig. 5b; Additional file 2: Figure S5b). This is consistent with the biological expectation that promoter-interacting regions, such as en-hancers, are enriched in the relative vicinity of their targets. Another consequence of the weighting procedure is that the average read count is much higher in the weighted calls (Fig. 5c; Additional file 2: Figure S5c). Strikingly, many of the unweighted calls are based on only one read pair per interaction. As the vast majority of fragment pairs attract no reads at all, lowpvalues for single read-pair interactions are expected. However, due to the very large number of possible fragment pairs (approximately 18.5 billion in both the GM12878 and the mESC data), we still expect thousands of single read-count calls to be generated by technical noise. These spurious calls, the majority of which correspond totrans-chromosomal pairs (Fig. 5d; Additional file 2: Figure S5d), are generally non-reproducible and are therefore excluded by the weighting procedure.
In conclusion, the pvalue weighting procedure imple-mented in CHiCAGO provides a multiple testing treat-ment that accounts for the differences in true positive rates at different bait–other end distances, thus improving the reproducibility of interaction calls.
Promoter interactions detected by CHiCAGO: validation and key properties
We validated CHiCAGO by assessing the functional properties of significant interactions detected with it in human GM12878 cells [3] and mESCs [4] under default settings and a score threshold of 5. Table 1 displays sum-mary statistics for each sample, showing the generally similar numbers of detected significant interactions, both overall and per bait, despite the differences in the organism and cell type between them.
Enrichment for regulatory features
We first assessed the enrichment of promoter-interacting fragments for histone marks associated with active (H3K4me1, H3K4me3, H3K27ac) and repressed (H3K27me3, H3K9me3) chromatin, as well as for the binding sites of CTCF, a protein with a well-established role in shaping nuclear architecture [21]. To this end, we compared the observed and expected numbers of promoter-interacting fragments overlapping with these features. To estimate the expected degree of overlap, we drew multiple permutations of the promoter–other end pairs not detected as interacting, such that the overall dis-tribution of their spanned distances matched the distribu-tion for the true interacdistribu-tions.
Figure 6 shows the observed and expected numbers of CHiCAGO other ends (yellow and blue bars, respect-ively) that overlap with the regulatory features in GM12878 and mESCs (panels a and b, respectively). Consistent enrichments over expected values were found for active histone marks (H3K4me1, H3K4me3, H3K27ac) in both cell types, in line with the expectation that looping interactions preferentially link promoters and remote regulatory regions such as enhancers. We also found that promoter-interacting fragments were strongly enriched for CTCF binding sites, as previously reported [9, 21]. Interestingly, promoter-interacting fragments were also enriched for repressed chromatin marks, in particular for H3K27me3 in mESCs, supporting the role of Polycomb in shaping nuclear architecture in this cell type [5].
Assessing the enrichment of promoter-interacting fragments for known regulatory features can serve as a useful quality control for CHi-C samples. To this end, CHiCAGO automatically generates enrichment bar plots similar to Fig. 6 for each sample, integrating interaction calls with user-specified genomic annotations, such as ChIP-seq peaks.
[image:7.595.57.538.603.715.2]Enrichment for genome-wide association study SNPs The majority of disease-associated SNPs identified in genome-wide association studies (GWAS) localise to non-coding regulatory regions, away from annotated
Table 1The properties of CHiCAGO-detected interactions in human lymphoblastoid cell line GM12878 and mESCs
GM12878 mESC
Number of captured baits 22,076 22,459
Total number of unique captured read pairs Rep 1: 46,542,745 Rep 1: 59,963,697
Rep 2: 118,813,226 Rep 2: 82,026,534
Rep 3: 73,881,698
Number of significant interactions 88,667 94,148
Mean number of significant interactions per bait 4.02 4.19
Median distance ofcis-chromosomal interactions 173,365 bp 138,077 bp
Input read pairs are given per biological replicate (Rep). Default settings and a score threshold of 5 were used in interaction calling, performed jointly on
promoters, posing a significant challenge in identifying their putative target genes [22]. We asked whether promoter-interacting regions detected by CHiCAGO in human cells are enriched for GWAS SNPs, which would potentially reflect their presence in long-range regulatory sequences and thus suggest a putative functional role in disease.
We assessed the enrichment of promoter-interacting regions in GM12878 cells for sets of GWAS catalogue SNPs from Maurano et al. [22]. These sets reflect the grouping of GWAS traits into broader categories, such as autoimmune disease (AI), neurological/behavioural traits (NB) and kidney/liver/lung disorders (KLL). We used the software package GoShifter (Genomic Anno ta-tionShifter) [23], which infers the significance of overlap by locally shifting genomic annotations (in our case, the “other ends” of CHiCAGO-detected promoter interac-tions), thus reducing the effect of genomic biases and link-age disequilibrium structure. We observed a significant enrichment of CHiCAGO “other ends” for SNPs associ-ated with autoimmune diseases (GOShifterp= 0.001) but not with kidney/liver/lung disorders (p= 0.876) or neuro-logical/behavioural traits (p= 0.742). This selective enrich-ment for autoimmune SNPs is consistent with GM12878 being a lymphocyte-derived cell line and replicates the original findings of Mifsud et al. [3].
We further confirmed that the enrichment for AI dis-ease-associated SNPs was specific to promoter-interacting fragments. We used the same approach as in the previous section to generate 100 random samples of distance-matched “negative” (non-significant) interactions and
tested the other ends of these interactions for SNP enrichment. The enrichment for AI-associated SNPs was selectively observed in the “true” set but not in the “negative” set and neither set was enriched for the NB- and KLL-associated SNPs (Fig. 7).
Taken together, these results demonstrate the power of using CHi-C data to link GWAS SNPs with their putative target genes in a cell type-specific and high-throughput manner. We expect this to be one of the key applications of CHi-C in future clinical studies.
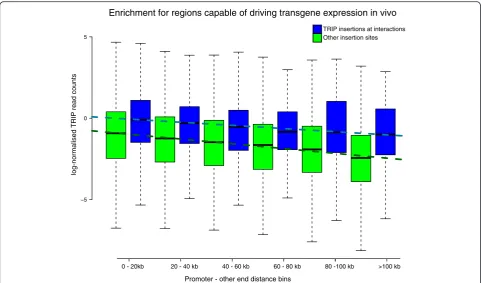
Capability to drive transgene expression in vivo
TRIP (Thousands of Reporters Integrated in Parallel) is a novel experimental technique to assess the influence of local chromatin context on gene expression. In TRIP analysis, a barcoded transgene reporter is randomly inte-grated into thousands of genomic locations in parallel and the transcriptional activity at each location is then monitored. Here we integrated the published TRIP analysis dataset in mESCs [24] with the CHiCAGO mESC calls [4], comparing the transcriptional activity at promoter-interacting regions with the activity elsewhere, over a range of genomic distances.
Consistent with the observation from the original TRIP study, we found that the distance from the nearest promoter was a strong determinant of transgene expres-sion levels (Fig. 8). However, transgenes mapping to promoter-interacting fragments consistently showed higher expression levels across the whole range of gen-omic distances, as confirmed by linear regression (effect size = 0.825; Wald test p< 0.001). This result provides
0
2000
4000
6000
8000
10000
12000
CTCF H3K4me1 H3K4me3 H3K27ac H3K27me3 H3K9me3 GM12878
A
0
2000
4000
6000
8000
10000
12000
CTCF H3K4me1 H3K4me3 H3K27ac H3K27me3 H3K9me3 mESC
Significant interactions Random samples
Significant interactions Random samples
B
Number of overlaps with feature Number of overlaps with feature
Fig. 6Chromatin features of promoter-interacting fragments detected using CHiCAGO.Yellow barsindicate overlaps withcis-interacting fragments
[image:8.595.60.540.87.291.2]functional evidence that CHiCAGO-detected promoter-interacting fragments preferentially possess transcrip-tional regulatory activity.
Promoter–promoter networks
Interactions where both fragment ends are baited (referred to as“bait-to-bait interactions”) represent contacts between gene promoters. These interactions are of special interest because they may help to identify sets of co-regulated genes recruited to either shared transcription factories [25] or re-pression networks such as those mediated by Polycomb proteins [5].
[image:9.595.58.539.86.367.2]As an illustration of CHiCAGO’s potential in identi-fying sets of co-regulated genes, we show CHiCAGO-detected bait-to-bait interactions involving histone promoters present on chromosome 6 in GM12878 cells (Fig. 9). We see that histone promoters fre-quently interact with other histone promoters, more so than with promoters of other genes in the same genomic region, consistent with previous observations [4, 26, 27].
Extremely long-range promoter interactions map within broader Hi-C contact regions
We took advantage of the pre-capture Hi-C dataset in mESCs [4] to compare CHiCAGO-detected interactions in Promoter CHi-C with the broader-scale interaction signals detectable in Hi-C. The Promoter CHi-C dataset has over tenfold higher coverage at promoters compared with the respective Hi-C sample [4] and thus we would expect a corresponding increase in the sensitivity of detecting promoter-containing interactions. Consistent with this, while some stronger interactions in the short range (<1 Mb) could be visually distinguished on Hi-C interaction matrices (Fig. 10a), more than 80 % of CHi-C interactions in this range localised away from Hi-C interacting regions detected with HOMER [28] at a 25-kb resolution (Fig. 10b). In contrast, we found that more than 80 % extremely long-range (>10 Mb) cis -chromo-somal interactions and 45 % trans-chromosomal interac-tions mapped within the broader (1 Mb-wide) Hi-C contact areas (Fig. 10c). However, only a small minority of these megabase-scale contact areas contained CHi-C in-teractions (~3 % of >10 Mbcis-chromosomal and ~0.5 % 0
2 4 6
AI KLL NB
−log(GOShifter p
v
alue)
Significant interactions
Random samples
Trait
Enrichment for GWAS SNPs
Fig. 7Significant enrichment for GWAS SNPs at CHiCAGO-detected promoter-interacting regions in human lymphoblastoid cells. Enrichment for
trans-chromosomal, as illustrated in Fig. 10d and Additional file 2: Figure S6). Taken together, these results are consistent with a high specificity and resolution of CHiCAGO long-range interaction calling. At the same time, they warrant a further examination of the relationship between specific looping interactions and higher-order chromosomal contacts.
Discussion
In this paper, we present the CHiCAGO algorithm for Capture Hi-C analysis and demonstrate its efficacy in detecting interactions enriched for regulatory chromatin features and relevant GWAS SNPs.
Our approach is based on the assumption that“ signifi-cant” interactions emerge as outliers on a distance-dependent local background profile. This assumption is shared by most other tools for interaction detection in 3C-like data and seems reasonable for the purposes of identifying regulatory interactions. Indeed, it can be ex-pected that regulatory events such as transcription factor binding will stabilise the chromatin loop, leading to interaction frequencies or retention times beyond those
generated by random collisions due to Brownian motion. This expectation is supported by the observation that CHiCAGO-detected interactions are selectively enriched for regulatory chromatin features, even when located in regions with high background interaction levels.
While the conceptual interpretation of“significant” in-teractions is shared between CHiCAGO and algorithms developed for other types of 4C and Hi-C data, there are key differences in terms of the underlying background model, the normalisation strategy and the multiple test-ing procedure.
Existing tools model Hi-C background with a broad range of distributions, both discrete (binomial [16, 29], negative binomial [6]) and continuous (Weibull [7, 9], normal [13]). In CHiCAGO, we instead opted for a two-component convolution model that incorporates two count distributions: a negative binomial and a Poisson. In doing so, we were motivated by the fact that distance-dependent Brownian collisions and technical variability are two distinct background count-generating processes whose properties are best learned separately on different subsets of data. Indeed, signals from Brownian collisions
−5 0 5
log-normalised
TRIP
read counts
0 - 20kb 20 - 40 kb 40 - 60 kb 60 - 80 kb 80 -100 kb >100 kb
Promoter - other end distance bins
TRIP insertions at interactions Other insertion sites
Enrichment for regions capable of driving transgene expression in vivo
Fig. 8Enrichment of promoter-interacting fragments for regions capable of driving transgene expression in mESCs. TRIP (Thousands of Reporters
Integrated in Parallel) assesses the influence of local chromatin context on gene expression. This is achieved by integrating a barcoded transgene reporter into thousands of genomic locations in parallel and monitoring the transcriptional activity at each location [24]. Normalised RNA read counts from reporter insertions are separated according to (i) their overlap withHindIII fragments engaging or not in interactions; (ii) their promoter-other end distance. For non-interactingHindIII fragments, distance is measured from the nearest promoter in the linear sequence.Blue
andgreen box plotsindicate read count summary statistics for promoter-interacting and non-interactingHindIII fragments, respectively. Eachdashed line
[image:10.595.57.539.87.370.2]ostensibly dominate the background at short distances, to the extent that technical variability is barely detect-able. In contrast, at large linear distances between frag-ments, Brownian collisions are too weak for their count distribution to be estimated directly. Thus, we infer this distribution by extrapolation.
Borrowing information across baits to learn the back-ground model, as CHiCAGO does, requires careful nor-malisation across interactions. While Hi-C background depends on a number of known parameters, such as fragment length and GC content [10], we, along with others [7, 8, 30], have opted to avoid any specific as-sumptions about noise structure, particularly given the increased complexity and asymmetric nature of capture Hi-C noise compared with conventional Hi-C. Assuming that interactions are subject to multiplicative bait- and other-end-specific bias, as we did in learning the Brownian background component, parallels the assumptions of the Hi-C iterative correction approach by Imakaev et al. [8] and is generally consistent with data from molecular dy-namics simulations of chromatin fibres [18]. In modelling technical noise, we assumed it to be reflected in the numbers of trans-chromosomal interactions involving the same fragment. A similar strategy has been applied
independently in a recently published Capture Hi-C study [6]; the same authors also proposed an iterative correction algorithm for Capture Hi-C data [7] (software not publicly released) that may complement the approaches taken here.
Multiple testing issues are important in genomic ana-lyses and, in attempting to address these issues, a num-ber of bespoke approaches have been developed [20, 31]. The specific challenge of multiple testing in Hi-C data is that we expect the fractions of true positives to vary de-pending on the genomic distance between the fragments; in fact, the majority of tests are performed with interac-tions spanning large distances or spanning different chromosomes, where true positive signals are least ex-pected. CHiCAGO’s multiple testing procedure is based on the p value weighting approach by Genovese et al. [15], which is a generalisation of a segment-wise weight-ing procedure by Sun et al. [32]. These approaches have been used successfully to incorporate prior knowledge in GWAS [33–35] and are emerging in functional genom-ics analyses [36, 37]. In using the reproducibility of sig-nificant calls across replicates as an estimate of the relative true positive rate, we have taken inspiration from the irreproducible discovery rate (IDR) approach [38]
HIST1H1A HIST1H4B
HIST1H3B HIST1H2AB
HIST1H2BB HIST1H1C HIST1H4C
HIST1H1T HIST1H2BC
HIST1H1E HIST1H2BE
HIST1H4D HIST1H2AD
HIST1H2BF HIST1H2BG
HIST1H3E HIST1H1D
HIST1H4F HIST1H4G
HIST1H3F HIST1H2BH
HIST1H2BL HIST1H3H
HIST1H2AJ HIST1H4J
HIST1H4K HIST1H2AK
POM121L2
HIST1H2BJ HIST1H4I HIST1H2BK
HIST1H2AL HIST1H1B HIST1H3I HIST1H4L HIST1H3J HIST1H2BO
: 25799537-27959486 300kb
HMGN4
ABT1
ZNF184
Fig. 9Circlet view of promoter–promoter interactions for histone genes in GM12878 cells. Interactions where histone gene promoters are
[image:11.595.58.537.87.387.2]0
2
04
06
08
0
1
0
0
% CHi−C inter
actions within
25kb Hi-C regions
Observed Expected
(0-100kb]
(100-200kb](200-300kb](300-400kb](400-500kb](500-600kb](600kb-1M]
Interaction distance Interaction distance
B
D
C
01
0
2
0
3
0
40
50
60
Tbx5
0
20
40
60
80
100
120
140
Pax6 Foxo4
Number of reads Number of reads
0
10
20
30
40
Number of reads Number of reads
02
0
4
0
6
0
8
0
% CHi−C inter
actions within
1Mb Hi-C regions
(1-10M]
(10−20M](20−30M] (30−40M](40−50M] 50+M
Trans Observed Expected
A
Chromosome 11 (Mb)
Chromosome 6 (Mb) 0
20
40
60
80
100
120
0 20 40 60 80 100 120 140
n=1
n=1 n=36
n=2
n=1
Hi-C interactions CHi-C interactions
Chromosome 6 (Mb)
Chromosome 6 (Mb)
Chromosome 11 (Mb)
Chromosome 11 (Mb)
0 500
-500
-750 -250 250 750 (kb) -750 -500 -250 0 250 500 750 (kb)
0 500
-500
-750 -250 250 750 (kb)
0
20
40
60
80
100
120
0 20 40 60 80 100 120 0
20
40
60
80
100
120
140
[image:12.595.60.540.85.618.2]0 20 40 60 80 100 120 140
used to determine peak signal thresholds in other types of genomics data, such as ChIP-seq.
Note that, in this setting, IDR cannot be used verbatim for choosing signal thresholds, as the relationship be-tween Capture Hi-C signal and reproducibility does not satisfy IDR assumptions, likely because of undersampling issues (not shown). Importantly, conventional false dis-covery rate (FDR)-based approaches for multiple testing correction [39] are also unsuitable for these data. Indeed, CHi-C observations (read-pair counts) are discrete and many of them are equal to either zero or one. This leads to a highly non-uniform distribution of p values under the null, violating the basic assumption of conventional FDR approaches. The“soft-thresholding” approach used in CHiCAGO shifts the−log-weightedpvalues such that non-zero scores correspond to observations, where the evidence for an interaction exceeds that for a pair of near-adjacent fragments with no reads. More robust thresholds can then be chosen based on custom criteria, such as maximising enrichment of promoter-interacting fragments for chromatin features (Fig. 6; a user-friendly function for this analysis is provided as part of the Chicago R package—see the package vignette provided as Additional file 3). Based on this approach, we chose a signal threshold of 5 for our own analyses.
The undersampled nature of CHi-C data (particularly at longer distance ranges), although robustly handled by CHiCAGO, may lead to significant sensitivity issues when using thresholded interaction calls in comparative analyses. We therefore suggest performing comparisons based on the continuous score range. Potentially, differ-ential analysis algorithms for sequencing data (such as DESeq2 [40]) may also be used to formally compare the enrichment at CHiCAGO-detected interactions between conditions at the count level, although power will gener-ally be a limiting factor. As undersampling drives down the observed overlap of interactions called on different samples (Additional file 2: Figure S4c), methods such as [41, 42] may be considered for formally ascertaining the
consistency between datasets. Additional filtering based on the mean number of reads per detected interaction (e.g., removing calls whose mean N is below 10 reads) will also reduce the impact of undersampling on the ob-served overlap, but at the cost of decreasing the power to detect longer-range interactions.
Thepvalue weighting approach used here is similar in spirit to an empirical Bayesian treatment, with the p
value weights related, but not identical, to prior prob-abilities. Bayesian approaches are widely used (including, recently, for signal detection in conventional Hi-C [43]) and the Bayes factors and posterior probabilities they generate are potentially more intuitive than weighted p
values. However, the p value weighting approach used here has the advantage of not making any specific assump-tions about the read distribuassump-tions of“true interactions”, be-yond their having a larger mean. Both approaches open the opportunity of incorporating prior knowledge, beyond the dependence of reproducibility on distance—for example, taking into account the boundaries of topologically associ-ated domains (TADs) [44], higher-order contact domains and chromosomal territories. We choose not to do this currently because the exact relationship between these genomic properties and looping interactions still requires further investigation, and incorporating these relationships a priori prevents their investigation in post hoc analyses. Active research in this area makes it likely that much more will be known about the determinants of loop formation in the near future, enabling a more extensive use of prior knowledge in interaction detection, potentially with a formal Bayesian treatment.
The downstream analyses of CHiCAGO results provided in this paper confirm the enrichment of promoter-interacting regions for regulatory features and disease-associated variants. These results demonstrate the enormous potential of CHi-C for both functional gen-omics and population genetics, and this assay will likely be applied in multitudes of other cell types in the near future. Therefore, user-friendly, open-source software for robust (See figure on previous page.)
Fig. 10Comparison of interactions detected in CHi-C and Hi-C data.aTop panels: plots showing the read counts from bait–other end pairs within
signal detection in these challenging data will be a wel-come addition to the toolkits of many bioinformaticians and experimentalists alike. We have developed CHiCAGO with the view of addressing this need. Furthermore, we ex-pect the statistical foundations of CHiCAGO, particularly the convolution background model and the multiple test-ing procedure, to be potentially useful in a broader range of Hi-C-related assays.
Conclusions
The publicly available, open-source CHiCAGO pipeline presented here [45] produces robust and interpretable interaction calls in CHi-C data. Promoter-interacting fragments identified using this algorithm are enriched for active chromatin features, GWAS SNPs and regions capable of driving transgene expression, indicative of regulatory looping interactions. While developed specif-ically for CHi-C, the statistical principles of CHiCAGO are potentially applicable to other Hi-C-based methods.
Methods
Sample pre-processing
The publicly available HiCUP pipeline [46, 47] was employed to process the raw sequencing reads. This pipeline was used to map the read pairs against the mouse (mm9) and human (hg19) genomes, to filter ex-perimental artefacts (such as circularized reads and re-ligations) and to remove duplicate reads. For the CHi-C data, the resulting BAM files were processed into CHi-CAGO input files, retaining only those read pairs that mapped, at least on one end, to a captured bait. The script bam2chicago.sh, used for this purpose, is available as part of the chicagoTools suite [45].
The CHiCAGO algorithm
A full description of the algorithm is given in Additional file 1. A tutorial on using the CHiCAGO package (the “vignette”) is provided in Additional file 3.
Briefly, to combine replicates, a“reference”replicate is created by taking the geometric mean of each fragment pair’s count across samples. Sample size factors are cal-culated by taking the mean ratio to the“reference” repli-cate, in a manner similar to the sample normalisation strategy implemented in DESeq [48]. Final counts are derived as the rounded weighted sum of counts across replicates, where the weights are the sample size factors.
Background from Brownian collisions is assumed to have negative binomial distribution, with mean sisjf(dij) and dispersion r, where i indexes over other ends andj
indexes over baits.
Estimation ofsi,sj,f(d)and ris performed in“proximal bins”—by default, 20-kb bins that span the first 1.5 Mb around each bait.
The distance functionf(d)is estimated as follows:
For each bait, take all of the other ends in a distance bin to get a mean count for that bin.
f(d)is estimated in a distance bin by taking the geometric mean of the bin counts at that distance, across all baits.
To interpolatef(d)from these point estimates, we use a maximum likelihood cubic fit on a log–log scale.
Outside of this distance range, we extrapolate linearly, assuming continuity of f and its first derivative.
The bait-specific scaling factors, sj, are estimated by considering each mean bin count divided by f(d), then taking the median of this ratio, across all bins associated with a bait. The other end-specific scaling factors,si, are estimated similarly but with the other ends pooled to-gether (the pools are chosen such that their content
ends have similar numbers of trans
-chromo-somal counts) so that there is enough information for a precise estimate. The dispersion, r, is estimated using standard maximum likelihood methods.
The technical noise is assumed to have Poisson distribu-tion, with mean λij. λij is estimated from trans -chromo-somal counts—again, first pooling fragments by the number
of trans-chromosomal counts they exhibit. Specifically, to
estimate the technical noise level for a putative interaction between a bait in pool A and an other end in pool B, we count the number of interactions that span between pools A and B and divide this by |A||B|, the total number of bait–other end fragment pairs from those pools.
P values are called with a Delaporte model, represent-ing the sum of two variables: a negative binomial vari-able with mean sisjf(dij)and dispersion r, and a Poisson variable with meanλij. A four-parameter bounded logis-tic regression model is assumed for p value weighting (see the next section and Additional file 1 for more information).
The final CHiCAGO score is obtained from soft-thresholding the−log(weighted pvalue). Specifically, the score is max(−log(p) + log(w)−log(wmax), 0), wherewmax is the maximum attainable weight, corresponding to zero distance. For the downstream analyses in this paper, interactions with CHiCAGO scores ≥5 were considered as“significant interactions”.
Pvalue weighting parameter estimation
The p value weighting function has four parameters: α,
subsets are used.) The reproducible interactions are defined as those where the stringent threshold of log(p) <−10 is passed in all biological replicates. Now, for each subset, we take a series of genomic distance bins (with the default breaks occurring at 0, 31.25 kb, 62.5 kb, 125 kb, 250 kb, 500 kb, 1 Mb, 2 Mb, 3 Mb, 4 Mb, …, 16 Mb), and we calculate the proportion of reproducible interactions out of the total number of possible interactions. The maximum likelihood esti-mates are calculated for each model parameter using standard optimization methods [49]. Final parameter estimates are obtained by taking the median across the estimates from each subset. The two replicates of mESC data [4] were used for estimating weights. For GM12878 [3], the first replicate was not used for weight estimation as it led to unstable estimation. This was likely due to the poorer quality of this replicate compared with the other two, consistent with its higher
cis/trans-chromosomal count ratios (data not shown).
Recommendations on diagnosing unstable estimates are provided in the R package vignette (Additional file 3).
The Chicago R package
CHiCAGO was implemented as a package for the statis-tical environment R [50] taking advantage of the data.table objects [51] to optimise for both speed and memory. The fully documented R package “Chicago” and the tutorial data package “PCHiCdata” are publicly available [45] under Artistic Licence 2.0 and are part of Bioconductor release 3.3+ [52, 53]. A documented set of supplementary scripts (chicagoTools) for data pre- and post-processing and running Chicago in batch mode is also publicly avail-able [45]. Chicago v1.0.1 was used in this paper.
A typical Chicago job for two biological replicates of CHi-C data takes 2–3 h wall-clock time (including sam-ple pre-processing from bam files using chicagoTools) and uses 50 GB RAM. An example workflow in the form of an R package vignette is provided as Additional file 3. The description of free parameters and rationale for their settings is given in Additional file 2: Table S1.
Assessment of feature enrichment
Enrichment for chromatin features at CHi-C interacting regions was assessed with respect to random HindIII fragments drawn in such a way as to match the distribu-tion of the observed interacdistribu-tion distances. A 95 % confi-dence interval for the expected overlap was obtained from 100 random draws. SNP enrichment at promoter interacting fragments was assessed using GoShifter [23].
Hi-C analyses
HOMER [28] was used to compute binned coverage-and distance-related background in the Hi-C data coverage-and call significantly interacting bin pairs. Short-range cis
-chromosomal interactions (<1 Mb) were detected in 25-kb bins; long-range cis-chromosomal (>1 Mb) and trans -chromosomal interactions were detected in 1-Mb bins. Bin pairs with FDR-adjusted p< 0.05 were considered signifi-cant. The significance of overlap between CHi-C promoter-interacting regions identified by CHiCAGO and the HOMER-detected interacting bin pairs in the Hi-C data was ascertained by permutation, while preserving the struc-tural features of the data, as follows. Cis-chromosomal in-teractions were permuted across the baits while preserving the interaction distances. Trans-chromosomal interactions were permuted across chromosomes while preserving the relative chromosomal position of the interacting fragments.
Data access
Raw CHi-C, Hi-C and random ligation control data used in this study are available in ArrayExpress [54, 55] under accession numbers MTAB-2323 (GM12878) and E-MTAB-2414 (mESC), respectively. CHiCAGO experiment design files and output files produced with default package settings for GM12878 and mESCs are available through the Open Science Framework [56]. The interaction calls and raw reads for both cell types (score≥5) have also been submitted to the NCBI Gene Expression Omnibus under accession number GSE81503 [57].
Additional files
Additional file 1:The mathematical specification of the CHiCAGO
algorithm. (PDF 304 kb)
Additional file 2:Figures S1 to S6 and Table S1. (PDF 803 kb)
Additional file 3:The CHiCAGO R package tutorial. (PDF 946 kb)
Acknowledgements
The authors would like to thank Simon Andrews, Chris Wallace, Oliver Burren and all members of the Spivakov, Fraser and Babraham Bioinformatics groups for helpful discussions. We are grateful to all our“wet-lab”collaborators (in particular, Mayra Furlan-Magaril, Mattia Frontini, Peter Rugg-Gunn and Willem Ouwehand) for using and testing CHiCAGO. This work has been funded by the Biotechnology and Biological Sciences Research Council and the Medical Research Council of the UK; DZ is funded by the European Molecular Biology Laboratory. Finally, we thank Laura Biggins for disambiguating the last two letters of CHiCAGO.
Authors’contributions
JC, PFP and MS designed the CHiCAGO algorithm; VP and DZ contributed statistical advice; JC, PFP, SWW and MS implemented the algorithm. SS, CO, BMJ and PF generated Capture Hi-C data and advised on their biological properties. PFP, CV, AD, JC and MS performed downstream validation analyses. JC, PFP and MS wrote the paper with critical input from all authors. MS supervised the work. All authors read and approved the final manuscript.
Competing interests
The authors declare that they have no competing interests.
Ethics approval and consent to participate Ethics approval was not required for this study.
Author details
Institute, London, UK.4European Molecular Biology Laboratory, European Bioinformatics Institute, Cambridge, UK.5Department of Medical and Molecular Genetics, King’s College, London, UK.
Received: 1 April 2016 Accepted: 25 May 2016
References
1. Dekker J, Marti-Renom MA, Mirny LA. Exploring the three-dimensional organization of genomes: interpreting chromatin interaction data. Nat Rev Genet. 2013;14:390–403.
2. van Steensel B, Dekker J. Genomics tools for unraveling chromosome architecture. Nat Biotechnol. 2010;28:1089–95.
3. Mifsud B, Tavares-Cadete F, Young AN, Sugar R, Schoenfelder S, Ferreira L, et al. Mapping long-range promoter contacts in human cells with high-resolution capture Hi-C. Nat Genet. 2015;47:598–606.
4. Schoenfelder S, Furlan-Magaril M, Mifsud B, Tavares-Cadete F, Sugar R, Javierre BM, et al. The pluripotent regulatory circuitry connecting promoters to their long-range interacting elements. Genome Res. 2015; 25:582–97.
5. Schoenfelder S, Sugar R, Dimond A, Javierre BM, Armstrong H, Mifsud B, et al. Polycomb repressive complex PRC1 spatially constrains the mouse embryonic stem cell genome. Nat Genet. 2015;47:1179–86.
6. Dryden NH, Broome LR, Dudbridge F, Johnson N, Orr N, Schoenfelder S, et al. Unbiased analysis of potential targets of breast cancer susceptibility loci by Capture Hi-C. Genome Res. 2014;24:1854–68.
7. Jager R, Migliorini G, Henrion M, Kandaswamy R, Speedy HE, Heindl A, et al. Capture Hi-C identifies the chromatin interactome of colorectal cancer risk loci. Nat Commun. 2015;6:6178.
8. Imakaev M, Fudenberg G, McCord RP, Naumova N, Goloborodko A, Lajoie BR, et al. Iterative correction of Hi-C data reveals hallmarks of chromosome organization. Nat Methods. 2012;9:999–1003.
9. Sanyal A, Lajoie BR, Jain G, Dekker J. The long-range interaction landscape of gene promoters. Nature. 2012;489:109–13.
10. Yaffe E, Tanay A. Probabilistic modeling of Hi-C contact maps eliminates systematic biases to characterize global chromosomal architecture. Nat Genet. 2011;43:1059–65.
11. Sahlen P, Abdullayev I, Ramskold D, Matskova L, Rilakovic N, Lotstedt B, et al. Genome-wide mapping of promoter-anchored interactions with close to single-enhancer resolution. Genome Biol. 2015;16:156.
12. van de Werken HJ, Landan G, Holwerda SJ, Hoichman M, Klous P, Chachik R, et al. Robust 4C-seq data analysis to screen for regulatory DNA interactions. Nat Methods. 2012;9:969–72.
13. Klein FA, Pakozdi T, Anders S, Ghavi-Helm Y, Furlong EE, Huber W. FourCSeq: analysis of 4C sequencing data. Bioinformatics. 2015;31:3085–91. 14. Raviram R, Rocha PP, Müller CL, Miraldi ER, Badri S, Fu Y, et al. 4C-ker: a
method to reproducibly identify genome-wide interactions captured by 4C-Seq experiments. PLoS Comput Biol. 2016;12:e1004780.
15. Genovese CR, Roeder K, Wasserman L. False discovery control with p-value weighting. Biometrika. 2006;93:509–24.
16. Ay F, Bailey TL, Noble WS. Statistical confidence estimation for Hi-C data reveals regulatory chromatin contacts. Genome Res. 2014;24:999–1011. 17. Thongjuea S, Stadhouders R, Grosveld FG, Soler E, Lenhard B. r3Cseq: an R/
Bioconductor package for the discovery of long-range genomic interactions from chromosome conformation capture and next-generation sequencing data. Nucleic Acids Res. 2013;41:e132.
18. Rosa A, Becker NB, Everaers R. Looping probabilities in model interphase chromosomes. Biophys J. 2010;98:2410–9.
19. Bohn M, Heermann DW. Diffusion-driven looping provides a consistent framework for chromatin organization. PLoS One. 2010;5:e12218. 20. Gui J, Tosteson T, Borsuk M. Weighted multiple testing procedures for
genomic studies. BioData Mining. 2012;5:4.
21. Ong C-T, Corces VG. CTCF: an architectural protein bridging genome topology and function. Nat Rev Genet. 2014;15:234–46.
22. Maurano MT, Humbert R, Rynes E, Thurman RE, Haugen E, Wang H, et al. Systematic localization of common disease-associated variation in regulatory DNA. Science. 2012;337:1190–5.
23. Trynka G, Westra H-J, Slowikowski K, Hu X, Xu H, Stranger Barbara E, et al. Disentangling the effects of colocalizing genomic annotations to functionally prioritize non-coding variants within complex-trait loci. Am J Hum Genet. 2015;97:139–52.
24. Akhtar W, de Jong J, Pindyurin AV, Pagie L, Meuleman W, de Ridder J, et al. Chromatin position effects assayed by thousands of reporters integrated in parallel. Cell. 2013;154:914–27.
25. Sexton T, Umlauf D, Kurukuti S, Fraser P. The role of transcription factories in large-scale structure and dynamics of interphase chromatin. Semin Cell Dev Biol. 2007;18:691–7.
26. Ma T, Van Tine BA, Wei Y, Garrett MD, Nelson D, Adams PD, et al. Cell cycle-regulated phosphorylation of p220(NPAT) by cyclin E/Cdk2 in Cajal bodies promotes histone gene transcription. Genes Dev. 2000;14:2298–313. 27. Wang Q, Sawyer IA, Sung M-H, Sturgill D, Shevtsov SP, Pegoraro G, et al.
Cajal bodies are linked to genome conformation. Nat Commun. 2016;7:10966. 28. Heinz S, Benner C, Spann N, Bertolino E, Lin YC, Laslo P, et al. Simple
combinations of lineage-determining transcription factors primecis-regulatory elements required for macrophage and B cell identities. Mol. Cell. 38:576–89. 29. Mifsud B, Martincorena I, Darbo E, Sugar R, Schoenfelder S, Fraser P, Luscombe
N. GOTHiC, a simple probabilistic model to resolve complex biases and to identify real interactions in Hi-C data. biorXiv preprint. 2015;10.1101/023317. 30. Hu M, Deng K, Selvaraj S, Qin Z, Ren B, Liu JS. HiCNorm: removing biases in
Hi-C data via Poisson regression. Bioinformatics. 2012;28:3131–3.
31. Dudoit S, van der Laan MJ. Multiple testing procedures with applications to genomics. New York: Springer; 2008.
32. Sun L, Craiu RV, Paterson AD, Bull SB. Stratified false discovery control for large-scale hypothesis testing with application to genome-wide association studies. Genet Epidemiol. 2006;30:519–30.
33. Lin WY, Lee WC. Improving power of genome-wide association studies with weighted false discovery rate control and prioritized subset analysis. PLoS One. 2012;7:e33716.
34. Roeder K, Wasserman L. Genome-wide significance levels and weighted hypothesis testing. Stat Sci. 2009;24:398–413.
35. Li L, Kabesch M, Bouzigon E, Demenais F, Farrall M, Moffatt MF, et al. Using eQTL weights to improve power for genome-wide association studies: a genetic study of childhood asthma. Front Genet. 2013;4:103.
36. Ignatiadis N, Klaus B, Zaugg JB, Huber W. Data-driven hypothesis weighting increases detection power in genome-scale multiple testing. Nat. Methods. 2016; doi:10.1038/nmeth.3885.
37. Zhao H, Fung WK. A powerful FDR control procedure for multiple hypotheses. Comput Stat Data Anal. 2016;98:60–70.
38. Li Q, Brown JB, Huang H, Bickel PJ. Measuring reproducibility of high-throughput. Ann Appl Stat. 2011;5:1752–79.
39. Benjamini Y, Hochberg Y. Controlling the false discovery rate: a practical and powerful approach to multiple testing. J R Stat Soc Ser B Methodol. 1995;57:289–300.
40. Love MI, Huber W, Anders S. Moderated estimation of fold change and dispersion for RNA-seq data with DESeq2. Genome Biol. 2014;15:1–21. 41. Jeffries CD, Ward WO, Perkins DO, Wright FA. Discovering collectively
informative descriptors from high-throughput experiments. BMC Bioinformatics. 2009;10:431.
42. Blangiardo M, Cassese A, Richardson S. sdef: an R package to synthesize lists of significant features in related experiments. BMC Bioinformatics. 2010;11:1–10.
43. Xu Z, Zhang G, Jin F, Chen M, Furey TS, Sullivan PF, et al. A hidden Markov random field-based Bayesian method for the detection of long-range chromosomal interactions in Hi-C data. Bioinformatics. 2016;32:650–6. 44. Dixon JR, Selvaraj S, Yue F, Kim A, Li Y, Shen Y, et al. Topological domains in
mammalian genomes identified by analysis of chromatin interactions. Nature. 2012;485:376–80.
45. The CHiCAGO home page. http://www.regulatorygenomicsgroup.org/ chicago.Accessed 25 May 2016.
46. HiCUP. http://www.bioinformatics.babraham.ac.uk/projects/hicup/ overview/. Accessed 25 May 2016.
47. Wingett S, Ewels P, Furlan-Magaril M, Nagano T, Schoenfelder S, Fraser P, et al. HiCUP: pipeline for mapping and processing Hi-C data. F1000Res. 2015;4:1310.
48. Anders S, Huber W. Differential expression analysis for sequence count data. Genome Biol. 2010;11:R106.
49. Nelder JA, Mead R. A simplex method for function minimization. Comput J. 1965;7:308–13.
[image:16.595.300.535.92.742.2]50. R Development Core Team. R: a language and environment for statistical computing. Vienna, Austria: R Foundation for Statistical Computing; 2015. 51. data.table: Extension of data.frame. http://CRAN.R-project.org/package=data.
52. Huber W, Carey VJ, Gentleman R, Anders S, Carlson M, Carvalho BS, et al. Orchestrating high-throughput genomic analysis with Bioconductor. Nat Methods. 2015;12:115–21.
53. The Chicago R package on Bioconductor. http://bioconductor.org/ packages/release/bioc/html/Chicago.html. Accesseed 25 May 2016. 54. ArrayExpress—functional genomics data. https://www.ebi.ac.uk/
arrayexpress/. Accessed 25 May 2016.
55. Kolesnikov N, Hastings E, Keays M, Melnichuk O, Tang YA, Williams E, et al. ArrayExpress update—simplifying data submissions. Nucleic Acids Res. 2015; 43:D1113–6.
56. Analysis of Promoter Capture Hi-C data for GM12878 and mouse ES cells using the CHiCAGO pipeline. http://osf.io/nemc6. Accessed 18 May 2016. 57. NCBI Gene Expression Omnibus. http://www.ncbi.nlm.nih.gov/geo/query/
acc.cgi?acc=GSE81503. Accessed 25 May 2016.
58. WashU Epigenome Browser. http://epigenomegateway.wustl.edu. Accessed 25 May 2016.
59. Zhou X, Lowdon RF, Li D, Lawson HA, Madden PA, Costello JF, et al. Exploring long-range genome interactions using the WashU Epigenome Browser. Nat Methods. 2013;10:375–6.
60. Ernst J, Kellis M. ChromHMM: automating chromatin-state discovery and characterization. Nat Methods. 2012;9:215–6.
61. ENCODE Consortium. An integrated encyclopedia of DNA elements in the human genome. Nature. 2012;489:57–74.
62. Yue F, Cheng Y, Breschi A, Vierstra J, Wu W, Ryba T, et al. A comparative encyclopedia of DNA elements in the mouse genome. Nature. 2014;515: 355–64.
• We accept pre-submission inquiries
• Our selector tool helps you to find the most relevant journal • We provide round the clock customer support
• Convenient online submission • Thorough peer review
• Inclusion in PubMed and all major indexing services • Maximum visibility for your research
Submit your manuscript at www.biomedcentral.com/submit