JOURNAL OFCLINICALMICROBIOLOGY,
0095-1137/99/$04.0010 Apr. 1999, p. 1084–1091 Vol. 37, No. 4
Copyright © 1999, American Society for Microbiology. All Rights Reserved.
DNA Banding Pattern Polymorphism in Vancomycin-Resistant
Enterococcus faecium
and Criteria for Defining Strains
D. MORRISON,1* N. WOODFORD,1S. P. BARRETT,2P. SISSON,3ANDB. D. COOKSON1
Laboratory of Hospital Infection, Central Public Health Laboratory,1and St. Mary’s Hospital,2London, and Newcastle
Public Health Laboratory, Newcastle General Hospital, Newcastle,3United Kingdom
Received 30 June 1998/Returned for modification 21 October 1998/Accepted 26 December 1998
The degree of DNA banding pattern polymorphism exhibited by vancomycin-resistantEnterococcus faecium
(VREM) strains isolated on a renal unit over an 11-month period was investigated. Thirty VREM strains from different patients were analyzed by pulsed-field gel electrophoresis (PFGE; with extended run and optimal pulse times), ribotyping, plasmid profile analysis, biotyping, pyrolysis mass spectrometry, and antibiogram analysis. PFGE resolved 17 banding patterns which formed four distinct clusters at the 82% similarity level. Intercluster band differences ranged from 14 to 31 bands. The strains in one cluster, which contained seven patterns that differed from each other by one to seven bands and from the common pattern by five bands, were confirmed to be a single strain by four of the five other typing methods. The strains in a second cluster with eight patterns, which differed from each other by 1 to 12 bands, contained two subclusters. This subdivision was supported by ribotyping and biotyping. However, it was unclear whether these subclusters represented distinct strains. In one strain, marked polymorphism (patterns that differed from each other by up to four bands) was observed in the ribotype pattern. This study demonstrates the high degree of DNA banding pattern polymor-phism found for some strains of VREM and illustrates the complexity involved in defining such strains.
The emergence of enterococci as a major cause of nosoco-mial infection and their potential for acquiring antibiotic re-sistance has brought members of this genus, especially Entero-coccus faecium, to the forefront of hospital infection control issues. Some regard this organism as the nosocomial pathogen of the 1990s (36).
A large number of phenotypic and genotypic typing methods have been applied to epidemiological investigations ofE. fae-cium(46). Pulsed-field gel electrophoresis (PFGE), especially the contour-clamped homogeneous electric field variety, is viewed by many investigators as the “gold standard” for epi-demiological analysis of many bacteria including enterococci (11, 16, 20, 24, 41). However, the lack of standardized running conditions and criteria for interpreting the banding patterns has limited its usefulness, particularly for long-term studies and interlaboratory comparisons.
Recently, general guidelines have been proposed for inter-preting PFGE banding patterns and for defining the related-ness of bacteria isolated over periods of up to 3 months. Iso-lates with patterns that differ from the parental strain pattern, the index strain pattern, or the common pattern by three bands or less are regarded as closely related, those that differ by six bands or less are regarded as possibly related, and those that differ by greater than six bands are regarded as unrelated (41). However, because different species may vary in the degree of polymorphism that they exhibit, the European Study Group on Epidemiological Markers proposed that the degree of related-ness used to indicate working definitions of strains should be adjusted to each species studied and the typing method applied (37).
The present study aimed to establish the degree of DNA banding pattern polymorphism exhibited by strains of vanco-mycin-resistantE. faecium(VREM) and to determine the level
of similarity that should be applied to define “biologically plau-sible” strains.
MATERIALS AND METHODS
Bacterial isolates.The 30 VREM isolates studied were isolated from clinical specimens from different patients on the renal facility of a single hospital over a period of 11 months. Seventeen were from urine, four were from intravenous devices, two were from wounds, two were from blood, and one was from peri-toneal dialysis fluid; the sources of four isolates were not known. A single colony from a culture of each specimen was selected and stored in 16% glycerol broth at270°C until tested. The unit involved was extremely busy and was situated in a hospital with the highest bed occupancy rate of any teaching institution in London, United Kingdom. It served acute renal medicine, peritoneal dialysis, hemodialysis, and posttransplantation patients. Patients underwent repeated re-admission to any of the four locations within the hospital where renal treatment was provided, including readmission for frequent hemodialysis. The pressure of the workload resulted in patients being subjected to repeated changes of within-ward bed position. Medical records were stored in numerous locations, and pathology reports were not routinely filed. A shortage of infection control per-sonnel coupled with the dispersed nature of record keeping rendered a detailed epidemiological study impossible.
Species identification and biotyping.The isolates were identified to the species level by a microtiter tray-based method supplemented with motility and pigment production tests (21). The isolates were also tested with the Rapid ID 32 Strep kit according to the manufacturer’s instructions (bioMerieux, Marcy-l’Etoile, France).
PFGE.PFGE typing ofSmaI-digested DNA was performed by a modification of a previously described method (24). Cell suspensions of approximately 23109 cells/ml were mixed with an equal volume of 1.6% low-melting-point agarose at 50°C. The cell-agarose suspension was pipetted into a block mold (6 by 20 by 1 mm) and was allowed to solidify at 4°C. The cells were lysed at 37°C overnight with gentle shaking in lysis buffer (1 mg of lysozyme per ml, 25mg of RNase per ml, 6 mM Trizma base, 100 mM EDTA, 1 M NaCl, 0.5% Brij 58, 0.2% sodium deoxycholate, 0.5% lauroylsarcosine, and 1 mM MgCl), followed by a further overnight incubation at 50°C in proteolysis buffer (100mg of proteinase K per ml and 1% lauroylsarcosine in 0.5 M EDTA). The blocks were washed three times for 10 min of each time at 4°C in TE buffer (10 mM Trizma base, 1 mM EDTA) and were stored at 4°C.
Half of an agarose block was equilibrated in restriction enzyme buffer for 30 min and was digested with 40 U ofSmaI for 2 to 4 h according to the manufac-turer’s instructions. The blocks were washed in TE buffer for 60 min at 37°C and were stored at 4°C. The blocks were cut to the well size and were loaded into the wells of a 1.2% agarose gel (gel size, 25 cm [width] by 20 cm [length]). Electro-phoresis was performed in 0.53TBE buffer (44.5 mM Trizma base, 44.5 mM boric acid, 1 mM EDTA) by the contour-clamped homogeneous electric field method with a CHEF-DRII drive module (Bio-Rad Laboratories Ltd., Hemel * Corresponding author. Present address: Scottish MRSA
Refer-ence Laboratory, Bacteriology Department, Royal Infirmary, Glasgow G4 0SF, United Kingdom. Phone: (0)141-211-4647. Fax: (0)141-552-1524. E-mail: [email protected].
1084
on May 15, 2020 by guest
http://jcm.asm.org/
Hempstead, United Kingdom). To achieve optimal separation of the fragments, SmaI-digested DNA was electrophoresed in two separate gels (run time, 40 h) under two different linear ramped pulse times: 1 to 10 and 10 to 40 s for the separation of fragments below and above 145 kb, respectively. The gels were stained with ethidium bromide (1mg/ml) for 40 to 60 min and were photo-graphed.
Stability of PFGE banding patterns.To assess the stability of the PFGE banding patterns, a single colony of one of the isolates was streaked onto a blood agar plate and the plate was incubated at 37°C overnight. A single colony from this plate that had been incubated overnight was then streaked onto a second plate. This was repeated 45 times. On the third subculture a small colonial variant was observed. Subsequently, subcultures of the parent and the small colonial variant were carried out separately. The first and every fifth subsequent subculture were stored in 16% glycerol broth at270°C until they were tested.
Antibiograms and plasmid profile analysis.The susceptibilities of the isolates to vancomycin, teicoplanin, chloramphenicol, ciprofloxacin, erythromycin, tetra-cycline, trimethoprim, and rifampin were determined by an agar incorporation method (44). In addition, high-level resistance to gentamicin (MIC,.2,000 mg/liter), streptomycin (MIC,.2,000 mg/liter), and penicillin (MIC,.100 mg/ liter) was tested for by using breakpoint concentrations. Resistance was defined as described by Woodford et al. (48). Plasmid content was determined by an alkaline lysis method as described previously (44).
Ribotyping. Genomic DNA was extracted by the guanidium thiocyanate method of Pitcher et al. (30) and was digested withBamHI (Gibco BRL, Ux-bridge, United Kingdom). The DNA was probed with biotinylated cDNA of the
16S and 23S rRNAs of the type strain (NCTC 775) ofEnterococcus faecalisas described previously (47).
PyMS.Twenty-two isolates, including representative isolates with each PFGE banding pattern, were compared by pyrolysis mass spectrometry (PyMS) and were analyzed as described previously (7, 8, 33).
Analysis of DNA banding patterns.The DNA banding patterns were analyzed by visual examination, and all loci were scored for the presence or absence of a band. The percent similarity of the banding patterns was estimated with the Dice coefficient (6), and the matrix of similarity coefficients was clustered by the unweighted pair group method with mathematical averages algorithm (34) with multivariate statistical package (Kovach WI. 1993, version 2.1; Kovach Comput-ing Services, Pentraeth, Wales, United KComput-ingdom).
RESULTS
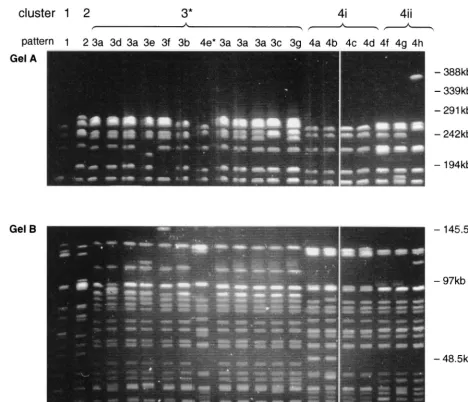
PFGE typing. The 30 E. faecium isolates had 17 banding
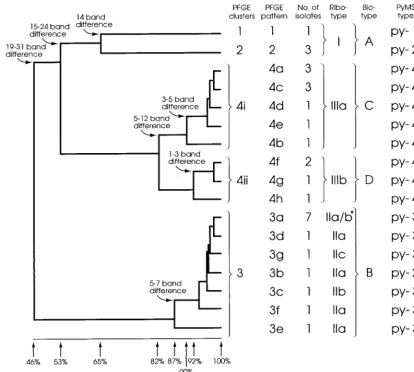
[image:2.612.71.539.72.474.2]patterns by PFGE, and 19 to 23 (average 21) bands were distinguished per isolate (Fig. 1). Only one isolate gave bands above 291 kb. Cluster analysis revealed four distinct clusters (clusters 1 to 4) at the 82% similarity level, and intercluster band variation ranged from 14 to 31 bands (Fig. 2). The seven patterns in cluster 3 differed from each other by up to seven FIG. 1. PFGE ofSmaI-digested DNA from VREM showing representative pattern of all 17 patterns that were resolved. (Gel A) Linear ramped pulse time of 10 to 40 s with a run time of 40 h. Only well-separated bands above 145 kb are shown. (Gel B) Linear ramped pulse time of 1 to 10 s with a run time of 40 h. Only well-separated bands below 145 kb are shown. *, pattern 4e is included among the cluster 3 patterns on this gel.
on May 15, 2020 by guest
http://jcm.asm.org/
bands and differed from the common pattern in this cluster (pulsed-field type 3a [PF3a]) by five bands. Cluster 4 contained eight patterns which differed from each other by up to 12 bands. No single common pattern was observed. Interestingly, the patterns could be subdivided into two closely related sub-clusters (subsub-clusters 4i and 4ii) which formed at similarity levels of 90 and 92%, respectively (Fig. 2). The patterns within each subcluster differed from each other by one to five and one to three bands, respectively. These subclusters were also ob-served when the banding pattern data were analyzed with sev-eral other similarity coefficients (Jacaard, Yule, and Simple Matching [35]) and clustering algorithms (nearest neighbor, furthest neighbor, and weighted pair group [34]) and when the data were analyzed in different sequences.
Stability of PFGE banding patterns. No differences were
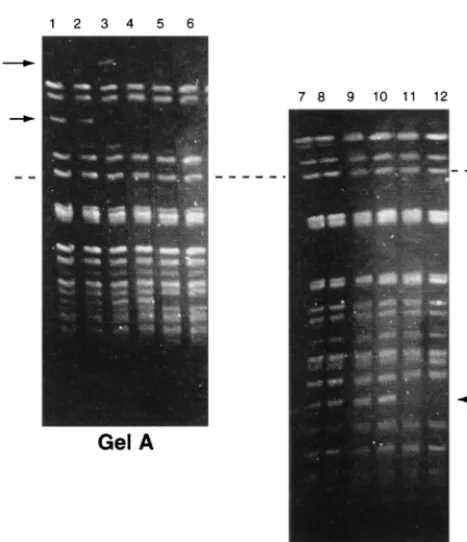
observed between the banding patterns of different subcultures of the parent colony, even though after the 40th subculture it became susceptible to vancomycin (data not shown). Single colonies of the small colonial variant always produced banding patterns that were a mixture of those of both parent and small colonies on subculture. On the fifth subculture, the banding pattern varied at two loci; one with a missing band (194 to
242.5kb) and one with a new band (242.5 to 291 kb) (Fig. 3, arrows). The latter band was not observed on subsequent sub-culture. On the 15th subculture, another band (approximately 48.5 kb) disappeared (Fig. 3, arrows). PFGE of a Sma I-di-gested plasmid preparation showed that the latter band was a plasmid (Fig. 4, arrow). No further changes were observed.
Ribotyping.Ribotyping resolved 10 to 11 fragments per
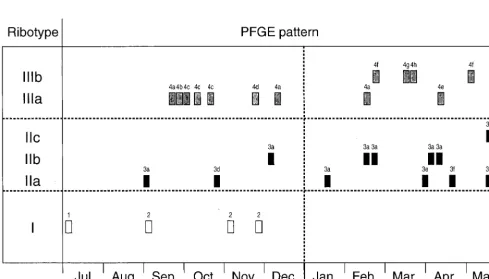
[image:3.612.95.509.76.448.2]iso-late and divided the 30E. faeciumisolates into six groups with distinct banding patterns which formed three clusters; ri-botypes I, II and III (Fig. 5). Intercluster banding patterns varied by 4 to 13 bands. Ribotype I corresponded to PFGE clusters 1 and 2. The ribotype II cluster contained three similar patterns (subtypes IIa, IIb, and IIc) and corresponded to PFGE cluster 3. Ribotypes IIa and IIb and ribotypes IIb and IIc each differed by two bands, and ribotypes IIa and IIc dif-fered by four bands (Fig. 5, and arrows). Ribotypes IIb and IIc appeared 3 and 8 months, respectively, after the first isolation of ribotype IIa (Fig. 6). Several isolates of ribotypes IIa and IIb had identical PFGE banding patterns, and the PFGE pattern for the single ribotype IIc isolate differed from this PFGE pattern by only one band. These isolates were also identical by biotyping. It seemed appropriate, therefore, to regard these FIG. 2. Dendrogram produced following Dice and UPGMA analysis of the PFGE patterns ofSmaI-digested DNA. The percent similarities and band differences between and within clusters are shown. The corresponding ribotype, biotype, and PyMS type of each isolate are also included. *, two of the PFGE pattern 3a isolates were ribotype IIa and five were ribotype IIb; #, one of the PFGE pattern 4f isolates was PyMS type py-4 and the other was PyMS type py-5.
1086 MORRISON ET AL. J. CLIN. MICROBIOL.
on May 15, 2020 by guest
http://jcm.asm.org/
three patterns as subtypes of ribotype II, despite the relatively large band differences between them. The two patterns of ribotype III (subtypes IIIa and IIIb) differed from each other by a single band (Fig. 5, arrows) and corresponded to PFGE cluster 4. Interestingly, ribotypes IIIa and IIIb correlated ex-actly with PFGE subclusters 4i and 4ii, respectively (Fig. 2). The polymorphism observed within both ribotypes II and III was progressive with time (Fig. 6).
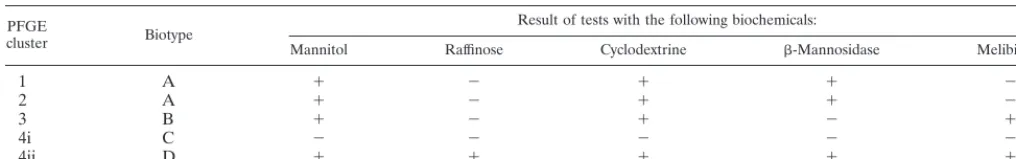
Biotyping.All isolates gave identical results in the majority
of biochemical reactions tested. However, variation was ob-served in five tests (mannitol, raffinose, cyclodextrine,b -man-nosidase, and melibiose), and four biotypes that differed from each other by the results of at least two of the tests were distinguished (Table 1). The clusters identified by biotyping correlated well with the PFGE clusters but failed to distinguish isolates within clusters 1 and 2. Biotyping did, however, clearly distinguish subclusters 4i and 4ii, with differences observed by all five tests (Fig. 2).
PyMS. With the exception of two isolates, PyMS
distin-guished, at the 95% confidence limits, four groups that corre-sponded to PFGE clusters 1 to 4 (Fig. 2). The exceptions were a PFGE cluster 3 isolate that appeared to have greater simi-larity to isolates of PFGE cluster 2 and a PFGE subcluster 4ii isolate which was distinct from all the other isolates.
Plasmid profiles.Twenty-one distinct plasmid profiles were
found among the 30 isolates, with each isolate containing be-tween four and nine plasmids. Four clusters corresponding to PFGE clusters 1 to 4 were distinguished (data not shown). Two clusters corresponding to PFGE clusters 3 and 4 grouped at low similarity levels (59 and 61% respectively) as a result of the
extensive variation in the profiles within these clusters. For example, the 13 isolates of PFGE cluster 3 and the 7 isolates of PFGE subcluster 4i were each divided into seven unique plas-mid profiles that differed from each other by up to five and six plasmids, respectively.
Antibiograms.All isolates were resistant to 7 of the 12
an-tibiotics tested (vancomycin, teicoplanin, ampicillin, cipro-floxacin, erythromycin, rifampin, and trimethoprim), and all except 1 of the isolates were resistant to high levels of penicil-lin. The majority of the isolates were also resistant to chlor-amphenicol, tetracycline, and high levels of gentamicin and streptomycin. Although nine unique antibiograms were ob-served, there was little correlation between these antibiograms and the groupings obtained by the other typing methods; the same antibiogram was observed for isolates in more than one PFGE cluster, and isolates of a single PFGE subtype (subtype 3a) were subdivided into four groups according to their anti-biograms.
DISCUSSION
[image:4.612.58.292.67.338.2]PFGE remains the method of choice for epidemiological typing of E. faecium. It is more discriminatory than other methods, all isolates are typeable, and good reproducibility is obtained (16, 20, 22). However, the level of polymorphism acceptable in isolates of the same strain is still an open ques-tion, as is also the case for many other species. Pennington (28) compared this question with the equally controversial issue of FIG. 3. PFGE banding patterns of the small colonial variant of an isolate of
[image:4.612.359.506.72.377.2]VREM following 20 serial single colony subcultures. (Gel A) Linear ramped pulse time of 10 to 40 s with a run time of 40 h. (Gel B) Linear ramped pulse time of 1 to 10 s with a run time of 40 h. Lanes 1 and 7, original culture; lanes 2 and 8, 1st subculture; lanes 3 and 9, 5th subculture; lanes 4 and 10, 10th subculture; lanes 5 and 11, 15th subculture; lanes 6 and 12, 20th subculture. Arrows, bands which appeared and/or disappeared during subculture; dashed line, the positions of the same band on both gels.
FIG. 4. PFGE of total DNA and plasmid preparation by using ramped pulse times of 1 to 10 s for 30 h followed by 10 to 30 s for 15 h. Lanes 1 to 3, isolate with PFGE pattern 4a; lanes 4 to 6, isolate with PFGE pattern 4c; lanes 1 and 4, undigested plasmid preparation; lanes 2 and 5, plasmid preparation digested with SmaI; lanes 3 and 6, total DNA digested withSmaI. Arrow, plasmid band.
on May 15, 2020 by guest
http://jcm.asm.org/
the definition of a species and concluded that the definition of strains involves considerable uncertainty and requires a sizable judgmental element. This subjective element is also acknowl-edged in the recently proposed guidelines for the interpreta-tion of PFGE patterns (41). A philosophical principle, the
consilience of induction, is suggested as the criterion for eval-uation of the naturalness of strain groupings; natural groups must be identical or very similar when tested by methods that measure independent markers (28). This was the approach adopted in this study.
PFGE resolved the 30 VREM isolates examined into four distinct clusters. PyMS and plasmid typing supported the grouping of PFGE clusters 1 and 2. The ribotypes and biotypes of the isolates in these clusters are the most frequently ob-served ribotypes and biotypes among the E. faecium strains referred to our laboratory (20a) and hence represent a lack of discrimination by these methods rather than the identities of isolates in clusters 1 and 2. Isolates of PFGE cluster 3, al-though clearly distinct from those of the other clusters, differed from each other by a relatively large number of bands (one to seven bands). The guidelines for the interpretation of PFGE patterns presuppose that band differences are calculated with references to the commonest strain, the index strain, or the parental strain pattern (41), which has also been referred to as the “modal” band difference (43). PFGE cluster 3 patterns differed from the common pattern (PF3a) by up to five bands, which falls outside the criteria (three band differences) pro-posed for the identification of closely related isolates. These isolates were, however, grouped together by ribotyping, bio-typing, PyMS (except for two isolates), and plasmid bio-typing, which, together with the geographical and temporal related-ness of these isolates, indicated that they represented a single strain. Such large intrastrain band differences have been re-ported for other species. Differences of six bands were found for ab-lactamase-producing strain ofE. faecalisisolated over a 7-year period (32) and a strain ofPseudomonas aeruginosa
isolated over a 3-year period (12).
[image:5.612.59.292.72.300.2]The strain-defining criteria proposed in the guidelines were FIG. 5. Ribotyping patterns of the VREM strains. Arrowheads, alteration in
bands responsible for the subtypes (a, b, and c) of ribotype II and the subtypes (a and b) of ribotype III.
FIG. 6. Time chart showing the date when each of the 30 VREM isolates was isolated on the renal unit and the corresponding ribotype and PFGE pattern for each strain.
1088 MORRISON ET AL. J. CLIN. MICROBIOL.
on May 15, 2020 by guest
http://jcm.asm.org/
[image:5.612.58.548.428.707.2]specifically devised to cover studies that span periods of less than 3 months. This study, which covered 11 months, suggests that in outbreaks that cover extended periods a three-band-difference rule for the definition of strains ofE. faeciumshould not be followed rigidly. The guidelines themselves allow dif-ferences of up to six bands (two genetic events) if there is good epidemiological evidence to suggest the relatedness of the iso-lates (41).
The criteria used to define strains by ribotyping and other DNA typing methods, such as plasmid typing and randomly amplified polymorphic DNA analysis with PCR, are much more problematic, and guidelines have not yet been proposed (40). In the majority of ribotyping and other probe-based typ-ing studies, it is arbitrarily assumed that strains with patterns that differ by even a single band represent genetically and epidemiologically unrelated strains (11, 23, 47). In some ri-botyping studies one (1) or two (18, 26, 27, 29) band differences have been allowed for isolates considered to be the same strain. In this study the data indicated thatE. faeciumisolates which differed in their ribotype patterns by up to four bands represented a single strain.
The conclusion regarding the strain boundaries of the PFGE cluster 4 isolates is not clear and illustrates the judgmental element alluded to by Pennington (28). Patterns within this cluster differed by a large number of bands; 12 bands if all patterns are considered and 9 bands if only a common pattern is considered. However, the cluster formed at a similarity level (82%) which falls within the strain boundary levels reported for other species (3, 23, 38, 39). If isolates of the same strain may differ by two genetic events (6 band differences) within a 3-month period (41), then within an 11-month period, two further genetic events could have occurred, resulting in up to 12 band differences, as observed in this cluster. There is, how-ever, evidence which suggests that the PFGE cluster 4 isolates may represent two distinct strains. Dendrograms generated with a variety of similarity coefficients and clustering algo-rithms all divided this cluster into two subclusters. Further-more, the biotyping data and the ribotype subtypes correlated exactly with the PFGE subclusters. It is difficult to judge the weight which should be given to the latter typing data results since the ribotype subtypes differed by only one band and large changes in biotype may occur following a single genetic event, such as the introduction of a transposon (5). The strain desig-nations of these isolates, therefore, remained unresolved. For practical infection control purposes, it may be argued that it is preferable to consider isolates which may be unrelated as the outbreak strain rather than risk missing a source of cross-infection (9).
In contrast to findings of the present study, Bonten et al. (2) reported that the differences in the PFGE patterns of related and unrelated strains of E. faecium was clear-cut. Related isolates differed by 4 bands or fewer while unrelated isolates differed by 10 or more bands. This has also been reported for
P. aeruginosaby Hla et al. (15), who found that related and unrelated isolates were clearly distinguished by both band dif-ferences and percent similarities of banding patterns. The small intrastrain variation in PFGE patterns observed by Bonten et al. (2) forE. faeciumand by Hla et al. (15) forP. aeruginosacompared with the large variation reported in this study may reflect differences in the fluidities of the genomes of the strains studied. However, since Bonten et al. (2) and Hla et al. (15) observed this in a number of different strains, another possible explanation is that the electrophoretic conditions adopted in those studies did not allow resolution of all the differences that were present. The electrophoresis run times in those studies were half those used in the present study.
Although the frequencies of occurrence of the genetic events that modify banding patterns are unknown, we have observed two independent genetic events after 45 in vitro serial subcultures, one of which resulted in the loss of a plasmid. The changes observed in vitro suggest that we may expect greater polymorphism in the genomes of isolates recovered from their natural habitats, in which interaction and competition with other organisms of the same or different species and genera may occur. Banding pattern polymorphism is commonly attrib-uted to either mutations affecting a restriction enzyme target site (three-band difference) or DNA rearrangements involving deletions or insertions (two-band difference) (14, 41). To this should be added the loss or gain of plasmids (one-band differ-ence), as demonstrated forE. faeciumin this study and has also been demonstrated forE. faecalis(32). DNA banding pattern polymorphisms due to insertion sequences (25), transposons (4, 42), and phages (19, 31) have been reported. In contrast, it is also apparent that epidemiologically relevant changes, such as the loss of resistance to vancomycin observed during serial subculture in this study, may not be reflected in the DNA banding pattern. In the course of an outbreak, Woodford et al. (45) found VREM strains with identical PFGE patterns but different plasmid profiles and van genotypes.
[image:6.612.53.561.85.164.2]Prior to the publication of the guidelines for PFGE typing (41), there had been little consensus regarding strain defini-tion, even for strains within the same species. For instance, Talon et al. (39) proposed a nine-band-difference rule forP. aeruginosa, Grothues et al. (12) and Struelens et al. (38) pro-posed a six-band-difference rule, and Grundmann et al. (13) proposed a three-band-difference rule. This may, in part, be due to a lack of standardization in the description of band pattern differences. Some workers (38, 41) count the total number of band differences and take into account differences at every band locus (as adopted in this study), while others count band shifts (9) and, hence, will report smaller numbers of band differences. Inconsistency also arises when the band difference obtained by the comparison of all subtypes (42) rather than the modal band difference (43) is reported. The latter approach, as proposed in the guidelines (41) and reem-phasized recently (10), gives a better representation of the
TABLE 1. Biotypes and corresponding PFGE clusters of VREM
PFGE
cluster Biotype
Result of tests with the following biochemicals:
Mannitol Raffinose Cyclodextrine b-Mannosidase Melibiosea
1 A 1 2 1 1 2
2 A 1 2 1 1 2
3 B 1 2 1 2 1
4i C 2 2 2 2 2
4ii D 1 1 1 1 1
aOne isolate each in clusters 3 and 4i gave a result opposite of the indicated result.
on May 15, 2020 by guest
http://jcm.asm.org/
relatedness of isolates. Isolates derived from the modal pattern by a single but independent genetic event (two- to three-band difference) will differ from each other by two genetic events (four- to six-band difference). In this study, the modal band difference within PFGE clusters 3 and 4 was 5 and 8 or 9 bands, respectively, compared with absolute differences of 7 and 12 bands, respectively.
The usefulness of plasmid typing and antibiogram analysis for long-term epidemiological studies appears to be limited. In this study the groupings obtained according to the different antibiograms did not correlate with any of the groupings ob-tained by the other typing methods that were used, and al-though plasmid typing supported the clusters obtained by the other typing methods, there was a high degree of variation within each cluster. There is no consensus in the literature on the usefulness of these two methods for the epidemiological typing of enterococci (17).
In conclusion, we have demonstrated a large degree of DNA banding pattern polymorphism within strains of VREM and have confirmed that isolates belonging to a single strain may differ from each other by four bands by ribotyping and by seven bands by PFGE typing.
REFERENCES
1.Arpin, C., C. Coze, A. M. Rogues, J. P. Gachie, C. Bebear, and C. Quentin.
1996. Epidemiological study of an outbreak due to multidrug-resistant En-terobacter aerogenesin a medical intensive care unit. J. Clin. Microbiol.
34:2163–2169.
2.Bonten, M. J. M., M. K. Hayden, C. Nathan, T. W. Rice, and R. A. Weinstein.
1998. Stability of vancomycin-resistant enterococcal genotypes isolated from long-term-colonized patients. J. Infect. Dis.177:378–382.
3.Chetoui, H., P. Melin, M. J. Struelens, E. Delhalle, M. Mutro Nigro, R. de Ryck, and P. de Mol.1997. Comparison of biotyping, ribotyping, and pulsed-field gel electrophoresis for investigation of a common-source outbreak of Burkholderia pickettiibacteremia. J. Clin. Microbiol.35:1398–1403. 4.Chow, J. W., M. B. Perri, L. A. Thal, and M. J. Zervos.1993. Mobilization of
the penicillinase gene inEnterococcus faecalis. Antimicrob. Agents Che-mother.37:1187–1189.
5.Clermont, D., F. Delbos, G. de Cespedes and T. Horaud.1995. Old and new (Tn3708) mobile chromosomal elements in streptococci and enterococci, p. 55–61.InJ. J. Ferretti, M. S. Gilmore, T. R. Klaenhammer, and F. Brown (ed.), Genetics of streptococci, enterococci and lactococci. Krager, Basel, Switzerland.
6.Dice, L. R.1945. Measures of the amount of ecological association between species. Ecology26:297–302.
7.Freeman, R., M. Goodfellow, F. K. Gould, S. J. Hudson, and N. E. Lightfoot.
1990. Pyrolysis mass spectrometry (Py-MS) for the rapid epidemiological typing of clinically significant bacterial pathogens. J. Med. Microbiol.32:
283–286.
8.Freeman, R., F. K. Gould, D. W. Ryan, J. Chamberlain, and P. R. Sisson.
1994. Nosocomial infection due to enterococci attributed to a fluidised mi-crosphere bed. The value of pyrolysis mass spectrometry. J. Hosp. Infect.
27:187–193.
9.Goering, R. V.1993. Molecular epidemiology of nosocomial infection: anal-ysis of chromosomal restriction fragment patterns by pulsed-field gel elec-trophoresis. Infect. Control Hosp. Epidemiol.14:595–600.
10.Goering, R. V., and F. C. Tenover.1997. Epidemiological interpretation of chromosomal macrorestriction fragment patterns analyzed by pulsed-field gel electrophoresis. J. Clin. Microbiol.35:2432–2433.
11.Gordillo, M. E., K. V. Singh, and B. E. Murray. 1993. Comparison of ribotyping and pulsed-field gel electrophoresis for subspecies differentiation of strains ofEnterococcus faecalis. J. Clin. Microbiol.31:1570–1574. 12.Grothues, D., V. Koopman, H. von der Hardt, and B. Tummler.1988.
Genome fingerprinting ofPseudomonas aeruginosaindicates colonization of cystic fibrosis siblings with closely related strains. J. Clin. Microbiol.26:1973– 1977.
13.Grundmann, H., C. Schneider, D. Hartung, F. D. Daschner, and T. L. Pitt.
1995. Discriminatory power of three DNA-based typing techniques for Pseudomonas aeruginosa. J. Clin. Microbiol.33:528–534.
14.Hall, L. M.1994. Are point mutations or DNA rearrangements responsible for the restriction fragment length polymorphisms that are used to type bacteria? Microbiology140:197–204.
15.Hla, S. W., K. P. Hui, W. C. Tan, and B. Ho.1996. Genome macrorestriction analysis of sequentialPseudomonas aeruginosaisolates from bronchiectasis patients without cystic fibrosis. J. Clin. Microbiol.34:575–578.
16.Kuhn, I., L. G. Burman, S. Haeggman, K. Tullus, and B. E. Murray.1995. Biochemical fingerprinting compared with ribotyping and pulsed-field gel
electrophoresis of DNA for epidemiological typing of enterococci. J. Clin. Microbiol.33:2812–2817.
17. Lavery, A., A. S. Rossney, D. Morrison, A. Power, and C. T. Keane.1997. Incidence and detection of multidrug-resistant enterococci. J. Med. Micro-biol.46:1–7.
18. Lew, A. E., and P. M. Desmarchelier.1997. Molecular typing of Pseudomo-nas pseudomallei: restriction fragment length polymorphisms of rRNA genes. J. Clin. Microbiol.31:533–539.
19. Lina, B., M. Bes, F. Vandenesch, T. Greenland, J. Etienne, and J. Fleurette.
1993. Role of bacteriophages in genomic variability of related coagulase-negative staphylococci. FEMS Microbiol. Lett.109:273–278.
20. Miranda, A. G., K. V. Singh, and B. E. Murray.1991. DNA fingerprinting of Enterococcus faeciumby pulsed-field gel electrophoresis may be a useful epidemiologic tool. J. Clin. Microbiol.29:2752–2757.
20a.Morrison, D.Unpublished observations.
21. Morrison, D., N. Woodford, and B. D. Cookson.1997. Enterococci as emerg-ing pathogens of humans. J. Appl. Microbiol.83:89S–99S.
22.Morrison, D., N. Woodford, M. Solaun, U. Riley, G. Bignardi, L. Goldberg, B. D. Cookson, and A. P. Johnson.1994. The use of pulsed-field gel elec-trophoresis and ribotyping to study the epidemiology of a cluster of multi-resistantEnterococcus faeciumcausing infection on a renal unit, abstr. PA31. InAbstracts of the Third International Meeting on Bacterial Epidemiolog-ical Markers, Cambridge, United Kingdom.
23.Morvan, A., S. Aubert, C. Godard, and N. El Solh.1997. Contribution of a typing method based on IS256probing ofSmaI-digested cellular DNA to discrimination of European phage type 77 methicillin-resistant Staphylococ-cus aureusstrains. J. Clin. Microbiol.35:1415–1423.
24.Murray, B. E., K. V. Singh, J. D. Heath, B. R. Sharma, and G. M. Weinstock.
1990. Comparison of genomic DNAs of different enterococcal isolates using restriction endonucleases with infrequent recognition sites. J. Clin. Micro-biol.28:2059–2063. (Erratum,29:418, 1991.)
25. Naas, T., M. Blot, W. M. Fitch, and W. Arber.1995. Dynamics of IS-related genetic rearrangements in restingEscherichia coliK-12. Mol. Biol. Evol.
212:198–207.
26. Owen, R. J., G. D. Bell, M. Desai, M. Moreno, P. W. Gant, P. H. Jones, and D. Linton.1993. Biotype and molecular fingerprints of metronidazole-resis-tant strains ofHelicobacter pylorifrom antral gastric mucosa. J. Med. Micro-biol.38:6–12.
27. Owen, R. J., C. Hunton, J. Bickley, M. Moreno, and D. Linton.1992. Ribo-somal RNA gene restriction patterns ofHelicobacter pylori: analysis and appraisal ofHaeIII digests as a molecular typing system. Epidemiol. Infect.
109:35–47.
28. Pennington, T. H.1994. Molecular systematics and traditional medical mi-crobiologists—problems and solutions. J. Med. Microbiol.41:371–373. 29. Pitcher, D. G., A. P. Johnson, F. Allerberger, N. Woodford, and R. C. George.
1990. An investigation of nosocomial infection with Corynebacterium jeikeiumin surgical patients using a ribosomal ribonucleic acid gene probe. Eur. J. Clin. Microbiol. Infect. Dis.9:643–648.
30. Pitcher, D. G., N. A. Saunders, and R. J. Owen.1989. Rapid extraction of bacterial genomic DNA with guanidium thiocyanate. Lett. Appl. Microbiol.
8:151–156.
31. Reith, S., R. R. Marples, and B. Cookson.1994. The epidemiology and evolution in typing characteristics of a new epidemic methicillin-resistant Staphylococcus aureus(EMRSA-16), abstr. PA32.InAbstracts of the Third International Meeting on Bacterial Epidemiological Markers, Cambridge, United Kingdom.
32. Seetulsingh, P. S., J. F. Tomayko, P. E. Coudron, S. M. Markowitz, C. Skinner, K. V. Singh, and B. E. Murray.1996. Chromosomal DNA restric-tion endonuclease digesrestric-tion patterns ofb-lactamase-producingEnterococcus faecalisisolates collected from a single hospital over a 7-year period. J. Clin. Microbiol.34:1892–1896.
33. Sisson, P. R., R. Freeman, and N. E. Lightfoot.1992. Pyrolysis mass spec-trometry of microorganisms. PHLS Microbiol. Digest9:65–68.
34. Sneath, P. H. A., and R. R. Sokal.1973. The estimation of taxonomic resemblance, p. 114–187.InNumerical taxonomy. W. H. Freeman & Co., San Francisco, Calif.
35. Sneath, P. H. A., and R. R. Sokal.1973. Taxonomic structure, p. 188–308.In Numerical taxonomy. W. H. Freeman & Co., San Francisco, Calif. 36. Spera, R. V., Jr., and B. F. Farber.1992. Multiply-resistantEnterococcus
faecium. The nosocomial pathogen of the 1990s. JAMA268:2563–2564. 37. Struelens, M. J., and Members of the European Study Group on
Epidemi-ological Markers (ESGEM) of the European Society of Clinical Microbiol-ogy and Infectious Diseases (ESCMID). 1996. Consensus guidelines for appropriate use and evaluation of microbial epidemiologic typing systems. Clin. Microbiol. Infect.2:2–11.
38. Struelens, M. J., V. Schwam, A. Deplano, and D. Baran.1993. Genome macrorestriction analysis of diversity and variability ofPseudomonas aerugi-nosastrains infecting cystic fibrosis patients. J. Clin. Microbiol.31:2320– 2326.
39. Talon, D., M. Cailleaux, M. Thouverez, and Y. Michel-Briand.1996. Dis-criminatory power and usefulness of pulsed-field gel electrophoresis in
epi-1090 MORRISON ET AL. J. CLIN. MICROBIOL.
on May 15, 2020 by guest
http://jcm.asm.org/
demiological studies ofPseudomonas aeruginosa. J. Hosp. Infect.32:135–145. 40.Tenover, F. C., R. D. Arbeit, and R. V. Goering.1997. How to select and interpret molecular strain typing methods for epidemiological studies of bacterial infections: a review for healthcare epidemiologists. Infect. Control Hosp. Epidemiol.18:426–439.
41.Tenover, F. C., R. D. Arbeit, R. V. Goering, P. A. Mickelsen, B. E. Murray, D. P. Persing, and B. Swaminathan.1995. Interpreting chromosomal DNA restriction patterns produced by pulsed-field gel electrophoresis: criteria for bacterial strain typing. J. Clin. Microbiol.33:2233–2239.
42. Thal, L. A., J. Silverman, S. Donabedian, and M. J. Zervos.1997. The effect of Tn916 insertions on contour-clamped homogeneous electrophoresis pat-terns ofEnterococcus faecalis. J. Clin. Microbiol.35:969–972.
43. Tomayko, J. F., and B. E. Murray.1995. Analysis ofEnterococcus faecalis isolates from intercontinental sources by multilocus enzyme electrophoresis and pulsed-field gel electrophoresis. J. Clin. Microbiol.33:2903–2907. 44. Uttley, A. H., R. C. George, J. Naidoo, N. Woodford, A. P. Johnson, C. H.
Collins, D. Morrison, A. J. Gilfillan, L. E. Fitch, and J. Heptonstall.1989. High-level vancomycin-resistant enterococci causing hospital infections. Epi-demiol. Infect.103:173–181.
45. Woodford, N., P. R. Chadwick, D. Morrison, and B. D. Cookson.1997. Strains of glycopeptide-resistantEnterococcus faeciumcan alter theirvan genotypes during an outbreak. J. Clin. Microbiol.35:2966–2968.
46. Woodford, N., A. P. Johnson, D. Morrison, and D. C. E. Speller.1995. Current perspectives of glycopeptide resistance. Clin. Microbiol. Rev.8:585– 615.
47. Woodford, N., D. Morrison, A. P. Johnson, V. Briant, R. C. George, and B. Cookson.1993. Application of DNA probes for rRNA andvanA genes to investigation of a nosocomial cluster of vancomycin-resistant enterococci. J. Clin. Microbiol.31:653–658.
48. Woodford, N., D. Morrison, A. P. Johnson, and R. C. George.1993. Anti-microbial resistance amongst enterococci isolated in the United Kingdom: a reference laboratory perspective. J. Antimicrob. Chemother.32:344–346.