5489
PREDICTION OF BREAST CANCER RECURRENCE USING
MODIFIED KERNEL BASED DATA INTEGRATION MODEL
1ARIDA FERTI SYAFIANDINI, 2ITO WASITO, 3RATNA MUFIDAH,
4IONIA VERITAWATI, 5INDRA BUDI
1State of Polytechnic Malang, Malang, East Java,Indonesia
2, 3,5Faculty of Computer Science, Universitas Indonesia, Depok, West Java, Indonesia
4)Department of Informatics, University Pancasila, Srengseng Sawah, Jakarta, Indonesia
E-mail: 1[email protected], 2[email protected],
3[email protected],4[email protected],5[email protected]
2*)Corresponding Author
ABSTRACT
Analysis of early cancer prognosis is necessary to determine the proper treatment for each patient. Furthermore, as microarray DNA has high dimensional data it would lead to a challenging task. Several studies in high dimensionality reduction have been conducted to determine significant genes with least error in cancer classification. One of those studies implements mining process such as feature selection using parametric and non-parametric statistical tests. Other than feature selection, data integration is also believed as an optimal solution in increasing cancer classification performance. In this paper, dataset containing gene expression value and clinical parameters observed from 60 breast cancer patients is used for experiment. The experiment consists of integrating data using early kernel based data integration model with modification in its dimensionality reduction step. In the existing related research, kernel dimensionality reduction is used. In this paper, mining process using several parametric and non-parametric based statistical tests is used as the replacement of kernel dimensionality reduction. The last step in kernel based data integration is classification using Support Vector Machine (SVM). Ten-fold cross validation scheme is used in the experiment. SVM with linear kernel gives the best accuracy rate compared to other kernels.
Keywords: Recurrent Cancer, Data Integration, Kernel Method, Kernel Dimensionality, Gene Expressions
1 INTRODUCTION
Cancer is one of main non-communicable diseases (NCD) alongside with cardiovascular, chronic respiratory, and diabetes diseases. This cancer disease causes approximately 8.2 million human deaths in the world each year [12].
Analysis of early cancer prognosis is necessary to determine the proper treatment for each patient. However, cancer data analysis is challenging because multiple risk factors may influence cancer prognosis, including gene, clinical condition of patient, and cancer stage. Previous cancer studies have successfully collected an enormous amount of cancer patient data [14]. By applying machine learning techniques, these data can be used to develop prediction model for cancer prognosis. This model can be used to predict cancer
progression on patient, such as recurrence and survival of patient [13].
Most related works in disease diagnosis have used commonly patient clinical data [16]. Meanwhile for cancer diagnosis, some studies use microarray data [14] or both clinical and microarray data, considering cancer is a genetic disease [13]. Challenges in clinical and microarray data analysis are on high-dimensional data problem (particularly microarray data) compared to size of samples. Thus, the number of variables are much larger compared to the number of equations. Furthermore, data integration method is needed to combine information from clinical and microarray data which have different characteristics.
5490 there are enormous sources of patient data that have been collected in the previous researches around the world, thus researchers need to combine the data from different sources to extend the scope of study. However, there are challenges in combining some sources of patient data, such as heterogeneous of data and there is no agreement of terminology used in patient data recording. Thus, to use such heterogeneous type of data from various researches, data homogenization or harmonization is required
[15]. Spjuth et al. (2016) in [15] proposed data
harmonization method. First, variable of interest (VOI) is determined, then list of harmonized vocabulary (HV) id created, HV mapping, and information integration.
The early prognosis of recurrent cancer has become a necessity in cancer research. Furthermore, as microarray DNA has high dimensional data it would lead to a challenging task. Several studies in high dimensionality reduction have been conducted to determine significant genes with least error in cancer classification. Breast cancer cell occurrence caused by a long process of cumulative genetic changes that take place in a single breast cell before it becomes malignant. The malignant cell divides many times before a physical appearance such as lump can be seen in breast skin surface. Gene microarray technology has been introduced as an advanced technique used in molecular biology for detecting genetic changes between different biological conditions [4]. Commonly observed biological conditions are disease and normal condition. Although gene microarray technology observes a huge amount of genes, only small set of genes that actually matters in discriminating biological conditions. That small set of genes is called biomarkers. Biomarkers usually used in disease tracing.
In general, microarray data is represented as matrix. Number of columns shows number of samples and number of rows shows number of features (genes). Microarray data analysis has been widely used and improved since 1999 [8]. Microarray data analysis use in autism recognition, breast cancer prognosis, multi class cancer dataset [2-3, 8]. The main problem in microarray data analysis is imbalanced number of samples and features. Number of features can reach tens of thousands while number of samples only in hundreds. Therefore, feature (biomarker) selection remains as difficult challenge although a lot of studies have been conducted.
2 METHODOLOGY
Increased performance in discriminating biological conditions may depend on feature selection since microarray data needs dimension reduction. Several methods, such as Relief-F,
Minimal-Redundancy-Maximal Relevance
(MRMR), t-Statistic, Information Gain,
Discriminant Analysis, Randomization test have been applied separately for feature selection [3,10]. Although applying feature selection separately gives quiet remarkable accuracy in classification, it still omits other methods perspective. In that case, two steps feature selection has been proposed. First, eight feature selection methods ReliefF algorithm, two sample t-test, Kolmogorov-Smirnov test, Kruskal Wallis test, stepwise regression method, feature correlation with a class and SVM recursive feature elimination applied separately. Then, result from those methods ranked based on its position in each method and small set of genes with high purity index used as classifier input [8].
Another method used to increase performance in discriminating biological conditions is data integration. Microarray data can be integrated with another resource of microarray data or clinical parameters observed from sample. Integrating microarray data with the other microarray data from different resources used to overcome problem in limited number of samples (Soon et al, 2010). Another data integration, based on kernel approach using microarray data and clinical parameters, used to increase performance accuracy in cancer subtype classification. A dimensionality reduction kernel is computed to reduce microarray dimension or unintentionally, define the cancer biomarkers. After being reduced dimensionally, microarray data is processed using several types of kernel for classification [5].
Discriminating biological conditions refers to classification. As classifier, Support Vector Machine (SVM) and its hybrid model, for example GA-SVM, genetic algorithm based on the SVM classification technique have been used several studies related to Biomedical Informatics [1-2, 5, 8].
5491
2.1 PROPOSED FRAMEWORK
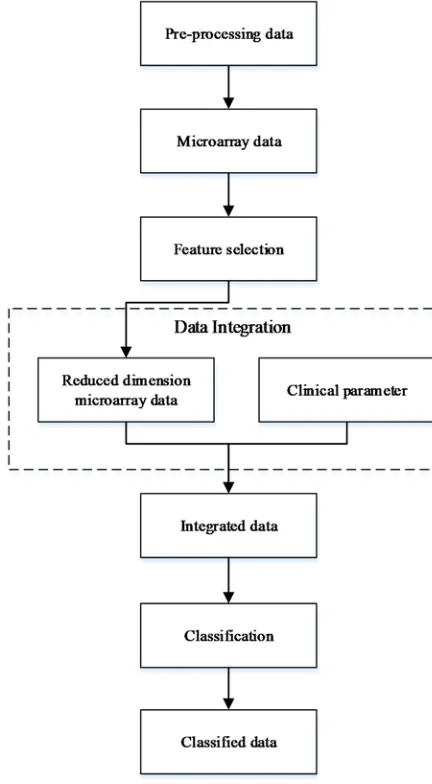
Figure 1 illustrates the proposed framework in this paper. Every steps in this proposed framework will be implemented using
MATLAB R2014a functions. Hardware
specification used is personal computer with RAM 4GB and i5 processor.
Figure 1: Proposed Framework Diagram
2.2 Feature Selection
The main goal of feature selection in this approach is identifying biomarkers for breast cancer recurrence. In addition, it also used for dimension and complexity reduction. There are two steps of feature selection proposed in this paper. The first step is feature selection using several
methods separately. There are eight methods used in this step, for instance, fisher discriminant analysis, RelieF algorithm, two sample t-test, Kolmogorov-Smirnov test, Kruskal Wallis test, stepwise regression method, feature correlation with a class and SVM recursive feature elimination [2, 8]. Then, results from separate feature selection are combined together in second step feature selection. Since each method relies on different observation value, its combination will result a better perspective in identifying biomarkers. In second step feature selection, global weight for each gene is computed using an equation below [8].
𝑤 𝑤 (1)
The index is the number of feature selection methods applied. is the number of repetitions used in running feature selection method. gene position in feature selection method and repetition. The best associated gene will have the smallest value.
Other than global weight value, number of gene occurrence in each feature selection method is also computed. Genes will be ranked based on number of occurrence, higher number of occurrence will result higher rank. After that, genes with the same number of occurrence are sorted from smallest to highest global weight.
After given global weight value, genes are clustered using k-means with k=2. The clustering process starts with two most significant genes obtained from combining feature selection method results and repeated with varying number of genes. Increase number of genes by one in each clustering process. To obtain the optimal number of biomarkers, compute the total purity index at each iteration. Total purity index is computed using the equation below [7].
𝑝𝑖 𝑚𝑎𝑥𝑛
𝑛 (2)
𝑝𝑖 𝑛
𝑛 𝑝𝑖 (3)
[image:3.612.89.305.210.602.2]5492 forming cluster. is the number of total samples being clustered. is maximum purity index. is the number of class samples inside cluster.
2.3 Data Integration
There are three models of multiple datasets integration based on kernel methods, namely, early, intermediate and late integration [5]. Figure 2 shows data integration framework using those models. Kernel Dimensionality Reduction (KDR) is used to reduce dimension of the large features, such as number of genes in microarray dataset. Kernel methods, such as linear, polynomial and Radial Basis Function (RBF) are used for mapping the original feature space into high dimensional feature space [1]. In this paper, the proposed data integration framework uses early model and feature selection as KDR replacement.
2.4 Classification
Classification in this paper is designed to group breast cancer patients into two groups, disease-free and cancer recurred. Disease-free means there is no possibility of cancer recurrence and the other group means the opposite. Classifier used in this paper is Support Vector Machine (SVM). SVM is developed by Vapnik and commonly used in biomedical informatics research [9]. SVM provides an effective pattern recognition approach using linear separating plane called hyper plane. Hyper plane used to maximize the distance
between two classes. SVM is a powerful method for binary classification [5].
2.5 DATA
[image:4.612.82.534.490.714.2]Dataset used in this paper is taken from GEO Datasets with code accession GSE1379. The dataset contains of microarray data and nine clinical parameters. Nine clinical parameters observed from patients are tumour type, size, grade, lymph node status, ER, PR, HER2 and age. Dataset contains of 60 samples taken from 60 patients with hormone receptor-positive breast cancer diagnosed at the Massachusetts General Hospital and treated with a standard breast surgery and radiation. After that, the treatment continued with five years of systemic adjuvant tamoxifen. Longest data collecting process for this dataset is 14.1 years. 32 samples are disease-free class members and 28 samples are cancer recurred class members. Microarray data for this dataset contains 22,575 genes. For pre-processing, to suppress computing complexity, genes with small variance, value and entropy will be removed. The remaining number of genes used is 12,202 genes. Afterwards, an experiment using 10 cross fold validation procedure is conducted, with ratio of training and testing data 9:1. Confusion matrices are computed in each fold to obtain the value of accuracy [6].
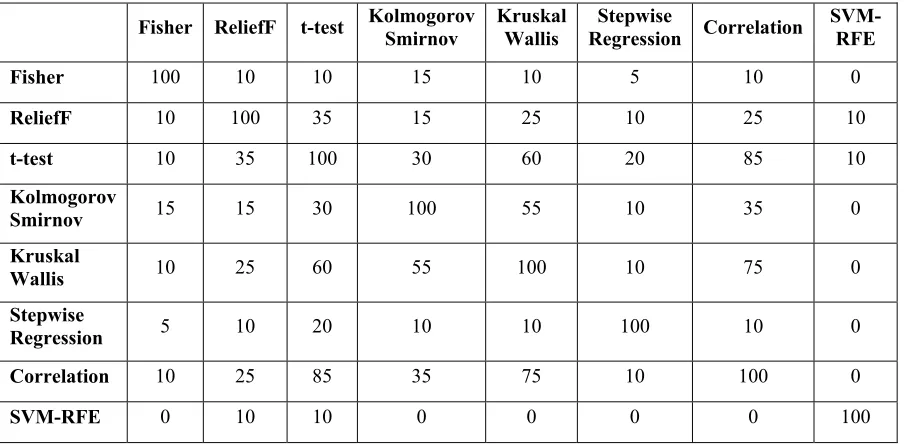
Table 1: Redundancy Rate Among Top 20 Genes Selected by Eight Different Feature Selection Methods
Fisher ReliefF t-test Kolmogorov Smirnov Kruskal Wallis Regression Stepwise Correlation SVM-RFE
Fisher 100 10 10 15 10 5 10 0
ReliefF 10 100 35 15 25 10 25 10
t-test 10 35 100 30 60 20 85 10
Kolmogorov
Smirnov 15 15 30 100 55 10 35 0
Kruskal
Wallis 10 25 60 55 100 10 75 0
Stepwise
Regression 5 10 20 10 10 100 10 0
Correlation 10 25 85 35 75 10 100 0
5493
3 EXPERIMENT AND RESULT
3.1 Feature Selection
As described before, feature selection methods have been applied to get the order of genes. Top 5, top 10 and top 20 selected genes from each method is compared and the result shows that each method results different genes. Table 1 shows the redundancy rate among top 20 genes selected by different methods in one of tenfold results.
Two sample t-test method and feature correlation with a class method have the most similar result with highest redundancy rate, 85%. Followed by Kruskal-Wallis test and feature correlation with a class with 75% redundancy rate. However, SVM-RFE gives a very different set of top 20 genes, compared to another method. It has lowest redundancy rate 0% and the highest rate is only 10% (only 2 common genes among top 20 genes).
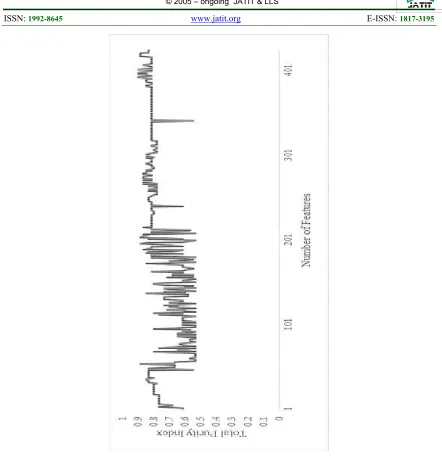
After gaining results from different feature selection methods, the next step is assigning global weight and counting the occurrence number of each gene. Global weight is computed using Equation 1. Total 139 different genes listed from top 5 selected genes, 246 different genes listed from top 10 selected genes and 424 different genes listed from top 20 selected genes. To assess the quality of selected genes, data can be clustered into multidimensional space. Clustering method used in this experiment is simple k-means with k=2. Then, total purity index is computed using Equation 3 to obtain optimum number of features and compared it with another set to prove that smaller number of features have more significant role in clustering data. Figure 3 shows the total purity index changes from top 20 genes.
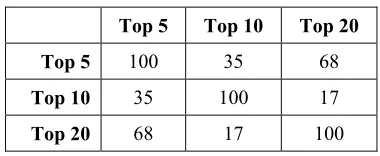
[image:5.612.322.512.121.199.2]Maximum total purity index is obtained when 392 genes from top 20 selected genes are inserted. The value of maximum total purity index is 0.9, which means 54 rows of data is correctly clustered. From top 10 selected genes, maximum total purity index is obtained from 205 genes, with value 0.93. From top 5 selected genes, maximum total purity index is obtained from 126 genes with value 0.96. It can be concluded that each top selected genes may result different purity index value and different optimum number of genes. It is caused by different genes and their order. Redundancy rates of the first 100 genes in top 5, top 10 and top 20 selected genes are shown in Table 2.
Table 2: Redundancy Rate Among The First 100 Genes from Top 5, 10 And 20 Selected Genes
Top 5 Top 10 Top 20
Top 5 100 35 68
Top 10 35 100 17
Top 20 68 17 100
3.2 Data Integration
Data integration model used in this experiment is early model. Integrated data includes microarray data with only selected genes resulted in feature selection and clinical data that has eight features (tumour type, tumour size, tumour grade, number of nodes, age and patient reaction to ER, PR and HER2). In early model, microarray data and clinical data is combined first and then mapped using kernel function. Number of genes from top 5 selected genes is 139, with additional 8 features from clinical data, combined number of features will be 147, for top 10 selected genes will be 254 features and for top 20 selected genes will be 432 features. The last step in early model is classification using SVM.
3.3 Classification
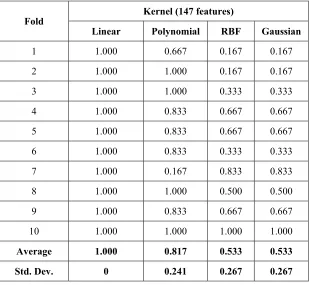
Four different kernels, linear, RBF, polynomial and Gaussian will be used in classification using SVM. The SVM model is built using 10 fold cross validation scheme. Accuracy rate obtained from each fold using linear kernel is given in Table 3.
5494
Table 3: Accuracy Rate Obtained from Integrated Data Classification Using SVM With Linear Kernel
Fold Number of Features
147 254 432 12210
1 1.000 1.000 1.000 0.500
2 1.000 1.000 1.000 0.500
3 1.000 1.000 1.000 0.500
4 1.000 1.000 1.000 0.667
5 1.000 1.000 1.000 0.333
6 1.000 1.000 0.833 0.500
7 1.000 0.833 0.833 0.667
8 1.000 1.000 1.000 1.000
9 1.000 1.000 1.000 0.667
10 1.000 1.000 1.000 0.500
Average 1.000 0.983 0.967 0.583
[image:6.612.152.461.426.711.2]Std. Dev. 0 0.050 0.067 0.171
Table 4: Accuracy Rate Obtained from Integrated Data Classification Using Svm With Different Kernels
Fold Kernel (147 features)
Linear Polynomial RBF Gaussian
1 1.000 0.667 0.167 0.167
2 1.000 1.000 0.167 0.167
3 1.000 1.000 0.333 0.333
4 1.000 0.833 0.667 0.667
5 1.000 0.833 0.667 0.667
6 1.000 0.833 0.333 0.333
7 1.000 0.167 0.833 0.833
8 1.000 1.000 0.500 0.500
9 1.000 0.833 0.667 0.667
10 1.000 1.000 1.000 1.000
Average 1.000 0.817 0.533 0.533
5495
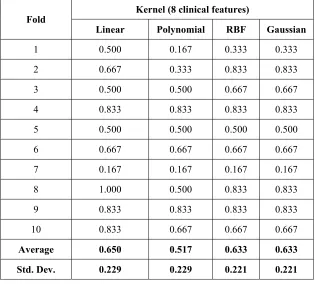
Table 5: Accuracy Rate Obtained from Classification (Eight Clinical Features) Using Svm With Different Kernels
Fold Kernel (8 clinical features)
Linear Polynomial RBF Gaussian
1 0.500 0.167 0.333 0.333
2 0.667 0.333 0.833 0.833
3 0.500 0.500 0.667 0.667
4 0.833 0.833 0.833 0.833
5 0.500 0.500 0.500 0.500
6 0.667 0.667 0.667 0.667
7 0.167 0.167 0.167 0.167
8 1.000 0.500 0.833 0.833
9 0.833 0.833 0.833 0.833
10 0.833 0.667 0.667 0.667
Average 0.650 0.517 0.633 0.633
Std. Dev. 0.229 0.229 0.221 0.221
The classification performance is
increasing only when selected significant features from microarray data are used in the experiment. In addition, while using only one feature selection method, the average accuracy rate for classification using 20 top rank features from microarray data and eight clinical data is lower than combining several feature selection methods. For example, using only fisher discriminant analysis as feature selection method, the accuracy rate is 0.700±0.233, ReliefF is 0.733±0.152, two sample t-test is 0.767±0.082, Kolmogorov Smirnov is 0.700±0.221, Kruskal Wallis is 0.717±0.198, stepwise regression is 0.900±0.110, feature correlation with class is 0.767±0.133 and SVM-RFE is 0.933±0.082. Using feature correlation with class and SVM-RFE resulting high accuracy rate since two of them implement recursive technique in their selection.
By changing kernel function used in classification with 147 features, the best kernel function that results the highest average accuracy and most stable is linear kernel. As shown in Table 4, accuracy rate obtained in each fold reaches 100%. This result can be possibly happened because the dataset condition can be separated using only a straight line hyper plane, without using
curved hyper plane or mapping dataset. It can be caused by several feature selection methods used in experiment are based on linear model. For example, fisher linear discriminant is based on linear equation and SVM-RFE which is trained using linear kernel.
4 CONCLUSION
5496 Another procedure used for increasing classification performance is data integration. Several cancer classifications are only based on clinical data, which is in this experiment proved to have low accuracy rate. It becomes different when the clinical data is integrated with microarray data which has passed dimensionality reduction process.
5 FUTURE WORK
For future work, larger dataset and different data integration model will be used to test the combination of feature selection method using data mining and kernel based classification. Other than that, classification will be conducted using semi supervised learning where training data also consists of unlabelled data. Also, the experimental comparisons with other methods need to be conducted .
REFRENCES:
[1] A. Daemen, O. Gevaert, and B. De Moor, “Integration of Clinical and Microarray
Data with Kernel Methods”, Conference of
the IEEE EMBS, Lyon, 2007, pp. 5411-5415.
[2] A. H. Chen and C. Yang, “The Improvement of Breast Cancer Prognosis Accuracy from Integrated Gene Expression and Clinical
Data”, Expert System with Application, Vol
39, 2012, pp. 4785-4795.
[3] B. Chandra and M. Gupta, “An Efficient
Feature Selection Approach for
Classification of Gene Expression Data”, Journal of Biomedical Informatics, 2011, pp. 529-535.
[4] E. de Rinaldis, “DNA Microarrays: Current
Applications”, Norfolk: Horizon Scientific
Press, 2007.
[5] I. Wasito, A. N. Istiqlal, M. Sadikin, and I. Budi, “Empirical Evaluation of Integration of Biological Data Model using Kernel
Based Approach”, Journal of Convergence
Information Technology, IX(1), 2014, pp. 45-51.
[6] J. Han, “Data Mining: Concepts and
Techniques”, Elsevier Inc, San Fransisco,
2006.
[7] P-N. Tan, M. Steinbach, and K. Vipin,
“Introduction to Data Mining”, Pearson
Education Inc., Boston, 2006.
[8] T. Latkowski and S. Osowski, “Data Mining for Feature Selection in Gene Expression
Autism Data”, Expert Systems with
Applications, Vol 42, 2015, pp. 864-872. [9] V. N. Vapnik, “The Nature of Statistical
Learning Theory”. Springer-Verlag, New
York, Berlin, Heidelberg, 1999.
[10] Z. Mao and W. S. Cai, “Selecting Significant Genes by Randomization Test for Cancer Classification Using Gene Expression
Data”, Jurnal Biomedical Informatics,
2013, pp. 594-601.
[11]. C.Y.Soon, I. Wasito and S.Z. Mohd Hashim.
2010. Kernel Dimensionality Reduction Evaluation On Various Dimensions of Effective Subspaces for Cancer Survival Analysis. Proceeding in International Conference on Information Sciences, Signal Processing and their Application (ISSPA) 2010, Kuala Lumpur, Malaysia.
[12] WHO. “Fact Sheet: Noncommunicable Diseases” .http://www.who.int/ /mediacentre/factsheets/fs355/en/ , 17/10/2016.
[13] Khademi, M., Nedialkov N.S. “Probabilistic Graphical Models and Deep Belief Networks
for Prognosis of Breast Cancer”, IEEE 14th
International Conference on Machine Learning and Applications (ICMLA), IEEE, 2015.
[14] Fakoor, R., Ladhak, F., Nazi, A., Huber, M. “Using Deep Learning to Enhance Cancer
Diagnosis and Classification”, Proceedings
of the 30th International Conference of Machine Learning, JMLR: WCP, Vol. 28, Atlanta, Georgia, USA, 2013.
[15] Fakhirah D. Ghaisani, Ito Wasito, Muh Faturrahman, Ratna Mufidah. Prognosis Cancer Prediction Model using Deep Belief
Network. Journal of Theoretical and Applied
Information Technology. Vol 95 No 20, 2017. [16] Abdel-Zaher, A. M., Eldeib, A. M. “Breast Cancer Classification Using Deep Belief
Networks”, Expert Systems with Applications,
5497
5498
![Figure 2: Data Integration Framework [10]](https://thumb-us.123doks.com/thumbv2/123dok_us/8902510.955454/9.612.92.577.52.607/figure-data-integration-framework.webp)