© 2017, IRJET | Impact Factor value: 5.181 | ISO 9001:2008 Certified Journal | Page 432
COMPARATIVE STUDY ON FLEXURAL STRENGTH OF M20 GRADE BEAM
WITH LAPPING OF BARS
Mr. Siddanagoud Hadimani
1, Prof. Praveen.M.Biradar
2,
1 Student, Structural Engineering,Dept. of Civil Engineering B.L.D.E.A’s P.G.H.C.E.T, Vijaypur-03, Karnataka.
2
Assist.Prof. Dept. of Civil Engineering,B.L.D.E.A’s P.G.H.C.E.T, Vijaypur-03, Karnataka.
---***---Abstract -
Increasing demands of the new millennium forsustainable and durable structures, and the limited available resources, have awakened the need for newer construction technologies and efficient use of structural materials.
As the steel length is not enough for the large constructions, the use of multiple bars over each other is required which is termed as lapping of bars. The lapping percentage varies for different type of members. As the lapping percentages varies the properties of the member varies.
Manufactured sand is a substitute material for watercourse sand. Due to fast growing production industry, the demand for sand has improved. The availability of river sand is decreasing day by day so, M-sand is being adopted as it is easily available and less transportation cost.
The result shows that in Deflection versus Load, Deflection is linear up to the first crack after which it fails and shows sudden variation. From the obtained results we can conclude that the lapping percentage increases the load carrying capacity of the beam increases. Zero percentage lapping of reinforcement is showing the maximum load carrying capacity when compared to 25, 50 and 100 percentage lapping. It concludes that lapping plays a major role in large span construction. It is better not to provide lapping but for large spans single bar cannot cover the whole length hence lapping two bars is essential. In such situation the 100 percentage of lapping should be provided.
Key Words: M-sand, lapping, Flexure, LVDT’s
1.
INTRODUCTION
Concrete is strong in compression but weak in tension, in order to overcome this problem steel is provided which takes the tension and operate effectively under service load conditions. Plain cement concrete fails suddenly but reinforced concrete member gives sufficient warning before failure. This makes the steel most required material to be
used along with the concrete. As the steel length is not enough for the large constructions,
the use of multiple bars over each other is required which is termed as lapping of bars. The lapping percentage varies for different type of members. As the lapping percentages varies the properties of the member varies.
One of the main properties associated with the concrete is flexural strength. In last few decades many researchers have studied on this property and lapping separately. In this project the attempt is made to determine the flexural strength of concrete by varying the percentage of lapping. Selecting the correct proportion of ingredients of concrete like cement, fine aggregates, coarse aggregate and water is very essential during mix design, to produce the concrete of desired properties. The grade of cement, type of aggregates being used may vary but the strength is to be achieved as required.
Manufactured sand is a substitute material for watercourse sand. Due to fast growing production industry, the demand for sand has improved. The availability of river sand is decreasing day by day so, M-sand is being adopted as it is easily available and less transportation cost.
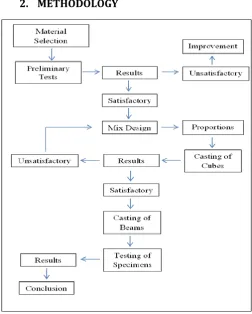
[image:1.595.307.560.423.738.2]2.
METHODOLOGY
© 2017, IRJET | Impact Factor value: 5.181 | ISO 9001:2008 Certified Journal | Page 433
3.
PRELIMINARY TESTING OF MATERIAL
Sl.n
o Test Name Results
1 Fineness of cement 4.66%
2 Standard Consistency of cement 26%
3 Initial Setting time of cement 39min
4 Final Setting time of cement 9:21hrs
5 Specific Gravity of cement 3.23
6 Specific Gravity of fine aggregate 2.805
7 Specific Gravity of Coarse Agg. 2.85
8 Particle size distribution of Fine Agg. Zone-I
9 Particle size distribution of Coarse
Agg. 20mm size
4.
CONCRETE MIX DESIGN
The mix design for M-20 grade concrete is done by referring to IS: 10262-2009.
Quantities Obtained:
1) Water Cement Ratio = 0.50
2) Cement = 394kg/m3
3) Water = 197lit/m3
4) Coarse Aggregates = 1048kg/m3
5) Fine Aggregates = 879.69kg/m3
Mix Proportion:
Cement : Coarse Agg.: Fine Agg = 1: 2.22 : 2.65.
5.
WORKABLITY TEST BY SLUMP CONE
METHOD.
Dimensions of Slump Cone are as follows:
1) Height, (h) = 30 cm
2) Bottom Diameter,(D1) = 20 cm
3) Top Diameter, (D2) = 10 cm
4) Tamping rod of size 16 mm diameter and 60 cm
long, rounded at one end.
5) Quantity of materials used for slump test is
6) Volume of cone, V = (Π/4) x d2 x h
7) d2 = (D1 + D2)/2 = (0.20 + 0.10)/2 = 0.15 m
8) Therefore, V = (Π /4) x 0.152 x 0.3 = 0.0053 m3
9) Taking 25% extra material, considering wastage
10) Cement = 394 x 0.0053 x 1.25 = 2.61 kg
11) Sand = 878 x 0.0053 x 1.25 = 5.81 kg
12) Coarse Aggregate =1048 x 0.0053 x 1.25 = 6.94 kg
13) w/c = 0.5
14) Water = 0.5 x 2.61 = 1.30 litres
Results
The workability of the mix as obtained is have a slump value of 87mm.
Fig5.1 Concrete Slump.
6.
PRELIMINARY TESTING OF MATERIAL
The cubes used = 150mm x 150mm x 150mm. Quantity of Materials used for cubes are as follows:
1) The proportion from mix design is 1: 2.22: 2.65 for 1m3 2) Volume of 1 cube =( 0.15 x 0.15 x 0.15 ) = 0.003375 m3 3) For 3 cubes the volume =( 3 x 0.003375 ) = 0.010125 m3 4) Cement = 394 x 0.010125 = 3.98 kg
5) Sand = 878 x 0.010125 = 8.89 kg
6) Coarse Aggregate = 1048 x 0.010125 = 10.61 kg 7) w/c = 0.50
8) Water = 0.50 x 3.98 = 1.99 litres.
Fig6.1 Casted Cubes used for testing.
Results:
Obtained on 28th day, while all the cubes having Area of 22500mm2.
Sl.
No Concrete Grade of Load (kN)
Comp. Strength (N/mm2)
Avg. Comp. Strength (N/mm2)
1 M20 495 22
22.33
2 M20 517.5 23
© 2017, IRJET | Impact Factor value: 5.181 | ISO 9001:2008 Certified Journal | Page 434
7.
BEAM DETAILS
1) Size of beam : 1.8m X 0.2m X 0.15m
2) Grade of Steel : Fe415
3) Cover : 25mm
4) Bottom bars : 2# 12mm
5) Top bars: 2# 10mm.
6) Stirrups: 2Legged 6mm.
8.
LAPPING LENGTH PROVIDED IN BEAM
1) Beam 1: 0%
2) Beam 2: 25%
3) Beam 3: 50%
4) Beam 4:100%
9.
FLEXURAL STRENGTH OF BEAM
1) Cover = 25 mm
2) Effective Length, (l) = 1.5 m 3) Bottom bars: 2#12mm 4) Top bars: 2#10mm 5) fy = 415 N/mm2 6) fck = 20 N/mm2 7) b = 150 mm
8) d = (200-25-12)/2 = 169 mm 9) Ast = 226.19 mm2
10) xu/d = 0.87*fy*Ast/0.36fck*b*d
xu/d = (0.87 x 415 x 226.19)/(0.36 x 20 x 150 x 169) = 0.447 mm
11) Mu,lim = 0.36 Xu/d*(1- 0.42 xu/d)*b*d2*fck Mu,lim = 11.12 kN-m
12) Mu = (Wu*l)/6
13) Wu =4.44tonnes = 4.44 x 10 = 44.4 kN
10.
LOADING SETUP FOR TESTING OF BEAM
Fig9.1 Beam Setup Model
1) The beam size of 1800 x 200 x 150 mm in the strength of 20Mpa is casted with different percentage of lapping.
2) Beams are tested by 1000 KN loading frame with hydraulic jack of capacity 2000KN. Load is applied on the
beam by using two pint loading system to provide constant moment.
3) The beam was supported on two simple supports resting on steel plates of size 200 mm x 100 mm.
4) The front face of the specimen was white washed and marked with grids of size 50 mm x 50 mm to study the crack propagation.
5) The LVDT’s and PI gauges are attached at the center of the specimen along the depth of the beam to locate the neutral axis.
6) The deflections of the beam at the center, at the 1/3rd of the span and end settlements were measured by means of LVDT’s and dial gauges.
7) Four LVDT’s were used at different points viz., one at center bottom position of beam to measure the deflection second and third at the front face if the beam to measure the compression and tension and forth LVDT is attached to the projected reinforcing bar to measure its nature of compression or tension.
8) Based on the observation, the graphs are being plotted for load vs. displacement and value vs. time.
9) The load is applied gradually and the readings are measured for every 2 sec.
10) The crack pattern is captured and the failure of beam
is determined at particular load.
10.
RESULTS & DISCUSSIONS
BEAM TEST – I
M20 with 0% lapping provided.
Graph10.1 Load vs. Deflection
Discussion
© 2017, IRJET | Impact Factor value: 5.181 | ISO 9001:2008 Certified Journal | Page 435
As it can be seen in the graph, Initial variation indeflection is due to the occurrence of cracks. In this case of 0% lapping the beam failed at 35.9 kN.
BEAM TEST – II
M20 with 25% lapping provided.
10.2: Load vs. Deflection graph
Discussion
Here, the relation between load and deflection of RCC beam is studied, the graph is plotted load in kN along X-axis versus the deflection in mm along Y-X-axis. When the load is applied to the beam deflection occurs. The results obtained shows that as the load increase the deflection also increases.
As it can be seen in the graph, Initial variation in deflection is due to the occurrence of cracks. In this case of 25% lapping the beam failed at 34.8 kN.
BEAM TEST – III
M20 with 50% lapping provided.
Graph 10.3: Load vs. Deflection Graph
Discussion
Here, the relation between load and deflection of RCC beam is studied, the graph is plotted load in kN along X-axis versus the deflection in mm along Y-X-axis. When the load is applied to the beam deflection occurs. The results obtained shows that as the load increase the deflection also increases.
As it can be seen in the graph, Initial variation in deflection is due to the occurrence of cracks. In this case of 50% lapping the beam failed at 35.2 kN
BEAM TEST – IV
M20 with 100% lapping provided.
Graph10.4: Load vs. Deflection Graph
Discussion
Here, the relation between load and deflection of RCC beam is studied, the graph is plotted load in kN along X-axis versus the deflection in mm along Y-X-axis. When the load is applied to the beam deflection occurs. The results obtained shows that as the load increase the deflection also increases.
As it can be seen in the graph, Initial variation in deflection is due to the occurrence of cracks. In this case of 100% lapping the beam failed at 35.4 kN
11.
CAPACITY CURVE
Graph10.5: Capacity Curve
Discussion
1) As the lapping percentage increases the load carrying
capacity of the beam increases.
2) Zero percentage lapping of reinforcement is showing
© 2017, IRJET | Impact Factor value: 5.181 | ISO 9001:2008 Certified Journal | Page 436
3) As the lap length is less in 25% it fails earlier when
compared to 50 and 100% lap where the lap length is more.
12.
CONCULSION
1) The following conclusions can be drawn from the
results obtained
2) The load-defection and flexural capacity of the beams
are determined by this experiment
3) The use of M-sand is found suitable for alternative to
river sand.
4) From this experiment it is seen that Zero percentage
lapping of reinforcement is having the maximum load carrying capacity of 35.90kN when compared to 25, 50 and 100 percentage lapping bars which are having 34.8kN, 35.2kN, & 35.4kN load carrying capacity respectively. It concludes that lapping plays a major role in large span construction.
5) Zero percentage lapping bars shows 12 mm deflection
whereas 25% 50% 100% lapping bars shows the deflection of 7.36mm, 8.5mm, 10mm respectively.
6) It is better not to provide lapping but for large spans
single bar cannot cover the whole length hence lapping two bars is essential. In such situation the 100 percentage of lapping should be provided.
7) From the above results we can also conclude that, as
the lapping percentage of bar increases the load carrying capacity also increases
REFERENCES
1) Hudson (1997), “Experimental study on performance
of concrete by using manufacture sand”.
2) Chinn, Ferguson and Thompson (1955), “Investigation
on behaviour and strength of lap splice in RC Beams”.
3) H. Donza, O. Cabrera, E.F. Irassar (2002), “Study on
high strength concrete with different fine aggregate, cement and concrete”.
4) Mahmoud A. El-Azab, Hatem M. Mohamed, Ahmed
Farahat (2014), “effect of tension lap splice on the behavior of high strength self-compacted concrete beams”.
5) Magda I. Mousa (2015): “Flexural behaviour and
ductility of high strength concrete (HSC) beams with tension lap splice”.
6) Ahmed El-Azab, Hatem M. Mohamed (2014),”Effect of
tension lap splice on the behaviour of high strength concrete (HSC) beams”.
BIOGRAPHIES
Mr. Siddanagoud Hadimani Student, Mtech Structures, B.L.D.E.A’s P.G.H.C.E.T, Vijaypur-03 Karnataka.
Prof. Praveen.M.Biradar Assistant Professor, Dept. of Civil Engineering,